Improving Occupant's sleep quality with the help of OURA ring and data from Smart Buildings - ANAS AL RAHIS OSMAN OSMAN
←
→
Page content transcription
If your browser does not render page correctly, please read the page content below

EXAMENSARBETE INOM TECHNOLOGY,
GRUNDNIVÅ, 15 HP
STOCKHOLM, SVERIGE 2021

Improving Occupant’s sleep
quality with the help of OURA ring
and data from Smart Buildings

ANAS AL RAHIS

OSMAN OSMAN

KTH
SCHOOL OF ELECTRICAL ENGINEERING AND COMPUTER SCIENCE
i

Improving Occupant’s sleep quality
with the help of OURA ring and data
 from Smart Buildings.

 Anas Al Rahis, anasar@kth.se

 Osman Osman, oosman@kth.se

 Examiner: Anders Västberg

 Academic adviser: Morteza Esmaeili Tavana

 Industrial adviser: Elena Malakhatka

KTH Royal Institute of Technology

School of Electrical Engineering and Computer Science
(EECS)

SE-100 44 Stockholm, Sweden
ii

Abstract
Well-being is associated with comfort and health, and it represents wellness and quality of life.
Sleep quality is an important index when evaluating a person’s well-being. KTH Live-in-lab
performs Human-building interaction studies to explore the growing potential of how built
environments, measured by Schneider Electric (SE), can influence humans and their well-being in their
everyday lives. This thesis works as an explorative study of using the OURA ring to evaluate sleep
quality for tenants living in KTH LiL. Specifically, this project aims to assess the quality of the data
collected from the ring and SE sensors by using Total Data Quality Management (TDQM) and propose
a Multilayer perceptron (MLP) model for predicting sleep scores. Results first showed that the OURA
ring is an appropriate tool for evaluating sleep quality. Its data passed 11 TDQM’s dimensions,
including accuracy, objectivity, relevancy, interpretability and understandability. Second, the OURA
was able to capture the relationship between sleep quality and building’s temperature and humidity
through its sleep scores. Results showed that higher sleep scores situated more around the suggested
ideal ranges of temperature and humidity. However, some low sleep scores were also situated around
these ideal ranges which suggests that an additional study needs to be conducted. Such a study would
take in tenants’ feedback in order to distinguish sleep scores heavily affected by psychological and/or
other factors rather than built environments. Third, we were able to create an MLP model to predict
sleep scores based on temperature and humidity values as well as user-related information, like activity
rate and total burn. The model had validation and training losses converging at 1.90-2.50. Those low
loss rates suggest that the building's temperature and humidity along with information about tenants
from the ring can be used to improve the sleep scores. This model can be extended into a
recommendation model where buildings’ operators and tenants can benefit from. Buildings’ operators
would get information and recommendations on how to properly administer their buildings to achieve
higher well-being for their tenants. Also, tenants would get recommendations on how to increase their
sleep scores and, ultimately, their sleep qualities and well-being.

Keywords

Thermal Comfort, Sleep Quality, Well-being, Wearable Devices, Artificial Intelligence, Smart Buildings
iii

Sammanfattning
Välbefinnande är förknippat med komfort och hälsa, och det representerar livskvalitet. Sömnkvalitet är
ett viktigt index när man utvärderar människors välbefinnande. KTH Live-in-lab utför
interaktionsstudier mellan Människor-Byggnader interaktion för att utforska den växande potentialen
för hur byggda miljöer, mätt av Schneider Electric (SE), kan påverka människor och deras
välbefinnande i vardagslivet. Denna avhandling fungerar som en explorativ studie av att använda
OURA-ringen för att utvärdera sömnkvaliteten för hyresgäster som bor i KTH LiL. Specifikt syftar
detta projekt till att bedöma kvaliteten på de data som samlats in från ring- och SE-sensorerna genom
att använda Total Data Quality Management (TDQM) och föreslå en Multilayer perceptron (MLP) -
modell för att förutsäga sömn resultat. Resultaten visade först att OURA-ringen är ett lämpligt verktyg
för att utvärdera sömnkvaliteten. Dess data passerade 11 TDQMs dimensioner, inklusive noggrannhet,
objektivitet, relevans, tolkbarhet och förståbarhet. För det andra kunde OURA fånga förhållandet
mellan sömnkvalitet och byggnadens temperatur och fuktighet genom sina sömnvärden. Resultaten
visade att högre sömn värden ligger mer runt de föreslagna ideala temperatur- och luftfuktighet
områdena. Några låga sömn resultat låg dock också runt dessa ideala intervall, vilket tyder på att
ytterligare en studie måste genomföras. En sådan studie skulle ta hyresgästernas återkoppling för att
urskilja sömn poäng som påverkas starkt av psykologiska och / eller andra faktorer förutom de byggda
miljöer. För det tredje kunde vi skapa en MLP-modell för att förutsäga sömn värden baserat på
temperatur- och luftfuktighets värden samt använda relaterad information, som aktivitetsgrad och totalt
bränn. Modellen hade validering och näringsförluster som konvergerade vid 1,90-2,50. Dessa låga
förlust nivåer antyder att byggnadens temperatur och luftfuktighet tillsammans med information om
hyresgäster från ringen kan användas för att förbättra sömn värdena. Denna modell kan utvidgas till en
rekommendation modell där byggnadens operatörer och hyresgäster kan dra nytta av. Byggnadens
operatörer skulle få information och rekommendationer om hur de ska förvalta sina byggnader på rätt
sätt för att uppnå högre välbefinnande för sina hyresgäster. Hyresgästerna skulle också få
rekommendationer om hur man ökar sina sömn värden och i slutändan deras sömnkvaliteten och
välbefinnande.

Nyckelord

Termisk Komfort, Sömnkvalitet, Välbefinnande, Bärbara Enheter, Artificiell Intelligens, Smarta Byggnader
iv

Acknowledgments
Throughout the writing of this report, we have received a great deal of help and support, that we could
not complete this work without. We would like to thank our main Examiner (Anders Västberg) for all
the help and support he gave us, for his great feedback and worthy comments that we received from
him. We also would like to thank our Academic supervisor (Morteza Esmaeili Tavana), his contributions
and assistance have been a great addition to the project. Also our industrial supervisor (Elena
Malakhatka) , without her assistance and instructions we would not be able to finish this work, she gave
us a generous amount of help and support, she provided consistent feedback and kept on everything we
did to ensure that we are going in the right direction.

Stockholm, June 2021

Anas Al Rahis

Osman Osman
v

Table of Contents

Abstract ii

Sammanfattning iii

Acknowledgments iv

List of Figures vii

List of Tables viii

List of acronyms and abbreviations ix

1 Introduction 1
 1.1 Problem 2
 1.2 Purpose 2
 1.3 Goals 2
 1.4 Delimitations 3
 1.5 Structure of this report 3

2 Background 4
 2.1 Thermal Comfort 4
 2.1.1 HVAC Systems 6
 2.2 Sleep Quality 6
 2.3 Wearables and The OURA ring 6
 2.4 KTH Live-in lab
 2.5 Related Work 9
 2.5.1 Sensing occupant’s thermal comfort using wearable technology 9
 2.5.2 Experimental study on thermal comfort of sleeping people at different air
 temperatures 9
 2.5.3 Effects of thermal environment on sleep and circadian rhythm 10

3 Methodology 10
 3.1 Research Process 11
 3.2 Research phases 11
 3.3 Sampling, Methods and Programming 12
 3.3.1 Sampling 12
 3.3.2 MongoDB 12
 3.3.3 TDQM: Total Data Quality Management 13
 3.3.4 Multilayer perceptron (MLP) 13
 3.3.5 Programming 14

4 Implementation 15
 4.1 Database 15
 4.1.1 Extract 15
 4.1.2 Transform 15
 4.1.3 Load 16
 4.2 TDQM 16
 4.3 Modelling 18
vi

5 Results and Analysis 22
 5.1 Data Quality Assessment Results (TDQM) 22
 5.2 Further Analysis Results 26
 5.3 Modelling Results 28
 5.4 Discussion 29

6 Conclusions and Future work 31

7 References 34
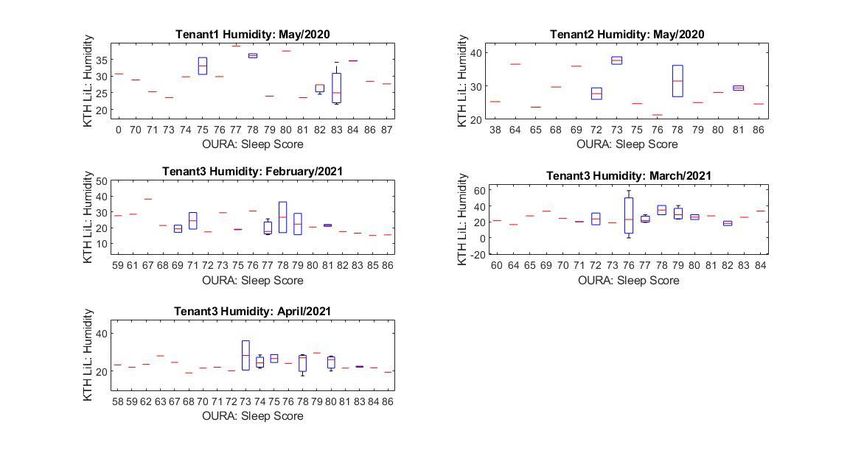
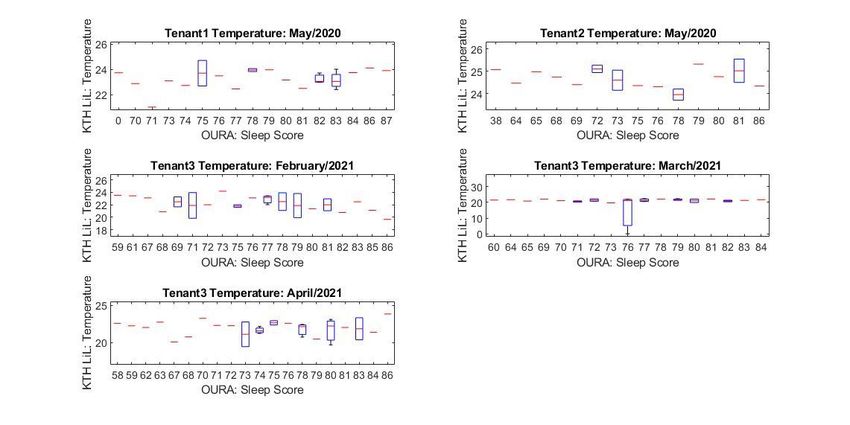
vii

List of Figures
Figure 2.1: seven-point thermal sensation scale

Figure 2.3: a picture of the ring with a clear view on the three mentioned sensors.

Figure 3.2.1 : Research phases.

Figure 3.3.2: Multilayer perceptron model

Figure 4.1: ETL data pipeline.

Figure 4.3.1: The ANN structure of our model.

Figure 4.3.2: Visual representation of the RELU activation function.

Figure 4.3.3: Loss/validation testing results.

Figure 5.2.1: Sleep score vs Relative humidity

Figure 5.2.2: Sleep score vs temperature (°C)

Figure 5.3.1: Loss/validation results

Figure 5.3.2: Predicted/Actual sleep scores.
viii

List of Tables
Table 2.1: primary factors that are taken into account when evaluating thermal comfort

Table 4.2.1 : Definitions of metrics and dimensions

Table 4.2.2: Data quality dimensions [Wang & Strong, 1996:20]

Table 5.1: Summary of the data quality assessment results.
ix

List of acronyms and abbreviations
1- ICT : Information and communication technology.

2- HBI: Human-Building interaction.

3- KTH LiL: KTH Live-in-Lab.

4- TA: Ambient temperature.

5- IoT: Internet of Things.

6- ANN: artificial neural network.

7- SE: Schneider Electric.

8- HVAC: Human ventilation and air conditioning.

9- TC: Thermal Comfort.

10- PMV: Predicted mean vote.

11- EEG: Electroencephalogram.

12- SWS: Slow-wave Sleep.

13- TDQM: Total Data Quality Management.

14- MLP: Multilayer perceptron.

15- ETL: extract, transform, and load

16- ReLU: Rectified Linear Activation Function

16- SGD: Stochastic Gradient Descent

17- RHR: Resting heart rate

18- HRV: Heart rate variability

19- VC: Vapnik–Chervonenkis

20- NW: Number of weights

21- AI: Artificial Intelligence
x
1

1 Introduction
 Information and communication technology (ICT) has many applications nowadays, and it
plays a significant role in enhancing people’s lives. It has considerable contributions in many fields,
like education, medicine, transportation, and agriculture. ICT also contributes to the buildings’ sector.
A building’s life cycle can be automated with ICT devices by integrating leading technologies in the
systems and operations that make up the entire building. These types of buildings are typically referred
to as “Smart Buildings''. A building generally requires many technologies to attain the “Smart Building”
property; such technologies include human-computer algorithms, big data analytics, sensors, and cloud
computing [1].
 Furthermore, a building is built to perform spatial and physical functionalities that hold social
values. The physical relates to the shaping and decorations, and the other relates to the spatial
arrangement of activities and relationships [2]. Taking that in mind, one can use the human-building
interaction (HBI) to design the appropriate building. HBI refers to the interface between tenants and
their surrounding buildings’ spaces by focusing on the functionalities’ interactions and interconnections
[3]. So, the Human-building interaction study provides interactive opportunities for tenants to form
spatial, physical, and social functionalities in their built environment [4].
 KTH Live-in-Lab (LiL) performs Human-building interaction studies to explore the growing
potential of how the built environment can influence humans in their everyday lives. It uses smart
buildings to create test-beds that accelerate innovation in the construction sector and reduce the lead
time between research results and market introduction. KTH LiL puts the occupants’ in the center of its
focus when implementing new test-beds, which allows it to study the end-users and their surroundings’
built environment. The occupants’ built environment at KTH LiL are measured by using multiple
Schneider Electric (SE) sensors. However, when trying to thrive for occupants’ well-being and comfort,
access to their body signals is essential. That is where ICT-enabled wearable devices come into play.
 SE wanted to contribute to a more innovative construction sector and expand its cooperation
with the KTH LiL in 2019. Schneider Electric will actively participate in research and development at
the lab for three years by contributing to consulting, services, and technology. All the environmental
parameters that are used in this project are taken from SE sensors, which are monitored inside KTH LiL
buildings. [15]
 In the general press, and in guidelines and recommendations, well-being (also spelled wellbeing
or well being) is often simplistically intended as synonymous with wellness, happiness, and quality of
life, or associated with comfort and health [5]. Sleep quality is one of the most important indices for
evaluating human well-being. The majority of the previous studies focused on two factors: 1. The
physical disturbances such as the mobile phone and acoustic noises in the surrounding area. 2. Medical
issues such as sleep apnea and psychiatric disorders. A few pieces of research considered environmental
factors such as ambient temperature (TA), relative humidity, CO2 levels. Previously, studying those
factors was challenging as it required expensive equipment and measurement tools. Nowadays, with
the emergence of the internet of things (IoT), wearable devices, and artificial intelligence, it is possible
to investigate the impact of environmental factors. Therefore, we will study the possibility of using
collected data from small wearable devices to improve tenant’s sleep quality by achieving ideal
surrounding built environment.
2

1.1 Problem
Wearable devices are small, technical devices that provide informative information about the human
body. They come in different shapes and are commercialized for their specific objectives. For example,
wristbands and straps are used for fitness tracking by monitoring vital signs and activity rates. Recently,
there has been an increase in wearable devices that provide precise and detailed physiological
information about the human body, which shows hidden knowledge about the body that could easily
contribute to better wellbeing. The OURA Ring is one of those wearable devices that explicitly monitors
sleep and activity rate qualities. OURA Ring provides informative data about users’ daily health. It
analyzes the users by measuring and detecting their body signals. The ring uses the data to calculate,
with embedded algorithms, the qualities of sleep and activity rates. KTH LiL requires a passive way to
get personal body-related information about their tenants in order for them to use the human-building
interaction methods to adjust the built environment to increase the wellbeing of their tenants. In this
study, KTH LiL addresses wellbeing by studying the sleep quality of tenants, and the OURA ring has
been chosen for this study because of its commercialized high-quality nighttime data. Moreover, there
is a lack of sleep quality research that does not depend on users’ feedback, controlled environments, or
expensive polysomnography. The objective of this study is to address the following research questions:

 ● What are the possibilities and limitations of measuring sleep quality from built environments
 and the OURA ring in the real-life context?
 ● Is it possible to use artificial neural networks (ANNs) for predicting sleep qualities for the
 tenants?
 ● Can the data from the OURA ring and SE sensors be used for providing personalized
 instructions for its users to increase their sleep qualities?

1.2 Purpose
The purpose of the degree project is to work as an explorative study for the real-context-driven research
of sleep quality at KTH Live-in-Lab using the OURA ring. This thesis will benefit future researchers
working on physiological measurement-based approaches for human-centered sleep quality by giving
them a headstart on what the data collected from the OURA ring can provide and the potential
limitations. This project will also serve different stakeholders in the real estate industry and the smart
buildings industry. For example, this will help building owners by providing better thermal comfort
solutions and giving enough information about energy consumption inside the building. It will also
serve the occupant as a stakeholder by maintaining sleep quality and as a result improving their
wellbeing in general. However, there are some ethical concerns regarding the data being collected, and
there might also be social concerns regarding the impact of those systems on the tenant’s lifestyle.

1.3 Goals
The goals of this project are twofold:

 1. Assess the quality of the data collected from the OURA ring.
 2. Investigate whether the data from OURA can be used in combination with the data from SE in
 KTH LiL to create an appropriate model for sleep quality evaluation.

These goals have been divided into the following sub-goals:
3

 1. Data storage: Building a data storage with an appropriate data structure from the OURA ring
 and Schneider Electric data.
 2. Data quality assessment: What are the possibilities and limitations of measuring sleep quality
 in a real-life context with the use of the OURA ring?
 3. Modeling: Building an ANN for improving sleep quality with the OURA ring and SE sensors’
 data based on the possibilities and limitations concluded about the data from sub-goal 2.

 The final deliverables we anticipate from this project is to have a complete functioning database
that has all the information we need. The database should be well organized and easy to access. We also
should have the model completely functioning and delivering useful results or information on why this
approach might (not) work.

1.4 Delimitations
We have some limitations in the thesis project. First, we do not have any feedback from the users.
Second, we will not test the modeled algorithm in real-time applications. Third, our modeled algorithm
will be limited to predicting a user’s upcoming sleep score. Fourth, we have a limited amount of data
due to a lack of participants. Furthermore, the delimitations of the thesis project are the psychological
and emotional effects on sleep, non-nighttime sleep, and health issues. Psychological, emotional, and
health issues have huge effects on sleep quality. Since we will not be taking feedback from users, it will
be hard to notice those effects. Moreover, non-nighttime sleep is of no importance to us since our test
subjects follow the regular sleep schedule (nighttime sleep).

1.5 Structure of this report
Chapter 2 presents relevant background information about thermal comfort, Human, ventilation and air
conditioning (HVAC) , sleep quality, wearables and OURA ring, and KTH Live-in-Lab.

Chapter 3 presents the methodology used to solve the problem.

Chapter 4 presents the implementation, describes the algorithm, and discusses the internal structure of
the project.

Chapter 5 presents the results and analyzes them.

We conclude the discussion in Chapter 6 by presenting the final answers to our research questions. We
also present the basis and foundation for any future work that’s being conducted in this area.
4

2 Background
This chapter provides basic background information regarding thermal comfort and HVAC systems.
Additionally, it illustrates the importance of sleep quality and the impacts of thermal comfort on it. It
provides a brief description of IoT, artificial intelligence, smart systems, and wearable devices. Finally,
it introduces the KTH LiL.

2.1 Thermal Comfort
Thermal comfort (TC) is the ideal point (sometimes called the equilibrium point) of the surrounding
environment's thermal conditions, giving humans the best sleeping quality. It is evaluated directly based
on the tenant’s feedback and feelings. There exist many models to evaluate the TC of a human being.
Among these is the well-known predicted mean vote (PMV).

PMV is an index that predicts the mean value of votes of a large group of people. The prediction is
made on a seven-point thermal sensation scale, ranging from +3 (hot) to -3 (cold) [6]

 Figure 2.1: seven-point thermal sensation scale

However, regardless of the applied model, there are always six parameters that must be addressed when
evaluating thermal comfort. Those parameters are divided into:

1- Individual (directly related to the person) refers to the metabolic rate and clothes insulation level.

2 Environmental (not affected by the person's state) refers to air temperature, radiant temperature,
relative humidity, and airspeed. Some models add other secondary factors as well. [6]
5

 Table 2.1: primary factors that are taken into account when evaluating thermal comfort

Characteristics Description

Air temperature The temperature of the atmosphere, it’s a measure of how cold
 or hot the surrounding air is. [7]

Relative humidity It is a measure of the amount of water vapor in the air to the
 total amount that can ever exist in the air. Water vapor / Total
 possible water vapor RELATIVE to air temperature. [8]

Mean Radiant temperature MRT represents the mean of the radiant temperatures of the
 enclosing surfaces of a space, which is determined by the
 emissivity and the temperature of the surfaces.[45]

Air speed (Air movement) This is the rate of spatial change of air in a space, which is
 used to calculate convective heat transfer and thus changes
 the comfort zone [45]

Metabolic rate Metabolic rate is the rate of energy production of the body,
 which varies for different activities.[45]

Clothing insulation level Clothing is probably the most important variable in terms of
 adaptation to a thermal environment, and this means that
 acting on the clothing level may be very effective to reduce
 energy consumption. [45]
6

2.1.1 HVAC Systems

The heating, ventilation, and air conditioning (HVAC) represent mechanical and smart systems
monitored inside buildings. These systems provide the occupants’ desired environmental conditions
inside of their homes. The buildings are often provided with heating, ventilation, cooling, and air
conditioning equipment. Usually, the equipment is located in a dedicated room inside the building (local
HVAC systems) or outside the building (central HVAC systems). [9].

2.2 Sleep Quality
There is no quantitative definition for sleep quality, but, in general, it refers to how well a person slept.
For example, sometimes we wake up having bad mornings or feel exhausted even though we slept
enough hours to feel energetic. The reason is that we might have had inadequate sleep quality. Studies
show that good sleep quality results in a lower risk of heart disease, lower inflammation, lower
depression, and more robust immune systems. [10]

 In terms of this research, the measure of sleep quality that we will use is the one provided by
OURA API (sleep score). OURA analyzes the body dynamics such as resting heart rate (RHR),
respiration rate, different sleep cycles (light, deep, and REM), and a few other factors to determine how
well you sleep. OURA uses this metric to guide people toward better health and mental conditions; the
higher this score is, the more energetic and ready the person is for the next day. In general, a sleep score
that is above 70 is considered a good score. However, OURA does not provide any information about
how the person should adjust their surrounding environmental parameters for achieving better sleep
scores. The only information provided by their app and algorithm to increase one’s sleep score is to set
a consistent sleeping time and sleep duration for the ring-wearer.
 [11]

2.3 Wearables and The OURA ring

Wearables are smart and small technical devices that can be worn on the body or can be attached to
clothes. They are often integrated with multiple sensors responsible for providing informative
information such as heart rate, blood pressure, respiration rate, and cardio-related parameters. The
wearable devices' technology comes in different shapes and has different purposes. For example, they
can be watches, rings, or belts. In addition, a single device has several sensors to measure different
parameters. Some purposes for these devices are athletic, medical, educational, entertainment, and
business.
[12]
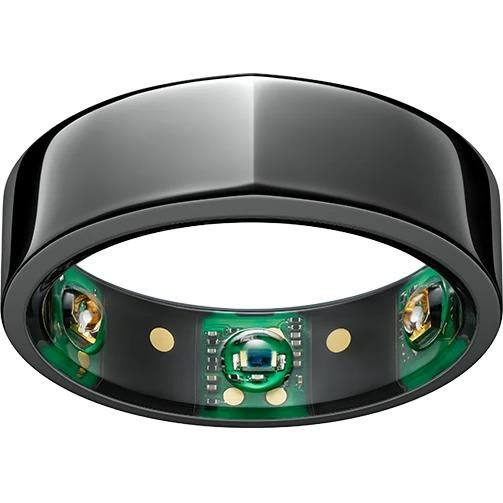
7

 The OURA ring is a smart ring that mainly aims to maintain personal health through sleep
monitoring. It has a regular ring shape, and the following sensors:

 ● NTC Temperature Sensors: this sensor is responsible for measuring the body temperature
 directly from the skin. OURA claims that by using these sensors they are able to get accurate
 measurements of the person's body temperature. According to OURA, this is a better approach
 than estimating it from the surroundings as many other companies do.
 ● OURA uses a 3D accelerometer to measure different activity and movement-related
 parameters, and they combine these parameters with the profile information that the user
 provided to get accurate analysis and data about energy expenditure and movement (steps,
 miles).
 ● Infrared light sensor: this sensor measures the respiratory rate, and the reason that OURA
 uses this sensor is due to its higher accuracy compared to other sensors like green light LEDs.
 [13]

 Figure 2.3: a picture of the ring with a clear view on the three
 mentioned sensors.
8

2.4 KTH Live-in lab
“Testbeds for innovation in building and housing sector”

KTH LiL is a multiple testbed platform that offers a full-scale test environment ranging from buildings
and installations to housing and management organizations. They perform tests for products and
services by providing the opportunity to conduct tests in actual buildings. As a result, KTH LiL helps
build a strong foundation for changing the rules in the industry. In Addition, it ensures that companies
can test their products in real environments and test how different components of their products are
affected by/affecting the results.
 They aim to achieve sustainable development in the real-estate sector and accelerate the
innovation and rate of introduction to new competitive products in the real estate and construction
sector. As KTH is the Nordic’s leading tech university and with the high-quality research that the
university provides, LiL can provide companies and students with high-quality research relevant to their
tests and projects.
[14]
9

2.5 Related Work
2.5.1 Sensing occupant’s thermal comfort using wearable technology
Both the accuracy of the data provided and the possibility of achieving TC with the use of wearable
devices have been investigated. During the construction research congress 2016, 4 researchers
published a research named: sensing occupant’s thermal comfort using wearable technology [16]. Their
main objective was to investigate the feasibility of achieving occupant’s thermal comfort using wearable
devices. They conducted an explanatory pilot study to achieve their goal, they used an application for
collecting data in indoor environmental conditions, they also used wristband wearable devices to
measure the accuracy of the data collected by the mobile phone. The study took place in a present
conditional laboratory at the University of Colorado Denver.
 They used different models to evaluate different results, however, they found that the model
that achieved the best results; is a model that used the following parameters:
Air temperature, square root of the summation of perspiration and air temperature, summation of
perspiration and relative humidity, skin temperature, and heart rate.
However they also realized that the accuracy of the results is questionable and they suggested a better
choice for wearables and sensors in future studies, but they found it possible to estimate, measure, and
achieve better thermal comfort by using wearable devices.
 The accuracy of the investigated wearable devices also depends on the year at which the study
was conducted. This study is from 2016, so wearable devices could, and probably, have become more
accurate at providing information and physiological data about their users.

2.5.2 Experimental study on thermal comfort of sleeping people at
different air temperatures

Air temperature is an important environmental contributor that affects sleep quality. A study was made
on the effects of air temperature on sleep quality and maintaining thermal comfort of sleeping people
[17]. The study conducted questionnaires and used
electroencephalogram (EEG) to evaluate sleep quality, and it used subjective assessments for thermal
comfort before and after bedtime. The study concluded that the subjects experienced lower periods of
slow-wave sleep (SWS), took longer time to fall asleep, and answered lower in the subjective
assessment when bedroom temperatures were at 23° or 30° C compared to 26° C. The study also found
that the subjects’ skin temperatures increased with bedroom temperatures and fluctuated during sleep
time and that their sleep qualities were sensitive to the change in air temperature. It is obvious from this
study and many more that air temperature is an important parameter and must be taken into
consideration when researching sleep quality and ways to improve it.
10

2.5.3 Effects of thermal environment on sleep and circadian rhythm
Another study was conducted on the effects of thermal environment on sleep and the main results were
[18]:

Heat Exposure
In situations where bed covers and clothing are used, heat exposure increases wakefulness and decreases
SWS (Deep sleep) and REM during the initial segments rather than the later segments of sleep. One
possible explanation for this is that sleep disruption in the early segments could lead to increased
demand for sleep, which may overcome the sensation of thermal comfort in the later segments of sleep.
Heat exposure disruptions do not adapt even after several days of continuous daytime and nocturnal
head exposures. Heat increase in the surrounding environment suppresses the decrease in the body’s
core temperature, which leads to disruptions in sleep in the early segments. It also increases the skin
temperature and amount of sweat loss during sleep.
 Ambient temperature (TA) cycles during sleep could affect the core temperature of the person
asleep. Decreased Ta occurring a few hours before and after sleep onset and increased TA occurring
around wake-up time increases the decline in body’s core temperature and advances its nadir compared
to constant TA. The REM cycle length is also affected by the TA. The REM is delayed in lower TA
compared to higher TA during sleep.

Humidity
 Humid heat exposure increases wakefulness, decreases SWS and REM sleep, and suppresses
decreases in body’s core temperature, but skin temperature and whole-body sweat loss do not get
affected by humid heat. Decreased humidity allows sweat to evaporate, causing the dissipation of heat.
Increased humidity, on the other hand, prevents the evaporation of sweat, which causes the skin to
remain wet. The dripping sweat and increased skin wetness decrease the sweat response due to
hidromeiosis preventing dehydration.
 Humid heat exposure in the initial segment of sleep decreases the SWS and increases
wakefulness in both segments. The decrease in SWS in the first segment causes an increase in SWS in
the later segment of sleep. This means that the humid heat exposure in the initial segments causes the
change in SWS polarity during sleep.
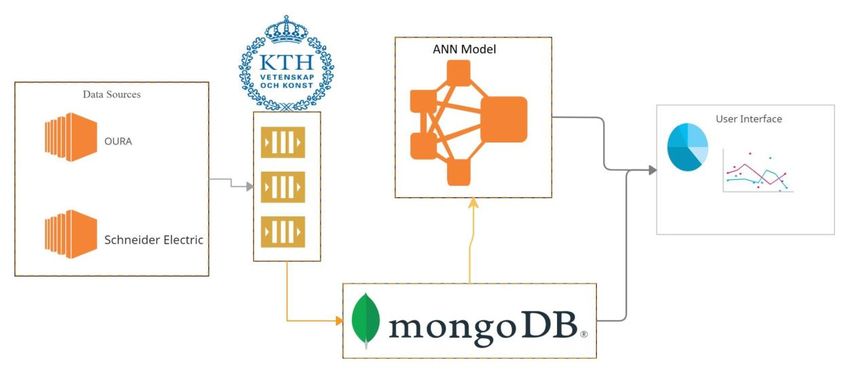
11

3 Methodology
We used different methods, and programs to conduct our research. First, the data storage part was done
using Node.js, excel, and MongoDB. Second, data quality analysis was done using Excel, Matlab, and
Total Data Quality Management method (TDQM). Third, data modelling was done with Python,
MongoDB, and the multilayer perceptron model.

The choice of these methods was made based on several factors, first we realized that the TDQM is a
well-structured method for data assessment and thus it is a convenient choice for our project. Secondly,
we had to choose a method that provides us with satisfying results in terms of data storage and at the
same time it should not be a complex method, so MongoDB was the preferred choice here. Finally, the
choice of python was based on the fact that it has many useful libraries for our project.

3.1 Research Process
In order to research our problem, KTH live-in-lab provided us with a collection of data about three
different users. It consisted of data from the wearable OURA ring and the Schneider electric sensors
located in their apartments. The OURA ring provided the physiological data about the users, and the
SE sensors provided the building’s environmental data.
 The data was tabular formatted and saved as multiple csv and xlsx files, which we imported to
excel. This format was convenient for us because it was well-structured and easy to understand. The
data of the OURA ring and SE sensors contained some irrelevant information. We removed them and
saved only the relevant parts. So, we created a database where we saved only the relevant data from
these csv and xlsx files.
 After creating a database with a suitable data structure, we moved to the data quality assessment
and data modelling stages. Those are the main stages for our explorative study. We assessed the quality
of the data, defined limitations and boundaries, built hypotheses, and suggested a deep artificial neural
network model.

3.2 Research phases
An overview of our research phases can be found in Figure 3.2.1. The general literature review includes
the pre-research and study done at the beginning of the thesis about wearable devices, OURA ring, KTH
live-in-lab, and sleep quality. Context analysis includes the analysis of infrastructure, wearable devices,
privacy and ethics, and market readiness that facilitate the environment in which this thesis research is
handled. System boundaries is the phase where the data quality management was performed. Specific
literature review, experiment design, and results evaluation include the phases where the data modelling
was done. More about those last four phases are talked about in sections 4 and 5.
12

 Figure 3.2.1: Research phases.

3.3 Sampling, Methods and Programming

3.3.1 Sampling
Two types of data are collected in this thesis. The first is building environment data collected from SE
sensors in KTH live-in lab buildings in the form of xlsx sheets. The second is physiological data
collected from the OURA rings of KTH LiL apartments’ tenants in the form of csv sheets. The data was
collected from the SE sensors installed inside the KTH live-in lab’s buildings and the OURA ring worn
by users in these apartments. To follow the GDPR data protection rules, the tenants agreed in a signed
form to use their data for a specified number of months, eliminating any possibilities of ethical or social
violations. Furthermore, the data was being collected passively, which means there were no physical
monitoring and/or tests performed on the tenants. Thus, it does not have any impact on their normal
lives.

3.3.2 MongoDB

When implementing the database, we decided on using a NoSQL database, specifically “MongoDB”.
MongoDB stores data in JSON-like documents, which means the fields can vary between documents,
and their structure is flexible and can be changed at any time. This structure allows for horizontal
scalability. That helps in accommodating large databases, which are convenient when working with
large amounts of users and building data. The documents consist of pairs of fields and values. The
values can be of any type (string, number, Booleans, and arrays). Those documents are stored in
collections similar to tables in relational databases (e.g., SQL).
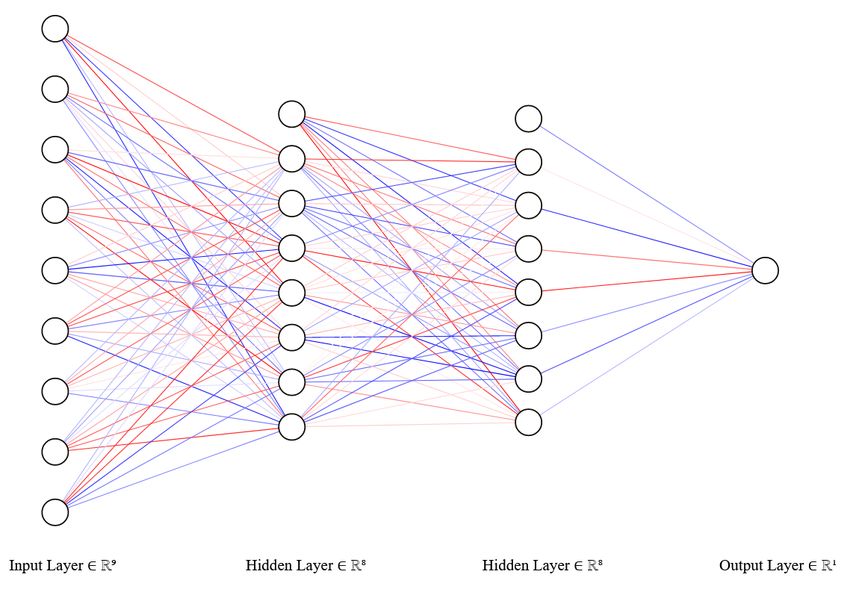
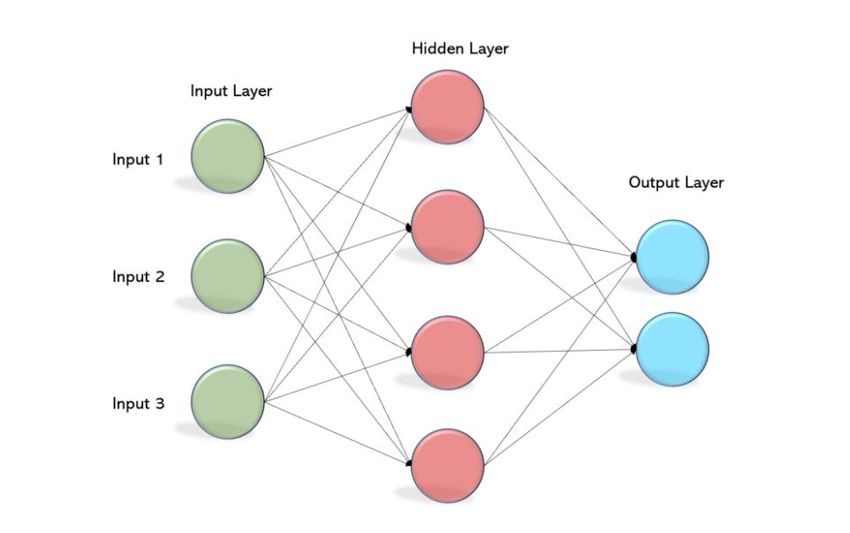
13

3.3.3 TDQM: Total Data Quality Management
The methodology selected for data quality assessments of the OURA ring and the SE sensors is TDQM.
This methodology is considered a result of the idea of “fitness for use” [Wang & Strong 1996]. This
method looks at the data as a product. All products have life cycles, and so does the data. The method
is relatively simple, and the following basic processes can summarise it:
 - Define: this process identifies the quality of information requested by information consumers.
 It also analyses the information life cycle that characterizes the production process. In our
 assessment, this process will identify the metrics and desired information that could potentially
 be used for the modeling stage of our research.
 - Measure: in this phase, we will measure the different data we have according to the metrics and
 desired information we identified in the previous process. That allows us to analyze and confirm
 what parts of our data can be used and what can not.
 - Analyze: This is a fundamental part of the assessment process. In this step, we analyze the
 results we got from the previous steps. In addition, this phase helps us identify the reasons
 behind the different data errors, which is essential for the improvement process.
 - Improve: This prioritizes the wrong data and starts by developing a plan to improve and correct
 these parts of the data. Thus TDQM is a methodology that focuses both on data quality
 assessment and data improvement. [19]

3.3.4 Multilayer perceptron (MLP)

MLP is a feed-forward deep artificial neural network, and it is applied to supervised learning. The uses
of MLP are pattern classification, recognition, prediction, and approximation. It consists of three layers:
input layer, hidden layers, and output layer, as shown in figure 3.3.2. The hidden layers’ number is
arbitrary, and they are the computational engine for MLP. As for the output layer, it is responsible for
performing the required tasks signaled in the input layer. The model trains each neuron with a
backpropagation algorithm. MLP was chosen for a few reasons. First, MLP can learn the training data’s
representation and how to best relate it to the output variables. Second, It is said that MLP can produce
useful predictions from relatively small training data (
14

 Figure 3.3.2: Multilayer perceptron model

3.3.5 Programming
A few programming languages were used to conduct this research, but most were used for limited and
short tasks.

Firstly, Matlab was used for graphing boxplots, line plots, and distribution functions to provide some
analysis and quality checks for the data. Choosing Matlab was because we had some experience with
it, and it was readily available to us. Matlab is also easy to use with a lot of functionalities, which makes
it convenient for us. Secondly, Node.js was used when implementing MongoDB. The reason for the
choice here is similar to Matlab’s; we were familiar with Node.js. Thirdly, Python was used for
modeling the deep artificial neural network. This language was chosen for modeling because Python
provides much assistance for machine learning algorithms. The simplicity of the language and assisting
libraries made Python the best choice for the programming language. [22] As for choosing the libraries,
we used Keras from Tensorflow. Tensorflow is a free and open-source machine learning library. It
provides a comprehensive, flexible ecosystem of tools, libraries, and community resources that lets
researchers push the state-of-the-art in ML and developers quickly build and deploy ML-powered
applications. [23] Keras, on the other hand, is a high-level API. Keras follows best practices for reducing
cognitive load: it offers consistent and straightforward APIs, minimizes the number of user actions
required for everyday use cases, and it provides clear & actionable error messages. It also has extensive
documentation and developer guides. Keras is specially designed for assisting the build and deployment
of neural networks, and since our approach is an MLP algorithm. So, Keras was the best library to use.
[24]
15

4 Implementation
4.1 Database

Since the collected data was in csv and xlsx sheets, creating a database with an appropriate data structure
was essential. Creating the database at the beginning of the project helped facilitate the important fields
and made them more easily accessible in the other stages of the thesis. The data structure was chosen
to implement two properties: 1- Separating tenants from each other. 2- Days of each tenant are separated
from each other. This implementation allowed for straightforward storage and/or retrieval of data. This
stage can be viewed as an extract, transform, and load (ETL) pipeline, and it was mainly done in Node.js
and MongoDB. The overview of the ETL pipeline can be found in figure 4.1

4.1.1 Extract
The data was extracted from SE sensors in the form of multiple xlsx sheets. Each sheet contains ~1-2
months of a specific building parameter (humidity, temperature, and CO2 levels). As for the data
extracted from the OURA rings, it is in the form of csv sheets. Each sheet contains ~1-2 months of
physiological information of a tenant. The retrieved sheets were then saved on our private computers
and were ready for the transform phase.

4.1.2 Transform
This phase consisted of transforming the data to follow our desired data structure and manually
checking/analyzing the transformed data for any errors. The data structure is in the form of collections
that hold multiple documents. A collection was made in association with each tenant. Each collection
holds data related to the tenant in the form of JSON documents. Each of those documents holds one
day’s worth of information about the tenant. A document then has the following structure:
{
 Date: number(day:month:year) e.g. 01/05/2020
 Sleep Score: number e.g. 93
 TempStart: number e.g. 50
 Activity Score: double e.g. 13.75
 Readiness Score: number e.g. 100
 RelativeHumid: number e.g. 90
 RestfulScore: number e.g. 80
 LatencyScore: number e.g. 82
 TotalBurn: number e.g. 2940
 TotalSleep: number e.g. 112233
}

Mongoose schema was used to define the documents’ structure and their default values. MongoDB
will automatically generate an ObjectId for every document in a collection. Although ObjectIDs were
not necessarily useful for our research, we used them to keep track of critical or issues-generating
days/documents.
16 4.1.3 Load The transformed data was loaded in our MongoDB database, which is being hosted on our private computers. For security reasons, no one was allowed to view this database except for project members and supervisors. Figure 4.1: ETL data pipeline during the different stages of this project 4.2 TDQM As mentioned in the Methodology section in 3.3.3, we have chosen to apply the total data quality management method to our data. This section will explain how and what exactly we did in terms of the data we have and the scope of this project. For this project, we are dealing with two different sources of data. The first comes from the ring and the second comes from the SE sensors placed in KTH Live- in-lab buildings. As presented in section 3.3.3 this method starts by defining the metrics and dimensions that are important for the later stages (Measuring, analysing). These dimensions will be the same for both data sources. Evaluation for the data and assessment will be based on these dimensions; see table 4.2 Table 4.2.1: Definitions of metrics and dimensions Dimension Definition Believability The extent to which data is regarded as true and credible Accuracy Syntactic accuracy: it is measured as the distance between the value stored in the database and the correct one Objectivity The extent to which data is unbiased, unprejudiced, and impartial Reputation The extent to which data is highly regarded in terms of its source or content.
17

 Relevancy The extent to which data is applicable and helpful for the task at hand

 Timeliness The extent to which the data is sufficiently up-to-date for the task at hand.

 Completeness The extent to which data is not missing and is of sufficient breadth and depth
 for the task at hand

 Appropriate The extent to which the volume of data is appropriate for the task at hand
 amount of data

 Interpretability The extent to which data is in appropriate language, symbols, and units, and
 the definitions are clear

 Understandability The extent to which data is easily comprehended.

 Consistency The extent of which data is presented in the same format.
 representation

 Concise The extent to which data is compactly represented.
 Representation

 Accessibility The extent to which the data is available, or easily and quickly retrievable.

 Access Security The extent to which access to data is restricted appropriately to maintain its
 security.

The Dimensions above have been mentioned and categorized in [Wang and Strong 1996 :
20]

 Table 4.2.2: Data quality dimensions [Wang & Strong, 1996:20

Data quality category Data quality dimensions

Intrinsic data quality Believability, Accuracy, Objectivity, Reputation

Contextual data quality Value-added, Relevancy, Timeliness,
 Completeness, Appropriate amount of data.

Representational data quality Interpretability, Ease of understanding,
 Representation consistency, Concise
 representation.

Accessibility data quality Accessibility, Access security.

As for the measuring stage, the process was different for the two data sources, so each will be discussed
separately.
 ● From the OURA: To collect data (Measuring), we distributed sample rings to students living
 in KTH LIL apartments. The students wore their rings for the agreed-on period. The
 measurement was done entirely by using the ring’s sensors, and they were not manually
 manipulated.
18

 ● From SE sensors: This data is automatically measured by the different sensors placed inside
 the KTH Live-in-lab buildings. Since we are not the main responsible for the measurement of
 this data, we do not have enough information about what kinds of sensors are used for
 measuring. However, we use the references provided by SE on their website for assessing the
 accuracy of these sensors.

The next step was to analyze the data. Each data sample was analyzed separately by examining and
studying examples. The analysis and examination were done by applying the different definitions to the
different dimensions we have. The dimensions then were categorized into the following assessments:
 ● Approved: This indicates that the data passed the dimension according to the established
 definition.
 ● Rejected: This indicates that the data did not pass the test, and it must be modified if the
 parameter is to be used in the modeling stage.
 ● NA: this means that not enough information was found for assessing the dimensions, but it is
 OK to proceed with using this data without any further improvements.

No improvements were done on any of the parameters in the data since that lied beyond the scope of
this thesis.

4.3 Modelling
In this chapter, we are explaining the model we used and how we developed and applied it. The third
sub-goal of this project, described in section 1.3, was to create a model and a good algorithm for
improving tenant’s sleep quality by adjusting the built environment. However, we were constrained by
the amount of data provided to us, and training a model requires a lot of data. For that reason, we decided
that we will not personalize the model, which means our model will be trained on a combination of all
the data from all tenants. So for the training stage, we merged the data into one set, which gave us a big
enough dataset to train the model on. Moreover, after conducting a heavy literature review on this
matter, we found that the best and most suitable model choice would be the deep learning model
“Multilayer perceptron”. For more details and the motivation of our choice, see section 3.3.4.

After we decided on the algorithm, it was time to prepare the data that is being used. The loaded data is
in the form of an array of JSON elements. Each element has the same structure as described in section
4.1. For preparation, we had to split the data into two types of NumPy arrays: input and output variables.
Both types would then be fed into the model. The variables are summarized as follows:

Input variables:

 1. Temperature of the room
 2. Relative humidity of the room
 3. Total time spent sleeping
 4. Activity score
 5. Readiness score
 6. Restfulness score
19

 7. Sleep Latency score
 8. Total Burn

Output variable

 1. Sleep score

So, from the model’s point of view, there are eight input variables and one output variable. The model
will be learning how to map the input variables to the output variable, which can be summarized as
y=f(x).

 Figure 4.3.1: The ANN structure of our model.

Modelling was done in three stages; defining, compiling, and fitting (training) the model. [25]

The first step was to decide the shape and identity of our model; by this, we mean the number of layers,
the number of neurons inside each layer, and activation functions. Based on the literature review we
conducted, there was no specific approach for deciding how deep the model should be, i.e., the number
of hidden layers. The ideal approach adopted by the majority of developers is the trial-error procedure
[26]. After we conducted many trials with different numbers of activation layers, we found that choosing
two hidden layers is ideal for our problem, and it gave us the best results. As for the neurons, their
quantity differs from layer to layer. First, the input layer takes in rows of input data with nine variables.
Then, the first and second hidden layers have eight neurons (nodes) each. Finally, the output layer has
only one neuron; the predicted sleep score. Furthermore, the activation function for the input and hidden
layers was the Rectified Linear Activation Function (ReLU).
20

 ReLU is a simple function that returns the input directly if it is positive and returns 0.0
otherwise. This simplicity makes a model easier to train and achieve better performance. In addition,
ReLU is linear for positive inputs, and it is nonlinear for negative or 0.0 inputs (all nonpositive inputs
are mapped to 0.0). This property is desirable when training a neural network model using stochastic
gradient descent with backpropagation of errors, as it allows the model to learn more complex
relationships in the data. [27]

 a

 z

 Figure 4.3.2: Visual representation of the RELU activation function.

Next, the defined model was compiled. A few parameters need to be specified when compiling a model.
These parameters are the loss function, optimizer, and metrics. Firstly, the loss function chosen was the
mean absolute error. Mean Absolute Error is a type of regression loss function, which is appropriate in
this case because the model is ultimately trying to find the relationship between the input and output to
predict a real-valued quantity. [28] It is calculated as the average of the absolute difference between the
actual and predicted values. Secondly, the optimizer chosen was Adam's version of stochastic gradient
descent (SGD). When training the neurons’ weights iteratively, this version of SGD uses moving
averages of both the gradients and their second moments. Adam’s optimizer was chosen for our model
because it is computationally efficient, requires little memory, and it works well with very noisy and
sparse gradients [29]. Thirdly, in order to judge the accuracy performance of our model, we chose the
accuracy metric. The accuracy metric’s values are viewed when fitting the data and evaluating the
model, but they are not used during the training. [30]

Finally, fitting (or training) is the last step required before evaluating the model to predict the sleep
scores. Other than the validation set used for testing, sizes for epoch and batch needed to be set in this
step. Training the model happens over epochs, which are divided into batches. An epoch refers to one
passing through all the days in our dataset, while a batch refers to a number of samples that the model
21

works through before updating its internal parameters. As with the number of hidden layers, choosing
the appropriate number of epochs and batches is a trial-error procedure. For the epochs, we kept
increasing their size until we found the range in which the model got overfitted. Overfitting occurs when
the model by-hearts the dataset, which means the model memorized the data instead of learning it. That
range is noticeable by plotting the validation and training loss, and looking for when the validation loss
starts to slightly increase instead of decrease. For our case, that range was around >100. [31]
As for the batch size, we came to choose a low size. Generally a large batch size is recommended for
high learning rates, and small batch size is recommended for lower learning rates. Since we are using
the default keras learning rate of 0.01, we decided to use a low batch size of 30. [32]

 /Epoch

 Figure 4.3.3: Loss/Epoch testing results.
22

5 Results and Analysis
The results are separated into two sections, the data quality management results and the modelling
results.

5.1 Data Quality Assessment Results (TDQM)

As described in section 3.3.3 the method we chose for our data assessment is TDQM, the method aims
for validating many aspects of the data such as validity, quality, believability, security, etc.
When assessing each dimension, we had to follow different approaches on different dimensions.
Believability: When assessing the believability of the data, we had to take into consideration many
things, whether the data values are reasonable, have the values been manipulated before we got them
or not. In case of the data from the OURA ring, the data was extracted directly from the OURA database,
and since the study is about the OURA ring, so we had to approve the believability of the data coming
from OURA, also we are aware that the data was extracted using an API developed by two technicians
from KTH, we had the possibility to speak to one of them, and according to him, the data was not
manipulated or changed at all. The other source of data we had, is the data from the SE sensors, this
data is measured and stored inside KTH servers, The data was sent to us by one of the main supervisors
on this project, and thus it’s trustworthy and we approved the believability of the data from SE as well.

Accuracy: to assess this dimension, we had to do heavy research, our main sources for information were
the official websites provided by both companies OURA and SE. OURA in their website provides
plenty of information about the accuracy of their sensors and how accurate the values for each parameter
is. However, after assessing the accuracy of each parameter individually, we were able to identify which
parameter is accepted and which is not.
 ● Sleep Score: OURA states in their website that the sleep score is calculated based on many
 parameters including your resting heart rate (RHR), heart rate variability (HRV), body
 temperature, respiratory rate, and movement. These parameters are directly measured from the
 3 sensors that the company has installed on the ring. As this metric is OURA specific so we do
 not have actual data to compare its accuracy with, but in comparing the accuracy of the other
 parameters that the ring manufacturer uses for calculating this parameter, we found that RHR
 and HRV are 99.6% and 98% accurate. [33] (Approved)
 ● Temperature: This parameter is measured by a SE sensor that is installed inside the KTH lil
 buildings, and according to SE, all their sensors provide accurate measurements up to +0.2/-0.2
 degrees. So the temperature is considered accurate.
 [34]
 ● Activity: There is no defined measure for the activity to assess whether it’s accurate or not,
 however the approach that OURA uses is to take data from the 3D accelerometer which seems
 a common approach to measure activity. This sensor is considered a reliable tool for measuring
 different activity related parameters, and that is because it delivers accurate results [35]
 ● Readiness: This parameter measures how well your overall health is, and how prepared you
 are for the day following. OURA also calculates the readiness of a person based on data from
 the sensors like the RHR and HRV so as proven before, since those parameters are accurate
 enough we can also consider the readiness to be accurate enough for this project. [36]
23

 ● Humidity: This parameter follows the same approach as the temperature. And according to SE,
 the humidity sensors are accurate up to +2%/-2% in the ranges from 0-80 % relative humidity
 measurements. So the humidity is considered accurate. [34]
 ● Restfulness: It is a measure of how soundly you slept through the night. Wake-ups, excessive
 movement and getting up from bed during the night will all take away from your overall
 restfulness. However, in this simple definition of restfulness, we can not approve this
 parameter since any small hand move, in-bed rotation can decrease this score and thus give a
 misleading result. [37]
 ● Sleep Latency: This parameter is defined to be the amount of time it took a person to fall asleep
 after they went to bed, according to OURA the optimal time for a person to fall asleep is 10 -
 20 minutes, if a person falls asleep in less than 5 minutes, this can indicate that the person is
 over tired and if the person struggles to sleep within 20 minutes indicates that this person is
 having some anxiety. However, OURA does not provide any information about the accuracy
 of this parameter, so it is not assessed. NA
 ● Total Burn:this parameter refers to the total number of calories burned throughout the day,
 OURA does not provide enough information about the accuracy of this parameter, but they
 claim it to be accurate enough, or slightly bounced if the person did not wear the ring when
 exercising. In an experiment that was done to compare different wearables, OURA was the
 most consistent wearable device in the activity measuring. So this parameter is also approved.
 [38]
 ● Total Sleep Time: Oura analyzes your sleep by measuring the dynamics of your resting heart
 rate, body temperature, movement. Again we cannot determine the accuracy of sleep time since
 we have no access to the algorithm, and we think that there weren’t actual tests done to test the
 accuracy of the algorithm. [11]

Objectivity: Since all the collected data is from the sensors of the OURA Ring, we can safely assume
that it’s completely unbiased, impartial, and unprejudiced, since it is qualitative data.(Approved) [39]

Reputation: The source of the data is from the ring, which means our only source is considered “trust-
worthy”. Also, we are aware that the data was never modified, edited or manipulated, also the data is
used by OURA to monitor sleep patterns for users, so OURA can not manipulate the data or they will
risk losing their clients. All of this ensures that our data holds a good reputation and thus we approve
this dimension. [40]

Relevancy: The data set we received from OURA contains 55 entries for each day, and in our modelling
process, we are using 10 parameters, which are 8 from OURA and 2 from SE, this means that the dataset
we have is covering 100 % of our needs. Thus, this dimension is approved.

Timeliness: Time is not an important factor in our project, in fact we have data ranging from multiple
months (May 2020, December 2020, February 2021, MArch 2021). So we have a wide range of the
year covered by the dataset, we also have samples from winter/summer times which ensures that the
program is trained on different patterns. Also this project was done from January 2021 to May 2021 so
the data is considered up-to-date. Thus the timeliness dimension is approved.

Completeness: The data from OURA has some missing entries, those can be oued the user forgetting to
charge their ring, or due to contactless moments between the wearer’s finger and the ring. However, we
removed the days that contain the missing entries from our training sample so it doesn’t affect the
You can also read