Improvement of the Coal Inventory Management System Using the Economic Order Quantity Method
←
→
Page content transcription
If your browser does not render page correctly, please read the page content below
Improvement of the Coal Inventory
      Management System Using the Economic Order
                  Quantity Method
                    A Case Study of PT Petrokimia Gresik

                     Stefanus Ardian Satwika(B) and Nida Tsuroya

                          Universitas Airlangga, Surabaya, Indonesia
                             stefanusardian@yahoo.com

       Abstract. In a business, inventory is frequently known as a source of contention.
       PT Petrokimia Gresik (PKG) is PT Pupuk Indonesia’s (Persero) subsidiary, an
       agro-industry company that the government always requires to meet national fer-
       tilizer supply to ensure food security and perform more efficient and cost-effective
       cost savings, through more efficient and economical use of facilities and infras-
       tructure, including inventory management. At PKG, one of the most crucial inven-
       tory management issues is coal inventories, which have lately experienced a price
       increase of more than 200%. The trend of global coal prices has climbed to 2 times
       higher since 2021. The price of coal in Indonesia has risen from Rp. 500,000 per
       ton to Rp. 1,500,000 per ton, not to mention the world’s current state of war, the
       Russian invasion of Ukraine, which has increased fuel prices worldwide, includ-
       ing coal, which is in high demand by utility companies in Indonesia. While PT
       Petrokimia Gresik must continue to produce despite rising coal prices, inventory
       must be managed to achieve the lowest possible cost. Adopting the Economic
       Order Quantity (EOQ) method to improve the coal inventory management system
       needs to be considered. EOQ is an old theory, but we believe it is still relevant
       today. We will compare the company’s current coal inventory management to the
       EOQ method regarding efficiency, efficacy, and expenses associated with reorder-
       ing, storage, and other factors. The study concludes that PKG’s coal supply system
       is relatively good, although there is still potential for improvement. The inventory
       management policies that are in place still refer to the prior period’s experience.
       Several causes contribute to coal overstock and understock issues, including a coal
       supply planning system that is not yet optimal. The proposed future improvement
       is to employ the Economic Order Quantity (EOQ) approach, which can save Rp
       684,000,000 per year (average) in inventory expenditures. This demonstrates that
       the EOQ approach can save 6.7% per year in costs.

       Keywords: Inventory · Coal · Economic Order Quantity

1 Introduction
PT Petrokimia Gresik (PKG) is PT Pupuk Indonesia’s (Persero) subsidiary, an agro-
industry company that the government always requires to meet national fertilizer supply

© The Author(s) 2023
W. R. Murhadi et al. (Eds.): INSYMA 2022, AEBMR 223, pp. 1046–1055, 2023.
https://doi.org/10.2991/978-94-6463-008-4_130
Improvement of the Coal Inventory Management System      1047

                      Fig. 1. PKG Coal Requirements for 2019–2021

to ensure food security and perform more efficient and cost-effective cost savings through
more efficient and economical use of facilities and infrastructure, including inventory
management.
    PKG’s inventory system is made up of numerous components, including planning,
managing, and processing. These characteristics encompass various tasks, including pur-
chasing, storage or warehousing, production, and administrative accounting. To achieve
a balance of varied interests in a company, each function must be addressed with an
integrated approach. Ending inventory should constantly be handled to provide the best
results. Coal is one of the essential commodities used in PKG (Fig. 1).
    Coal is used as a fuel to generate steam or as a heat source in the manufacturing
process. PKG coal is used in two factories: the Utilitas Batubara (UBB) and the Phosphate
I Fertilizer Factory (PF I).
    Coal inventory management is critical, especially given the recent issue of a more
than 200% increase in coal prices. The trend of global coal prices has climbed to 2 times
higher since 2021. The price of coal in Indonesia has risen from Rp. 500,000 per ton
to Rp. 1,500,000 per ton, not to mention the world’s current state of war, namely the
Russian invasion of Ukraine, which has increased fuel prices worldwide, including one
type of fuel, coal, which is in high demand by utility companies in Indonesia. While
PKG must continue to produce amid rising coal costs with inventory must be managed
to achieve the lowest possible cost.
    Due to operational issues, coal demand declined from 217,560 tons in 2019 to
198,042 tons in 2020. Because of a significant increase in coal prices in Indonesia from
around Rp 800,000 to Rp 1,500,000 per ton (an increase of nearly 200%) in Semester 2
of 2021 and the scarcity of coal supply in the Kalimantan area, as well as policies from
the central government to secure coal supply to the PLN group, the realization of coal
use will decrease to 163,200 in 2021.
    Although the use of coal in PKG decreased by 9% in 2020 and 25% in 2021, we
could not use any quantitative forecasting approach (regression, moving average, etc.)
to estimate coal demand in 2022 or 2023 since that year’s characteristics were unique,
such as the construction of new factories and the revitalization of coal units, which
will increase the need for steam in the manufacturing process, and ensuring that coal
consumption would rise. The demand for coal is expected to increase by 65% between
1048 S. A. Satwika and N. Tsuroya
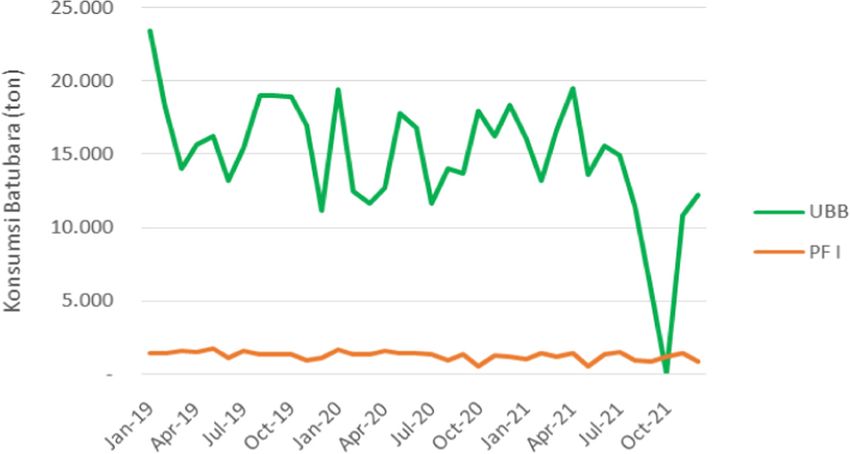
Fig. 2. PKG Coal Understock and Overstock Conditions 2019–2021
2022 and 2023. As a result, a new approach and system for controlling coal inventories
at PKG are required to deal with the expected growth in the coming years.
Overstock is one of the most common operational issues. Overstock conditions are
influenced by several factors, including the existence or absence of downtime in the
steam user facility, the working load of the coal boiler, and the quality of the coal itself,
which cannot be used if it is wet or damp. To avoid this problem, regular and frequent
inventory orders are placed; nonetheless, frequent inventory orders result in cost waste.
Another issue that frequently occurs at PKG is understock inventory which happens
when the amount of coal available is insufficient to meet demand. These conditions can
impair plant operations, and it is not out of the question that the plant will be shut down
due to a lack of steam or a lack of thermal energy sources due to the lack of coal stock.
Figure 2 depicts the occurrence of coal understock and overstock at PKG over three
years (2019–2021). It can be observed from Fig. 2 that coal understock is relatively
common over the 2019–2021 period. In 2019, there was one occurrence of understocking,
and in 2020, there was none. However, by 2021, the occurrence of understock was
doubled. Understock conditions have become more common in recent years. Yet, they
can still reduce the Coal Utility unit’s service level to its service customers, such as
production units and other stakeholders.
Overstock events frequently occurred, as many as 12 times, 3 times, and 0 occasions
in 2019, 2020, and 2021, respectively. Even though the trend has been downward for
the last three years, it is vital to plan ahead and manage carefully to keep the coal
stock at a safe level. Developed and developing countries have implemented inventory
management utilizing the Economic Order Quantity (EOQ) method in both the public
and private sectors. According to Vikaliana [1], EOQ is an inventory control method in
which goods are ordered in fixed quantities to reduce inventory costs. EOQ can lower
inventory expenses by lowering purchasing, storage, and procurement costs.
EOQ is an old idea, but we believe it is still relevant today. The traditional EOQ model
aims to maximize overall profits (or minimize the total cost) by saving production and
operational costs without significantly increasing production input, especially for cost
and profit optimization in logistics and inventory phases [2, 3]. The model assumes that
(annual) demand is constant [4, 5].Improvement of the Coal Inventory Management System 1049
Among the different ways available, the researchers chose the EOQ method because
it is straightforward and can solve various inventory issues that frequently arise in man-
ufacturing organizations, such as PKG, as described above. EOQ is used in businesses to
determine the most efficient and effective ordering quantity. Then, based on the inventory
utilization pattern, determine the reorder point when the work unit must place another
inventory order. This technique can also be adjusted with many company-specific rules,
such as good and service procurement provisions. The supply contract is fulfilled multiple
times, and the delivery clause is fulfilled multiple times. Based on the above descrip-
tion, the authors aim to know how the EOQ inventory system’s design may minimize
inventory costs when applied to PKG, and then study and compare the outcomes.
2 Research Methods
The study was carried out with a qualitative approach. The case study methodology
utilized in this work has various advantages, including examining one to several issue
objects for further analysis that can be simple or complicated (cross-case analysis). This
study employed observation, interviews, and documentation as a data-gathering tool.
The following were the data collection procedures used in this study: (1) Observation,
(2) Depth Interview, and (3) Documentation.
The data for this study came from both primary and secondary sources. Primary
data was gathered through direct observation and interviews with PT Petrokimia Gre-
sik employees (SVP Technology, VP Production Planning & Energy Management, VP
Supervision and Planning of Goods and Services, AVP Factory Production 3, AVP Coal
Utilities, Staff Dep. Supervision and Planning Goods and Services, Staff of the Depart-
ment of Procurement of Goods, and Staff of the Department of Accounting). Secondary
data was gathered by examining supporting documents and other sources (literature),
such as reports on coal inventory positions and vendor coal price data. Figure 3 shows
conceptual framework of this study.
The following are some of the calculation analysis variables that allow the usage of
the EOQ method:
1. Economic Order Quantity (EOQ)
The EOQ is the value of the amount of material required for each purchase at the
most cost-effective price. EOQ is calculated using the formula:
2×D×S
EOQ = (1)
H
Note:
D : Coal requirement per year
S : Ordering cost per order
H : Holding cost per unit1050 S. A. Satwika and N. Tsuroya
Fig. 3. Conceptual Framework
2. Total Inventory Cost (TIC)
Total inventory cost is a calculation of total raw material inventory used to see if
the EOQ method of calculating inventory purchases is better than the company’s
traditional method. The formula for calculating TIC is as follows:
√
TIC = 2 × D × S × H (2)
Note:
D : Demand needed
S : Ordering cost
H : Holding cost per unit
3. Safety Stock (SS)
Safety stock is a good way to protect the company from any inventory-related dan-
gers. The size of the divergence from the average over the previous several months is
used to calculate the safety stock. The standard deviation is determined as follows:
(X − x)2
Standard Deviation = (3)
n
Note:
n : number of dataImprovement of the Coal Inventory Management System 1051
X : coal requirement
x : average coal requirement
4. Maximum Inventory (MI)
The organization requires maximum inventory to ensure that the amount of inventory
in the warehouse is not excessive and that no working capital is wasted. Maximum
Inventory is calculated using the following formula:
MI = SS + EOQ (4)
5. Reorder Point (ROP)
The Reorder Point (ROP) is used to keep track of inventory items so that when things
are returned, they arrive on time. ROP is calculated using the following formula:
ROP = SS + (LT × Q) (5)
Note:
LT : Lead Time
Q : average coal consumption per day
3 Results and Discussion
PKG manages its coal stock by attempting to keep it in a secure position. Typically,
inventory is kept at a level that allows it to satisfy operating needs for at least one month;
however, a reorder point is established if the stock is just one month away. Until now, the
coal inventory monitoring system has been carried out manually. The inventory report
at the end of each month, which describes the position of the coal stock at the beginning
and end of the month, is used to keep track of inventory. A reorder of coal will be placed
with the procurement partner, namely the PPBJ Department and the Goods Procurement
Department, if the stock is deemed sufficient for operating activities next month.
Due to many causes, this mechanism can sometimes create delays in the shipment of
coal, resulting in a shortage due to many factors: (1) Lead time, or the time it takes for coal
to arrive at the company, varies; it might be inaccurate to forecast how long it will take
if it is not adequately monitored. (2) The lengthy procurement procedure, particularly
the issuance of PRs (Purchase Requests). (3) With this manual system, human error
can arise due to negligence of the individuals or staff who manage it, resulting in error
warnings or recording errors. EOQ calculations were performed in this study utilizing
data from the previous three years, starting in 2019, 2020, and 2021. Table 1 shows data
on coal demand over the last three years.
Table 1 exhibits that the coal in PKG is used at UBB and PF I Plant with a total
demand of 163,200–217,560 tons per year and an order frequency of 21–34 times. Table
2 shows the breakdown of the costs associated with placing an order.
Shipping costs, administrative costs, and supervision fees for arriving goods are all
included in the ordering fee. These types of costs are considered when determining how
much money can be saved utilizing the EOQ method. Table 3 shows the storage expenses
in detail.1052 S. A. Satwika and N. Tsuroya
Table 1. Coal Ordering Frequency 2019–2021
Year Plant Coal Required Ordering
(ton) Frequency
2019 UBB 201.012
PF I 16.547
Total 217.560 34
2020 UBB 182.600
PF I 15.442
Total 198.042 21
2021 UBB 149.484
PF I 13.716
Total 163.200 22
Table 2. Ordering Cost 2019–2021
Year Ordering Cost (Rp Million)
S
2019 259
2020 374
2021 288
Table 3. Holding Cost 2019–2021
Year Holding Cost Per Unit (Rp Million/ton)
H
2019 30.217
2020 41.868
2021 31.995
Utility costs (electricity and water), personnel and handling costs, and warehouse
cleaning fees are all included in storage prices. The computation of corporate policies
is shown in Table 4. Table 4 illustrates PKG’s coal purchases from 2019 to 2021, with
an average order frequency of 26 orders per year.
Table 5 displays the results of utilizing the EOQ method to calculate data. According
to Table 5, the frequency of orders placed by PKG has decreased from 26 to 3–4 times
a year. The EOQ method of calculating the total inventory cost tries to identify the
efficiency value that can be generated when the company’s inventory size is optimized.Improvement of the Coal Inventory Management System 1053
Table 4. Calculation of Existing Condition 2019–2021
Year Plant Coal Frequency Average
Required Order (ton)
(ton/year)
D f Q = D/f
2019 UBB 201.012
PF I 16.547
Total 217.560 34 6.399
2020 UBB 182.600
PF I 15.442
Total 198.042 21 9.431
2021 UBB 149.484
PF I 13.716
Total 163.200 22 7.418
Table 5. Calculation Based on EOQ Model 2019–2021
Year Plant EOQ 2×D×S Frequency
H
D
f = EOQ
2019 UBB 56.654
PF I 4.664
Total 61.318 4
2020 UBB 57.945
PF I 4.900
Total 62.845 3
2021 UBB 52.568
PF I 4.824
Total 57.392 3
Table 6 shows the complete computation results. According to Table 6, coal inventory
control at PKG is deemed possible to perform using the EOQ approach. Companies can
reduce the amount of money they spend on coal inventory. The EOQ method can be
used to calculate overall inventory costs and give cost efficiency.
PKG has budgeted for a reasonable amount of safety stock for coal. The company’s
safety stock is currently 20.000 tons. The acceptable tolerance level is set at 5%, while
the service ratio is set at 95%, resulting in a safety factor of 1.65. The safety stock
calculation based on EOQ is 6.983 tons. PKG has calculated the maximum inventory1054 S. A. Satwika and N. Tsuroya
Table 6. Saving of Total Inventory Cost 2019–2021
Year Existing (Rp EOQ (Rp Saving (Rp
Million) Million) Million)
2019 10.761 9.911 850
2020 11.413 10.682 730
2021 8.147 7.675 472
Table 7. Maximum Inventory Calculation 2019–2021
Year Safety Stock EOQ Maximum Inventory
2019 5.209 61.318 66.527
2020 4.476 62.845 67.321
2021 9.363 57.392 66.755
Table 8. Reorder Point Calculation 2019–2021
Year D Q/day Lead Time SS ROP
2019 217.560 659 30 5.209 24.979
2020 198.042 600 30 4.476 22.476
2021 163.200 494 30 9.363 24.183
for coal based on the average amount of coal ordered plus safety stock thus far. The goal
of estimating the maximum inventory is to ensure that the organization avoids shortages
or surplus inventories, as both can cause significant disruptions in the production and
distribution processes, as well as financial losses. Table 7 shows the maximum inventory
using EOQ.
The Reorder Point (ROP) is used to keep track of inventory items so that when it is
time to reorder, the goods will arrive on time. PKG sets reorder points based on time and
the projected demand, ensuring that reorders are placed when the warehouse inventory
begins to feel low. The EOQ method is used to calculate reorder points, as shown in
Table 8.
4 Conclusion
Several things can be deduced based on the research’s primary objective as well as the
results of the analysis and debate conducted in the preceding chapter, including:
1. Currently, PKG’s coal inventory management is as follows: (a) The inventory system
is adequate yet insufficient. (b) The management system policies in place are stillImprovement of the Coal Inventory Management System 1055
based on the practices agreed upon by management based on the previous years’
experience.
2. The Economic Order Quantity (EOQ) technique can save Rp 850 million in 2019;
Rp 730 million in 2020; and Rp 472 million in 2021 in inventory expenditures.
Acknowledgments. The author would like to thank all colleagues who have supported this
research, especially the PPIC team, who always accompanies the operations area’s improvement
process.
Authors’ Contributions. Each author contributed significantly to the research design and
implementation, as well as the analysis of the findings and manuscript writing.
References
1. Vikaliana, R., Sofian, Y., Solihati, N., Adji, D. B., & Maulia, S. S. (2020). Manajemen
Persediaan. Media Sains Indonesia.
2. Taleizadeh, A. A., Khanbaglo, M. P. S., & Cárdenas-Barrón, L. E. (2016). An EOQ inventory
model with partial backordering and reparation of imperfect products. International Journal
of Production Economics, 182, 418–434.
3. Huang, B., & Wu, A. (2016). EOQ model with batch demand and planned backorders. Applied
Mathematical Modelling, 40(9–10), 5482–5496.
4. Tang, O., & Grubbström, R. W. (2005). Considering stochastic lead times in a manufactur-
ing/remanufacturing system with deterministic demands and returns. International Journal of
Production Economics, 93, 285–300.
5. San-José, L., Sicilia, J., & García-Laguna, J. (2015). Analysis of an EOQ inventory model with
partial backordering and non-linear unit holding cost. Omega, 54, 147–157.
Open Access This chapter is licensed under the terms of the Creative Commons Attribution-
NonCommercial 4.0 International License (http://creativecommons.org/licenses/by-nc/4.0/),
which permits any noncommercial use, sharing, adaptation, distribution and reproduction in any
medium or format, as long as you give appropriate credit to the original author(s) and the source,
provide a link to the Creative Commons license and indicate if changes were made.
The images or other third party material in this chapter are included in the chapter’s Creative
Commons license, unless indicated otherwise in a credit line to the material. If material is not
included in the chapter’s Creative Commons license and your intended use is not permitted by
statutory regulation or exceeds the permitted use, you will need to obtain permission directly from
the copyright holder.You can also read