Implementing a State Earned Income Tax Credit (EITC) in Pennsylvania: A Benefit-Cost Analysis Report for the United Way of Pennsylvania
←
→
Page content transcription
If your browser does not render page correctly, please read the page content below
THE UNIVERSITY OF TEXAS AT AUSTIN
                                                              LYNDON B. JOHNSON SCHOOL OF PUBLIC AFFAIRS

                                                                                     December 2021

Implementing a State Earned Income Tax Credit
(EITC) in Pennsylvania: A Benefit-Cost Analysis
Report for the United Way of Pennsylvania
Executive Summary
The federal earned income tax credit, or EITC, is one of the most successful anti-poverty
programs in the US, lifting 6 million people (including 3 million children) over the poverty
threshold each year, reducing the depth of poverty for many others, and boosting the resources
of near-poor households who struggle to make ends meet. The majority of states offer a state-
level EITC to working households to supplement the federal credit, typically providing a set
percentage of a household’s federal benefit. Rigorous research shows that federal and state
EITCs increase overall employment and earnings, particularly for single mothers, leading to
better economic, social, and health outcomes for families. EITCs benefit state and local
governments as well, because increased earnings yield greater tax revenue and reduced
spending on public assistance.
Pennsylvania has had its own tax forgiveness program for decades, providing relief to millions of
families each year, but the state remains without an EITC. Therefore, some families who struggle
financially do not receive tax relief because their income level does not qualify for the current
program. A coalition led by the United Way of Pennsylvania is advocating for a refundable state
EITC of at least 10% and up to 25% of the federal credit, which can be phased in over time. The
current state tax relief program would remain in place under this proposal and families would elect
to claim the benefit that offers the greatest tax relief for their household.
This report offers an estimate for the new costs of the proposed refundable state EITC, beyond
Pennsylvania’s current expenditures for its existing tax forgiveness program, as well as estimates
for the benefits to the state and to families. We estimate that with a 10% state EITC, the average
annual benefit per household would be $197, and Black and Hispanic families would receive a
greater benefit than the state average. Approximately 10% of all households in Pennsylvania are
likely to claim the state EITC and 14% would claim the current tax forgiveness benefit. Therefore,
1 in 4 Pennsylvania households would receive some form of tax relief. Our analysis demonstrates
that the annual public benefits of the elective state EITC program would outweigh its costs, with
an estimated ratio of approximately 7 to 1 with a 10% credit. The program would improve the
quality of life for Pennsylvania’s workers and families, while offering significant returns to the
state government through increased economic activity, greater tax revenue, and reduced
spending on public assistance and human services programs.

                                childandfamilyresearch.utexas.edu | 1
Pennsylvania State EITC: A Benefit-Cost Analysis
December 2021
Table of Contents
I. Background and Purpose of Report ............................................................................................... 3
II. Costs of Implementing a State EITC Program in Pennsylvania ..................................................... 7
III. Benefits of the Proposed State EITC Program ........................................................................... 13
IV. Benefits for Marginalized Communities: Race and Ethnicity Groups ....................................... 29
V. Local Impact: Pennsylvania Regional Benefits............................................................................ 31
VI. Conclusion.................................................................................................................................. 32
VII. Appendix ................................................................................................................................... 33
Tables and Figures
Table 1: Household (Tax-Filing Unit) Types in Pennsylvania ACS Sample and EITC Eligibility .......... 9
Table 2: Direct Costs of the Elective State EITC Program (10% Refundable State EITC) ................ 11
Table 3: Household Characteristics (10% Refundable State EITC) ................................................. 12
Table 4: Direct Costs of the Elective State EITC Program (25% Refundable State EITC) ................ 12
Table 5: Increase in Maximum EITC Exposure with a 10% and 25% Refundable State EITC .......... 15
Table 6: Fiscal Benefits Per Year with a 10% and 25% Refundable State EITC ............................... 17
Table 7: State Medicaid Cost Avoidance Per Year From Reduced Low Birthweight Incidence ..... 21
Table 8: Special Education Cost Avoidance From Reduced Low Birthweight Incidence ................ 22
Table 9: Benefits from Reductions in Infant Mortality ................................................................... 23
Table 10: Cost Avoidance from Reductions in Foster Care Entry ................................................... 23
Table 11: Benefits from Greater High School Graduation Rates .................................................... 25
Table 12: Benefits from Gains in Children’s Health Coverage ........................................................ 25
Table 13: Criminal Justice Cost Avoidance Per Year with a Refundable EITC................................. 26
Table 14: Benefits from Suicide Prevention ................................................................................... 27
Table 15: Human Services Cost Avoidance, Low-End Estimate ...................................................... 28
Table 16: Human Services Cost Avoidance, High-End Estimate with Private Benefits .................. 28
Table 17: Summary of Benefits ....................................................................................................... 28
Table 18: EITC and SP Take-Up by Race and Ethnicity (10% Refundable State EITC) ..................... 30
Table 19: EITC and SP Take-Up by Race and Ethnicity (25% Refundable State EITC) ..................... 30
Table 20: Average State EITC Benefit Amounts Claimed by Race and Ethnicity ............................ 30
Table 21: Pennsylvania Regions and Corresponding Counties ....................................................... 31
Table 22: Regional EITC Take-Up and Benefits (10% and 25% Credits).......................................... 32
Appendix
Table A.1: State EITCs in the US ...................................................................................................... 33
Table A.2: EITC and Pennsylvania Current Tax Relief (SP Program) Eligibility Compared .............. 35
Figure A.1: Federal EITC Benefit Structure and Thresholds............................................................ 36
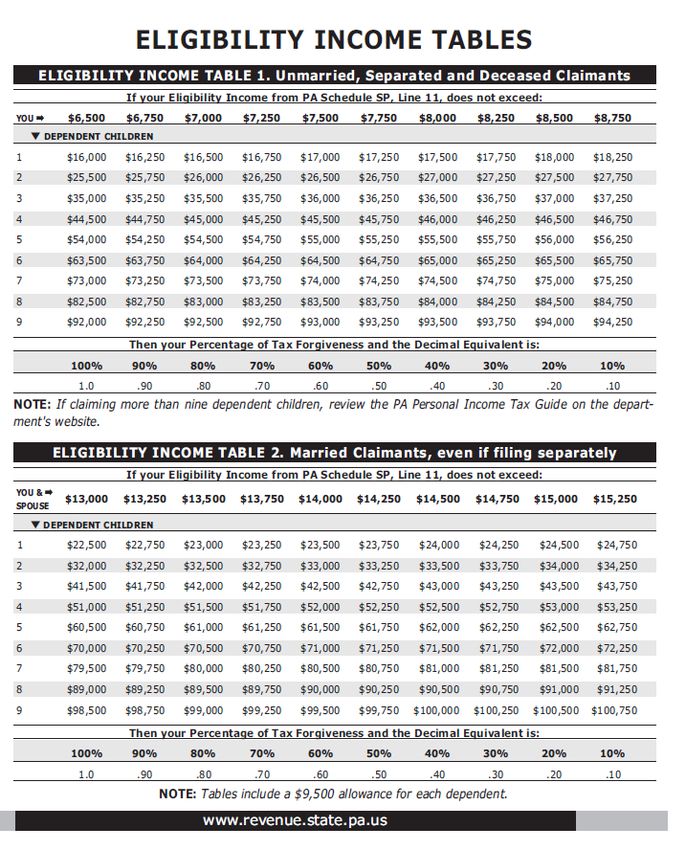
Figure A.2: Pennsylvania Current Tax Forgiveness Program (SP) – Eligibility Chart ....................... 37
Figure A.3: Eligibility, Take-Up, and Benefits (10% Refundable State EITC) ................................... 38
childandfamilyresearch.utexas.edu | 2Pennsylvania State EITC: A Benefit-Cost Analysis
December 2021
I. Background and Purpose of Report
One of the most cost-effective antipoverty policies currently implemented in the United States is
the earned income tax credit, or EITC, and the credit has been administered in various ways at the
federal, state, and local levels.1 First introduced in 1975, the federal EITC offers an annual lump-
sum tax credit to families with low income to reduce or eliminate tax liability, depending on the
total sum of taxes owed. The federal credit, and most state credits, can also be disbursed in the
form of a refund to families with no income tax liability, with the goal of offsetting the burden of
other taxes that families are subject to, such as payroll, sales, excise, and property taxes. The Tax
Policy Center has called the EITC the “single most effective means tested federal antipoverty
program for working-age households” in the US, and this claim is supported by rigorous research.2
Because EITCs are only available to workers with at least some earned income, and because the
benefits increase with each additional dollar earned until the maximum credit is reached, the
credit is designed to incentivize and reward employment for families with low income (see the
benefit schedule in Figure A.1 in the Appendix). The EITC leads to new entrants into the
workforce and greater work hours among those already employed because it increases the
financial returns from each additional hour of work.3
The EITC’s design targets support toward families with children, because the credit amount
increases with each dependent (through three children, above which the credit no longer
increases with additional children) and the credit’s value is much smaller for working adults
without dependents in the home. Approximately 97% of EITC benefits went to families with
children in recent years.4 The federal EITC lifts up to 6 million people out of poverty each year,
including 3 million children,5 and provides approximately $62 billion per year in refundable tax
credits (with an average amount of $2,461 per family in the US, based on Internal Revenue
Service [IRS] data from Tax Year 2019).6
As of October 1, 2021, a total of 28 statesi and the District of Columbia have implemented
their own state EITCs to supplement the federal credit and provide additional relief to
working families (see Table A.1 in the Appendix for details by state). State EITCs vary in their
generosity levels, eligibility requirements, and refundability, but most offer a refundable
credit of between 10% and 40% of the federal credit, with the value of the credit depending
on family size, marital status, and income.
Research has also shown that the presence of a state EITC can encourage greater take-up of the
federal EITC among those who are eligible.7 Take-up rates among those eligible for the federal
EITC range from 70% in Alaska to 82.7% in South Dakota in the most recently published IRS data
for this metric (Tax Year 2018); Pennsylvania has the twelfth highest take-up rate, at 80.3%.8 In
addition, research shows that states with their own EITCs gain more from the federal EITC
through increased earnings from greater employment and increased tax revenue to the state.9
i
Washington and Missouri have adopted state EITCs in legislation, but they will not be implemented until 2023 (for
Tax Year 2022).
childandfamilyresearch.utexas.edu | 3Pennsylvania State EITC: A Benefit-Cost Analysis
December 2021
Tax Relief in Pennsylvania: Current Policy and the Rationale for an Elective State
EITC Program
The Current Tax Relief Program Benefits Many Pennsylvanians
As of October 1, 2021, Pennsylvania is one of 22 states that do not currently offer a state EITC to
boost the impact of the federal credit and provide additional tax relief to families.10 However,
since 1974, the state has offered its own tax forgiveness program (hereafter referred to as the
“SP,” for Special Provision) which eliminates a percentage of state personal income tax liability
(from 10% to 100%) based on a family’s income level, marital status, and number of dependents
(see Figure A.2 and Table A.2 in the Appendix).11 According to the Pennsylvania Department of
Revenue, the SP program has provided tax relief totaling “more than $240 million to more than
1 million Pennsylvanians” in recent years.12
For certain workers and families, the SP program may offer greater tax relief than a state EITC;
for example, the SP offers increased benefits to families with each additional dependent,
through nine children, whereas the EITC amount remains the same after three children. In
addition, the SP does not have age restrictions for those without dependents, whereas the
federal EITC, and most state EITCs, offer benefits to workers without children if they are ages 25
to 64 only.ii
A Refundable State EITC Would Provide Greater Tax Relief to A Broader Group of Workers Who
Struggle to Meet Their Households’ Needs
The introduction of a state EITC in Pennsylvania would offer significant advantages to some
workers and families when compared to the current tax forgiveness policy. As a complementary
program to the SP, a state EITC would ensure that more families in the state can access needed
tax relief. For example, the SP program is not refundable, so families with the lowest tax liability
levels do not receive benefits exceeding their liability, as they would with a refundable EITC. In
addition, state EITCs modeled after the federal credit offer benefits to families with higher
income levels than the SP program.
Therefore, tax relief offered by the EITC reaches families with a greater range of needs—not only
the poorest, but also those who may struggle to afford the cost of living despite earning above the
poverty level. For example, the SP relief phases out (offering no benefits) to a single parent with
two children after the family reaches $27,750 in taxable income, but the federal EITC (and a
potential state EITC in Pennsylvania) would continue to offer benefits until the family reached
approximately $48,000 in taxable income (see Figures A.1 and A.2 in the Appendix).
The extension of eligibility higher up the income scale matters because many working families in
Pennsylvania struggle to make ends meet even when their incomes do not fall below the federal
poverty level (FPL) as it is currently defined. According to the United Way of Pennsylvania,
ii
The American Rescue Plan Act of 2021 temporarily reduced the age minimum for the federal EITC to age 19 for
one year.
childandfamilyresearch.utexas.edu | 4Pennsylvania State EITC: A Benefit-Cost Analysis
December 2021
approximately 27% of households in the state earn an annual income that is above the FPL, yet
still below a basic survival budget for their household size and cost of living.13
These families are described as Asset Limited, Income Constrained, Employed, or “ALICE”
families. For example, the FPL for a family of four is $26,500 in 2021, but the United Way
estimated that it costs almost $70,000 for a family of four in Pennsylvania to afford their basic
needs over the course of a year, including housing, food, child care for two children, health care,
transportation, and taxes.14,15 Combining the 27% of Pennsylvania households that are
considered “ALICE” with the 12% of households who live below the FPL results in a total of 39%
of households in Pennsylvania who struggle to meet their daily needs.16 Pennsylvania’s minimum
wage also remains at the federal level of $7.25, whereas 30 states and DC offer a higher state
minimum wage (22 of which set a wage floor of at least $10.00 per hour).17
A State EITC Would Help Remedy Inequitable Tax Burdens in Pennsylvania
Pennsylvania’s flat state income tax, which stands at 3.07% of eligible income for all families
regardless of income level, contributes to financial hardship in the state.18 Among states that
have a personal income tax (41 states and DC), only Pennsylvania and Illinois apply a flat tax rate
starting with the first dollar of earned income.19 The Institute on Taxation and Economic Policy
ranks Pennsylvania’s tax system as the 7th most inequitable among all 50 states and DC in terms
of how the burden of taxation disproportionately falls on families with lower income levels.20
A state EITC represents an important step toward remedying this inequity, and furthermore,
federal and state EITCs have been shown to produce positive economic and social ripple
effects for families, society, and state and local governments.21 Rigorous research has shown
that EITCs lead to greater labor force participation and earnings, particularly among single
mothers, which translates into lower family and child poverty rates, reduced reliance on public
assistance, greater tax revenue, and a host of social and health benefits that often accompany
greater resources.22 These spillover effects include lower incidence of low birthweight,
reduced need for special education, lower rates of infant mortality, higher educational
attainment, lower rates of foster care entry, lower violent crime, lower childhood poverty
rates, and more. These benefits and their associated cost avoidance estimates for
Pennsylvania are explored in greater depth in Section III of this report. The benefits of a state
EITC for marginalized communities, and specifically Black and Hispanic families, are discussed
in Section IV.
The Proposed Elective State EITC Program
Given that Pennsylvania has an existing tax relief program, there are at least three ways a state
EITC could be implemented. First, a state EITC could be adopted as a replacement for the SP,
eliminating the existing program. Eliminating the SP program would disadvantage tax filers who
were eligible for the SP but may not be eligible for the EITC, because eligibility requirements differ
(see Table A.2 in the Appendix). Second, a state EITC could be implemented in addition to the SP,
and families could claim either credit or both credits simultaneously, depending on eligibility
(sometimes called a “stacked” EITC). This overlapping option would offer the greatest total tax
relief to families, but would be the most costly for the state and may be politically infeasible.
childandfamilyresearch.utexas.edu | 5Pennsylvania State EITC: A Benefit-Cost Analysis
December 2021
A third proposal, and the one that is the focus of this analysis, is an elective state EITC program, in
which tax filers are able to select either the SP benefit or the state EITC (but not both) depending
on which they are eligible for and which provides them with the greatest benefit. The elective
program would allow individuals to continue to receive the SP tax relief if they do not qualify for
the EITC. Families who were previously ineligible for any state tax relief because their incomes
exceeded the SP eligibility threshold may be able to claim the state EITC under this option.
Families with very low tax liability may be able to claim a refund through the state EITC for the
portion of the credit that exceeds their tax liability.
Because of the complexities of each program’s benefit schedule, the optimal choice varies based
on family size, marital status, and income levels. Therefore, combining the two programs to offer
an elective state EITC program may reach more families while also increasing the total value of
benefits available to them.
Dating back to the 2005-2006 Pennsylvania legislative session, bills have been filed to establish an
elective state EITC because of the balance of advantages it would provide to families and the
state.23 The bills have never been passed, but momentum for a state EITC continues to build,
especially as many Pennsylvania families face increased financial hardship because of the
economic effects of the COVID-19 pandemic.24
The United Way of Pennsylvania is currently leading a broad-based and growing EITC coalition to
advocate for an elective, refundable state EITC program that may offer benefits of at least 10%
and up to 25% of the federal credit. The remainder of this report focuses on estimates for the
state costs and revenue benefits of a 10% and 25% refundable state EITC, as well as the social,
health, and economic benefits likely to accrue to Pennsylvania families and the state at large
given prior research on state EITC programs.
Our estimates show that implementing an elective, refundable state EITC program set at
10% of the federal credit will cost the state of Pennsylvania approximately $80.5 million
for the first year, including direct and administrative costs beyond what the state already
spends on tax relief. The annual benefits amount to at least $562 million. For a 25% credit,
the expected costs are $366 million and the likely benefits amount to at least $1.2 billion.
childandfamilyresearch.utexas.edu | 6Pennsylvania State EITC: A Benefit-Cost Analysis
December 2021
II. Costs of Implementing a State EITC Program in Pennsylvania
Estimates Provided in Previous Research
Various organizations have conducted cost analyses of alternative versions of a Pennsylvania
state EITC. Some of the analyses assume the EITC would replace the SP program, others assume
the program would provide additional benefits on top of existing SP benefits (the “stacked”
model), and still others have considered the elective program that is the subject of this report.
The most recent public IRS data show that 885,000 tax-filing households in Pennsylvania claimed
the federal EITC in Tax Year 2019, costing the federal government a total of $2 billion, and
providing an average tax credit of $2,289 per household.25 A state credit providing a 10%
supplement would therefore offer approximately $229 on average per household, or $202.6
million total in benefits, assuming that only, and all, of the 2019 federal EITC recipients would
claim the new state credit. Using 2017 data and slightly different assumptions, the Center on
Budget and Policy Priorities estimated that a state EITC would cost Pennsylvania $211 million if
set at 10% of the federal credit.26 (Neither of these estimates accounts for the elective program,
wherein some families who receive the federal EITC may opt for the SP for their state tax relief
instead of the state EITC if the SP benefit is larger.)
An analysis conducted in August 2020 by the Pennsylvania Budget and Policy Center
assumed that the state would implement the “stacked” state EITC and estimated the costs of
a 20%, 25%, and 30% credit.27 The Center estimated that the costs of the stacked program
would be approximately $397 million annually with a credit set at 20%, rising to $595 million
when set at 30% of the federal credit.
The most comprehensive cost analysis of a Pennsylvania state EITC was conducted in 2009 by the
Joint State Government Commission of Pennsylvania, which used data from the state’s
Department of Revenue to estimate the short-term and long-term impacts of all three possible
state EITC programs: replacement, stacked, and elective.28 The Commission estimated that the
elective program would cost $76.9 million in 2010 dollars with a 10% credit, rising to $241.9
million at 20%, and finally $425.2 million for a 30% state credit. To arrive at these figures, the
Commission estimated the number of tax filers who would qualify for both programs but who
would choose the EITC because the benefit would be larger, and then added to that the number of
filers who would qualify for the state EITC but did not qualify for the SP previously (representing
new costs to the state). The additional benefits to each household (beyond what the state was
already spending on the SP program) were summed to arrive at the total new cost of the elective
program, relative to the status quo.
The present analysis uses a similar methodology as the Joint State Government Commission to
estimate the costs of the elective program, but uses more recent data and slightly different
assumptions, enumerated in the following section.
childandfamilyresearch.utexas.edu | 7Pennsylvania State EITC: A Benefit-Cost Analysis
December 2021
Cost Estimate: Methodology
Data Set
To estimate the new costs of the elective state EITC program, beyond what Pennsylvania already
spends for the current tax relief program (SP), we used data from the US Census Bureau’s 2019
American Community Survey (ACS). Because of pandemic-related delays in data collection, final
ACS datasets for 2020 were not yet available at the time of this report. ACS data are collected
nationwide each year, sampling over 3.5 million households, whose responses are weighted to
estimate the complete national and state populations in the US.29 The data are often used to
allocate public funding and understand the need for government services and programs across
the country. The ACS collects a range of demographic and economic characteristics from each
respondent, but we examined the following indicators because they impact a tax filer’s eligibility
for the EITC and SP and are necessary to determine the precise tax forgiveness benefit that each
program may provide the filing individual or family:
• Marital status, age, number of household members who could be claimed as qualified
dependents
• Income in the past 12 months, total and amount for each type of income:30 1) Wages,
salary, commissions, bonuses, or tips from all jobs; 2) Self-employment income from own
nonfarm businesses or farm businesses, including proprietorships; 3) Interest, dividends,
net rental income, royalty income, or income from estates and trusts; 4) Social Security
or Railroad Retirement income; 5) Supplemental Security Income (SSI); 6) Public
assistance or welfare payments; 7) Retirement, survivor, or disability pensions; and 8) All
other income (e.g., child support, alimony, veterans’ payments, unemployment benefits,
and other subtypes).
Importantly, Pennsylvania taxes income in categories 1, 2, and 3, but does not tax income in
categories 4, 5, 6, or 7.31 Federal income tax liability includes categories 1, 2, 3, and 7. Some
subtypes of income in category 8 may be taxable by the state and/or federal government, but
the amount is reported to the ACS as a single total, without disaggregated subtypes. We
therefore excluded category 8 from our calculation of each household’s taxable income, because
many of the subtypes are not taxable in Pennsylvania. To determine which tax-filing units may
be potentially eligible for the EITC based on age and number of dependents (before considering
income), we divided the respondents into 10 mutually exclusive household types, listed below in
Table 1 (see Table A.2 in the Appendix for more detailed eligibility requirements for both the
EITC and the SP tax relief program).iii
iii
ACS respondents provide their citizenship status, but not work authorization status. Given that EITC eligibility
requires recipients to be authorized to work in the US (with a valid Social Security number), we assumed that both
citizen and noncitizen respondents to the ACS were authorized to work. This approach may slightly overestimate
the number of respondents who are eligible to work, but it is likely that ACS survey respondents who report income
have proper work authorization.
childandfamilyresearch.utexas.edu | 8Pennsylvania State EITC: A Benefit-Cost Analysis
December 2021
We estimated the share of householdsiv who are eligible for the federal and state EITC based on
their level of total taxable income reported in ACS, and calculated their average state EITC benefit
with a refundable state EITC worth 10% of the federal credit. The estimates displayed in Table 1 do
not yet account for the likelihood that some households may claim the SP instead, which is
considered in Table 2.
Table 1: Household (Tax-Filing Unit) Types in Pennsylvania ACS Sample and EITC Eligibility
% of ACS Sample Average State EITC Benefit
Household Type: Eligible for EITC When (Among Eligible) With a 10%
Age, Filing Status, Dependents Income is Considered State EITC
Head of household (HOH)
0% (ineligible based
1 and/or spouse is age 65 or N/A
on demographics)
older; no dependents
HOH and/or spouse is
0% (ineligible based
2 under age 25; no N/A
on demographics)
dependents
Single adult (age 25 to 64),
3 15% $29
no dependents
Single HOH (any age), 1
4 56% $224
dependent
Single HOH (any age), 2
5 61% $362
dependents
Single HOH (any age), 3 or
6 69% $378
more dependents
Two adults filing jointly
7 (ages 25 to 64), no 4% $32
dependents
Two adults filing jointly
8 14% $213
(any age), 1 dependent
Two adults filing jointly
9 14% $309
(any age), 2 dependents
Two adults filing jointly
10 (any age), 3 or more 27% $389
dependents
Statewide Average 15% $206
iv
We use “households” to mean tax-filing units in this report, even though a colloquial household may contain
multiple tax-filing units. For example, cohabiting, unmarried couples within the same household are considered to
be two separate tax-filing units in our sample because each individual in the couple files a separate tax return.
childandfamilyresearch.utexas.edu | 9Pennsylvania State EITC: A Benefit-Cost Analysis
December 2021
Assumptions and Methodology
To calculate the total direct costs of the elective state EITC program (including tax revenue
forgiven and refunds paid to households), we used the income data provided in the ACS and the
benefit schedules shown in Figure A.2 in the Appendix to determine program eligibility and to
calculate the following values for each tax-filing unit using the Stata statistical software program:
• Total Pennsylvania personal income tax liability (3.07% flat personal income tax applied
to total taxable income)
• Total tax relief under the SP program (if eligible)
• Total state EITC amount (if eligible)
If a filing unit was determined to be eligible for the SP program but not the state EITC, then the
unit posed no additional cost to the state of Pennsylvania with the introduction of a state EITC,
relative to current expenditures on the SP program.
If a unit was determined to be eligible for the state EITC but not the SP, we assumed the filer
would claim the state EITC, and the tax-filing unit’s state EITC amount represented a new cost to
the state of Pennsylvania.
If a unit was determined to be eligible for both the SP and the state EITC, we assumed that the
filer would claim the benefit offering a larger value. If the SP offered the greater benefit, we did
not consider the SP amount to be a new cost to the state of Pennsylvania, because the filing unit
may already claim the SP under current policy. However, if the state EITC offered a greater
benefit, we calculated the difference between the state EITC benefit and the SP benefit. The
difference represents the additional cost to the state of Pennsylvania over what the state may
already spend on tax relief for that household through the SP program.
Finally, we summed the additional costs to the state for all households likely to claim state
EITC benefits as described above, and this total represents the direct costs of the elective
state EITC program. Based on IRS research, the administrative costs of the EITC are typically
less than 1% of the benefits (direct costs), so we added an additional 1% to the direct costs to
account for administration.32
Cost Estimates: Findings
Cost Estimates for a 10% Refundable State EITC
We estimated that 1,022,299 households in our sample would claim benefits from the SP
program but not the state EITC, with a total SP benefit value of $216,727,388 (with an average
SP benefit of $212 per household). This total represents a cost that the state of Pennsylvania
would incur even in the absence of a new state EITC program. We estimated that 715,652
households would claim the new state EITC either because the EITC benefit is greater than their
SP benefit, or because they are ineligible for SP benefits. Their total EITC benefits amount to
childandfamilyresearch.utexas.edu | 10Pennsylvania State EITC: A Benefit-Cost Analysis
December 2021
$141,063,096, with an average benefit of $197v per household. However, some of the 715,652
households would have previously received SP benefits prior to the introduction of the state
EITC. We therefore subtract the SP benefits for households in which the EITC is greater than the
SP to calculate new costs to the state as a result of the EITC, over what the state would have
spent on those households’ SP benefits had the new EITC program not been implemented.vi The
new costs for those claiming the state EITC amount to $79,751,686. This total represents
benefits to Pennsylvania families in tax forgiveness and refunds. Adding 1% of the direct costs to
account for administrative expenses results in a total cost to the state of $80,549,203.
These costs assume that all eligible households claim the benefit, but data show that the EITC
does not have a 100% take-up rate. The most recent IRS statistics show that approximately
80.3% of Pennsylvania households eligible for the federal EITC claim the benefit.33 If we assume
an 80.3% participation rate for the state EITC as well, then the total cost (including direct and
administrative costs) is reduced to $64,681,010. A more optimistic 90% participation rate would
generate a total cost of $72,494,283.
The expected total costs of an elective, refundable 10% state EITC range from $64,681,010 to
$80,549,203 depending on the take-up rate among eligible families. The program would return
almost $80 million to over 715,000 working families in Pennsylvania, beyond current tax relief.
Table 2: Direct Costs of the Elective State EITC Program (10% Refundable State EITC)
Mean Cost to the New Cost of the
Benefit Claimed Households Benefit State Elective EITC
Will Claim Neither EITC
5,375,631 $0 $0 $0
nor SP
Will Claim State EITC 715,652 $197 $141,063,096 $79,751,686
Will Claim SP 1,022,299 $212 $216,727,388 $0
Pennsylvania Total 7,113,582 $79,751,686
Among the households expected to claim the state EITC, the average income is $21,636, and for
households likely to claim the SP benefit, the average income is $17,412 (shown in Table 3). The
likelihood of choosing one benefit over the other depends on multiple interacting factors,
including income, number of dependents, marital status, and the phase-in and phase-out
structures of each program. Therefore, the optimal choice varies for each family. The average
household income for those who claim each of the programs suggests that those who claim the
v
Benefit values are rounded to whole numbers in the tables and text, but precise values for the benefits (including
decimal values) were used to generate the totals.
vi
A total of 482,920 of the 715,652 households are not eligible for SP benefits, but would be eligible for a potential
state EITC, and the 232,732 remaining households are expected to switch from SP to EITC because the EITC offers a
larger benefit than the SP. The average difference between the EITC and SP value in our data set among those who
ultimately claim the EITC was $111 (more precisely, 111.4392), which was multiplied by 715,652 to arrive at
$79,751,686.
childandfamilyresearch.utexas.edu | 11Pennsylvania State EITC: A Benefit-Cost Analysis
December 2021
EITC have slightly higher incomes than those claiming the SP, though both groups have low
incomes overall. An elective state EITC program will therefore provide tax relief to a greater
number of households who face financial hardship, amplifying the impact of the existing tax
forgiveness policy and reaching more families who are considered ALICE in addition to those
below the poverty level.
Table 3: Household Characteristics (10% Refundable State EITC)
Benefit Claimed Households Mean Income Median Income
Will Claim SP 1,022,299 $17,412 $7,879
Will Claim State EITC 715,652 $21,636 $16,667
Will Claim Neither
5,375,631 $69,821 $46,467
EITC nor SP
Pennsylvania Total 7,113,582 $57,442 $33,840
Cost Estimates for a 25% Refundable State EITC
The expected direct costs of a 25% EITC cannot be calculated by simply multiplying the costs of
the 10% EITC by 2.5, because the greater EITC benefit value will likely result in more families
switching from the SP to the EITC when eligible for both. Therefore, the proportion of families
electing each benefit will change, not just the benefit value. Table 4 shows the direct costs of the
25% state EITC, which amount to $362,582,613 before administrative costs are considered. This
total represents almost $363 million in tax forgiveness to working Pennsylvania families. Adding
a 1% administrative cost produces an estimate of $366,208,439.
Using the 80.3% and 100% take-up rates provides a range of $294,065,377 to $366,208,439 for
the total new costs of a 25% state EITC. The 25% credit would provide close to $363 million in
tax credits to over 870,000 working Pennsylvania families beyond current tax relief.
Table 4: Direct Costs of the Elective State EITC Program (25% Refundable State EITC)
Mean Cost to the New Cost of the
Benefit Claimed Households Benefit State Elective EITC
Will Claim Neither EITC
5,375,631 $0 $0 $0
nor SP
Will Claim State EITC 873,923 $594 $519,065,517 $362,582,613
Will Claim SP 864,028 $140 $121,119,791 $0
Pennsylvania Total 7,113,582 $362,582,613
childandfamilyresearch.utexas.edu | 12Pennsylvania State EITC: A Benefit-Cost Analysis
December 2021
III. Benefits of the Proposed State EITC Program
Comparing the benefits of a state EITC to the program’s budgetary cost offers a fuller picture of
the net cost of implementing a state EITC in Pennsylvania. We offer estimates for two categories
of benefits: the fiscal benefits and the human services cost avoidance for the state.
Fiscal benefits include greater tax revenue and reduced state public assistance spending. Studies
overwhelmingly show that federal and state EITCs boost labor force participation and annual
hours of work, particularly among women, and this leads to greater household earnings.34 The
increased earnings result in greater tax revenue for state and local governments,35 as well as
lower expenditures on public assistance programs, because households have greater earned
income with which to access needed resources.
Pennsylvania may also avoid significant future costs in health and human services programs as
a result of implementing a state EITC. EITCs have been shown in rigorous research to produce
a host of positive outcomes for families and society in terms of better social, health, economic,
and educational trajectories for both children and adults.vii,36 Better outcomes in these areas,
such as increased high school graduation rates, better infant health, and lower rates of foster
care entry, may save the state significant public funds.
EITC researchers Dr. Jacob Bastian and Dr. Maggie Jones recently calculated the EITC’s marginal
value of public funds (MVPF)viii to be between $3.18 and $4.23 in the short run, indicating that
each dollar spent on the EITC produces over $3 in social value.37 In the long run, their 2021
analysis actually “suggests an MVPF of infinity” (p. 4) because of the savings related to social and
health spillover effects over the life course and even intergenerationally.
State Fiscal Impacts of Implementing an EITC in Pennsylvania
Estimates from Previous Research
A 2021 study titled “Do EITC expansions pay for themselves?” demonstrates that the benefits of
federal and state EITCs may far exceed their costs.38 The study, conducted by Drs. Bastian and
Jones, examined the fiscal and economic impacts of an additional $1,000 in the maximum
possible federal and state EITC benefits available to families in the US given their characteristics
such as family size, marital status, and state of residence. The $1,000 increase in the maximum
EITC benefit available, based on a policy change to increase generosity, is considered the
additional “EITC exposure,” which is a term used in subsequent sections of this analysis to
distinguish the policy change from the change in actual EITC benefits that a family may receive
once their income is taken into account. The change in exposure is typically used as the
predictive variable in EITC impact studies instead of actual benefits received, given that benefits
vii
Prior to conducting the benefit-cost analysis, the Prenatal-to-3 Policy Impact Center conducted a comprehensive,
systematic review of the evidence for the impact of state EITCs on early childhood outcomes, analyzing the effects
found in strong, causal studies of federal and state EITCs. This evidence review can be found in our Policy
Clearinghouse. We use these results, as well as results from additional studies, as the basis for calculating the
expected benefits in Pennsylvania.
viii
A policy’s MVPF is the ratio of the benefits to the net government costs.
childandfamilyresearch.utexas.edu | 13Pennsylvania State EITC: A Benefit-Cost Analysis
December 2021
are a function of income levels, and income level is often independently correlated with the
economic and social outcomes explored in EITC studies. To isolate the EITC’s effect on such
outcomes, separate from the effect of the family’s original economic circumstances, an increase
in EITC exposure (the policy change) is often used rather than a change in the precise benefits
that individual families receive.
The Bastian and Jones study, which used a more sophisticated data set and larger sample
than many EITC analyses, ran separate models to isolate the effects of state and federal
credits. Results showed that a $1,000 increase in the maximum state EITC credit available to
households led to the following impacts among the study’s sample of 1.2 million women
ages 19 to 64: a 0.9 percentage point increase in the employment rate, an additional $1,345
in earnings per household, an additional $216 in federal and state taxes paid ($60 of the
$216 represented state taxes), and a reduction of $234 in public assistanceix received per
household ($98 of the $234 were state savings).
According to the authors, the results of their study suggest that most expenditures for federal
and state EITCs are recouped in the form of greater average tax revenues and reduced public
assistance spending per household.39 In addition, the authors assert that once the positive
spillover effects from health and social benefits are accounted for (explored further in Section III
of this report), the EITC’s net cost “appears to be zero or even negative,” (p. 18) meaning that the
EITC may pay for itself while producing significant benefits for families and society.
Other studies find similar or even greater increases in earnings as a result of more generous EITC
policies, depending on whether their samples examine the federal credit as well, and whether
their samples only examine unmarried women, or women with low education levels, who are
often eligible for greater EITC benefits than married women and those with higher educational
attainment. A sample of effects for both employment and earnings is presented below:
Employment
• With each $1,000 increase in maximum EITC benefits (state and federal), unmarried
mothers were between 5 and 9 percentage points more likely to work, depending on the
children’s ages (Michelmore & Pilkauskas, 2021)40
• A 10% state EITC boosted unmarried mothers’ employment by 2.1 percentage points
(Neumark & Wascher, 2011)41
• With an additional $1,000 in maximum EITC benefits, unmarried mothers’ weekly work
hours increased between 1.6 and 3.0 hours42 (Bastian & Lochner, 2021 and Michelmore
& Pilkauskas, 2021)
ix
Programs included Temporary Assistance for Needy Families (TANF), the Supplemental Nutrition Assistance
Program (SNAP), public housing programs, unemployment and disability insurance, Supplemental Security Income
(SSI), and worker’s compensation benefits.
childandfamilyresearch.utexas.edu | 14Pennsylvania State EITC: A Benefit-Cost Analysis
December 2021
Earnings
• A $1,000 increase in maximum possible EITC benefits (state and federal) led to a $2,000
increase in mothers’ annual pre-tax earnings, with a greater effect ($2,372) for single
mothers (Bastian & Lochner, 2021)43
• A $1,000 increase in maximum possible EITC benefits (state and federal) led to a $2,400
increase in annual pre-tax earnings for families with children under age 3 (Michelmore &
Pilkauskas, 2020)44
• A 10% state EITC led to a 2.2% increase in earnings among single mothers (Neumark &
Wascher, 2011)45
Estimates for Pennsylvania: Tax Revenue and Reduced Public Assistance Spending
We use the earnings effects offered in Bastian & Jones (2021) to analyze impacts for
Pennsylvania because the study includes a separate analysis for the state EITC, rather than
including federal benefits, and the study offers the most recent estimates available.
To estimate the fiscal impacts for Pennsylvania using the effects described in the literature,
we first calculate how a 10% and 25% state EITC would change the maximum EITC benefits
for various households. The state EITC would increase the maximum EITC exposure by a
different amount for families with different numbers of dependents. The maximum credits
are the same regardless of whether the tax return is for a single filer/head of household or a
married couple filing jointly, but the credit phases out at higher income thresholds for
couples filing jointly (see Figure A.1 in the Appendix for details). The maximum federal EITC
amount for a family with three or more children is $6,728. Adding a 10% state credit would
therefore offer a $672.80 increase in maximum possible EITC benefits for such a family
(rounded to $673). Table 5 shows the approximate increase in exposure for each household
type using the Tax Year 2021 EITC benefit schedule.
Table 5: Increase in Maximum EITC Exposure with a 10% and 25% Refundable State EITC
Maximum Federal Maximum State Maximum State
Family Structure Credit Credit (10%) Credit (25%)
3 or More Dependents
(Single Head of Household or $6,728 $673 $1,682
Filing Jointly)
2 Dependents
(Single Head of Household or $5,980 $598 $1,495
Filing Jointly)
1 Dependent
(Single Head of Household or $3,618 $362 $905
Filing Jointly)
No Dependents
(Single Head of Household or $543 $54 $136
Filing Jointly)
childandfamilyresearch.utexas.edu | 15Pennsylvania State EITC: A Benefit-Cost Analysis
December 2021
Using 2019 Census data for Pennsylvania from the American Community Survey, we apply the
above maximum benefits to calculate a weighted average of the increase in maximum state EITC
benefits for families with children,x resulting in an average increase of $507.71 in maximum state
EITC benefits available to families given a 10% credit (or $1,269.29 with a 25% credit). Most EITC
research uses a standard $1,000 increase in maximum benefits (exposure) to examine the
credit’s impact, so we adjust the effect sizes from the research to correspond to the $507.71
average increase in the case of a 10% state credit or $1,269.29 with a 25% credit.xi We use this
adjustment method for benefits that are described in the research using a $1,000, $100, or other
unit increase. As shown previously in Tables 2 and 4, the actual state EITC benefits received by
families likely to claim the credit in Pennsylvania amount to approximately $197 on average per
household for a 10% state EITC, or $594 with a 25% credit, because not every family receives the
maximum credit—some families’ incomes put them on the phase-in or phase-out portions of the
EITC benefit schedule (shown in Figure A.2 in the Appendix).
Increased State Tax Revenue
Estimate for Personal Income Taxes
To estimate the potential increase in Pennsylvania state income tax revenue as a result of a 10%
state EITC, we adjust the average earnings effect of $1,345 per woman ages 19 to 64 found in
Bastian & Jones (2021) as described above, resulting in a $682.87 earnings increase. Then, we
apply the 3.07% Pennsylvania personal income tax rate to the earnings increase of $682.87 to
result in an increase of $20.96 in state personal income taxes per individual. Finally, we multiply
this figure by the number of women ages 19 to 64 in Pennsylvania (3,817,354),46 which reflects
the sampling strategy in Bastian & Jones for their national analysis.xii The resulting increase in tax
revenue is approximately $80,011,740. Estimates for a 25% state EITC are shown in Table 6.
➢ As a result of increased employment and earnings associated with the implementation
of a 10% state EITC, Pennsylvania may see an annual benefit of over $80 million in
additional personal income tax revenue (or $200 million with a 25% credit).
Estimate for Sales, Payroll, and Unemployment Insurance Taxes
Bastian & Jones (2021) also estimated that for each additional $1,000 in maximum state EITC
benefits, federal and state governments would see increased revenue in the form of sales,
payroll, and unemployment insurance (UI) taxes. Out of an estimated $216 per person in
increased sales, payroll, and UI taxes, $60 was estimated to be state taxes, and $156
x
We only include families with dependents in this calculation because they are much more likely to be eligible for
the EITC, and the very small benefit for workers with no children would skew the average.
xi
For example, if a study notes that a $1,000 increase in maximum EITC benefits would produce a 30% increase in a
given positive outcome, then a $507.71 increase may produce approximately half of that effect, or a 15% increase in
our desired outcome.
xii
The Bastian & Jones sample includes women ages 19 to 64 who are not dependents, whereas our sample includes
women ages 19 to 64, regardless of dependency status, because of data limitations. We expect that a small number
of women among the 3.8 million, particularly within the ages of 19 to 24, may be claimed as dependents due to
status as full-time students, a disability, or other circumstances.
childandfamilyresearch.utexas.edu | 16Pennsylvania State EITC: A Benefit-Cost Analysis
December 2021
represented federal taxes. Adjusting the $60 effect to correspond to the $507.71 increase in
exposure (rather than the standard $1,000 increase), we estimate that a 10% state EITC would
result in a $30.46 per-person increase in sales, payroll, and UI taxes that accrue to the state.
Multiplying the $30.46 by the sample of women ages 19 to 64 in Pennsylvania yields
approximately $116,276,603 in additional state revenue from these taxes.
➢ Pennsylvania may reap an annual benefit of approximately $116 million in state sales,
payroll, and UI taxes as a result of a 10% state EITC program (or $291 million with a
25% credit).
Decreased State Public Assistance Spending
Research demonstrates that state and federal EITCs are associated with lower public assistance
spending on programs including Temporary Assistance for Needy Families (TANF), the
Supplemental Nutrition Assistance Program (SNAP), public housing programs, unemployment
and disability insurance, Supplemental Security Income (SSI), and worker’s compensation
benefits.47 Bastian & Jones (2021) identified a decrease of $234 in public assistance spending per
person with each $1,000 increase in maximum state EITC benefits, comprised of $98 in reduced
state spending on the programs listed above, and $136 in reduced federal spending. Adjusting
the $98 to correspond to the $507.71 increase in state EITC exposure, we calculate a reduction
of $49.75 per person in public assistance spending as a result of a 10% Pennsylvania state EITC.
Multiplying the $49.75 by the same sample as above yields a reduction of $189,913,362 in public
assistance spending on the listed programs.
➢ Pennsylvania may see a reduction of approximately $190 million in public assistance
spending with the implementation of a 10% state EITC (or $475 million with a 25% credit).
As shown in Table 6, summing the fiscal benefits for a 10% state EITC results in an estimated
$386 million per year in state revenue gained through additional taxes and reduced spending.
With a 25% EITC, the fiscal benefits amount to approximately $966 million.
Table 6: Fiscal Benefits Per Year with a 10% and 25% Refundable State EITC
Benefit Category Benefits with a 10% EITC Benefits with a 25% EITC
Increased State Tax Revenue
$80,011,740 $200,067,523
(Personal Income Tax)
Increased State Tax Revenue
$116,276,603 $290,729,681
(Sales, Payroll, UI Taxes)
Reduced Public Assistance
$189,913,362 $474,840,664
Spending
Total Fiscal Benefits $386,201,705 $965,637,868
childandfamilyresearch.utexas.edu | 17Pennsylvania State EITC: A Benefit-Cost Analysis
December 2021
Health and Human Services Impacts and Cost Avoidance as a Result of a State EITC
Below, we present estimates for how a refundable state EITC may improve a range of health and
social outcomes for individuals and families in Pennsylvania, including the following selected
indicators:
• Child poverty
• Low birthweight incidence and hospital costs
• Need for special education
• Infant mortality
• Foster care entry
• Educational attainment
• Child health coverage
• Crime and public safety
• Adult suicide prevention
Where possible, we monetize the indicators based on cost avoidance figures in policy research
and publicly available data specific to Pennsylvania. Based on the assumptions and estimates
detailed below, Pennsylvania may avoid approximately $176 million in health and human services
costs per year after implementing a 10% refundable state EITC program, using a low-end
estimate, or approximately $214 million with a 25% credit. The high-end estimate, including
private benefits that may be realized over the longer term, reaches $1.8 billion with a 10% credit
or $2.8 billion with a 25% credit. See the Summary of Benefits, Tables 15 through 17, for details.
Importantly, the cost estimate in Section II represents the additional or marginal cost of a state
EITC beyond what Pennsylvania already spends on the SP tax relief program. The benefits of a
state EITC offered in this report do not account for the benefits that the SP program may already
produce, because there is insufficient research on the social, economic, and health effects of the
SP program whereas there is a rich literature on the social spillover impacts of the EITC.
Child Poverty
Research shows that through increasing household resources, state and federal EITC benefits
work together to reduce the share of children living below the federal poverty level (FPL).48
Effects have been found to be particularly large for families with the youngest children, under
age 3, with one study finding that a $1,000 increase in combined federal and state EITC exposure
reduced the poverty rate by 5 percentage points for infants and toddlers, and reduced extreme
poverty (below 50% of FPL) by 9 percentage points.49
Although state EITCs have a smaller impact on poverty than the federal credit because they
provide lower benefits, state EITCs have been shown to independently contribute to mitigating
child poverty. One study found that states with refundable EITCs had child poverty rates that
were 40% lower than in states without their own EITCs between 1994 and 2003.50 More recent
research has also found significant, though more modest, effects, showing that state EITCs reduce
childandfamilyresearch.utexas.edu | 18Pennsylvania State EITC: A Benefit-Cost Analysis
December 2021
child poverty rates (using the Supplemental Poverty Measurexiii or SPM) by between 0.7
percentage points and 1.2 percentage points overall, depending on the study and the generosity
of the state credit.51 Two studies have simulated impacts for Pennsylvania in particular:
• A 2017 study by the University of New Hampshire’s Carsey School of Public Policy
estimated that a 10%, 20%, or 30% refundable state EITC may reduce Pennsylvania’s
child poverty rate (SPM) by 0.1, 0.4, and 0.8 percentage points, respectively.52
• A 2020 study by leading child poverty scholars estimated that if Pennsylvania were to
implement a 43% refundable state EITC,xiv the state may see a 0.67 percentage point
reduction in the child poverty rate (SPM).53 If all states adopted a credit of this generosity
level, the national child poverty rate was predicted to drop by 1.2 percentage points overall.
US Census data from the 2019 American Community Survey show that 14.8% of Pennsylvania
children (or approximately 389,922 children out of 2,634,613 total children, using 2019 Census
Population Estimates) lived below the federal poverty level using the Supplemental Poverty
Measure,54 whereas 16.3% (or approximately 429,442 children) lived in poverty using the Official
Poverty Measure.55 Applying the most conservative effect shown above for a 10% state EITC,
which suggested a 0.1 percentage point reduction in the poverty rate, we estimate 2,635 fewer
children in poverty in the state, whereas the 0.4 percentage point effect for a 20% credit
suggests 10,538 fewer children, and the 0.8 percentage point effect for a 30% credit suggests
21,077 fewer children in poverty.
The state EITC would bolster the significant impacts of existing federal programs, including the
federal EITC and child tax credit, which together lift over 220,000 people (children and adults)
out of poverty in Pennsylvania each year.56 Research also shows that increasing maximum EITC
benefits by $1,000 leads to a 3 percentage point increase in the share of children whose families
earn above 130% of the FPL, and a 1.5 percentage point increase in the share with earnings
above 230% of poverty (considered near-poor).57
➢ A 10% state EITC may lift over 2,635 Pennsylvania children out of poverty and increase
household resources for children in near-poor households. A 20% state EITC may lift
10,538 children above the federal poverty level, or 21,077 children with a 30% credit.
In addition to the significant human toll, child poverty is costly to states and the federal
government. The economic cost of child poverty in the US was estimated at $1.03 trillion in
2021, based on poverty’s impact on crime, health, reduced future earnings, homelessness, and
other social ills.58 The Pennsylvania Budget and Policy Center has estimated that child poverty
costs the state over $17.5 billion annually, and a state EITC could therefore mitigate these
xiii
The Supplemental Poverty Measure (SPM) differs from the Official Poverty Measure because it accounts for tax
credits (such as the EITC) and public assistance received. According to the US Census Bureau, the Official Poverty
Measure counts “gross before-tax cash income” whereas the SPM counts the “sum of cash income, plus noncash
benefits that resource units can use to meet their [food, clothing, shelter, and utilities] needs, minus taxes (or plus
tax credits), minus work expenses, medical expenses, and child support paid to another household.”
xiv
The study simulated a 43% credit for all states because that was the most generous rate available in the study’s
data set, which spanned from 2010-2012.
childandfamilyresearch.utexas.edu | 19You can also read