Implementation of Barcode Technology to Logistics Processes of a Company
←
→
Page content transcription
If your browser does not render page correctly, please read the page content below

sustainability

Article
Implementation of Barcode Technology to Logistics Processes of
a Company
Jaroslava Kubáňová, Iveta Kubasáková, Kristián Čulík *                          and Lukáš Štítik

                                            Department of Road and Urban Transport, University of Žilina, 01026 Žilina, Slovakia;
                                            jaroslava.kubanova@fpedas.uniza.sk (J.K.); iveta.kubasakova@fpedas.uniza.sk (I.K.); lukasstitik@gmail.com (L.Š.)
                                            * Correspondence: kristian.culik@fpedas.uniza.sk; Tel.: +421-41-513-3540

                                            Abstract: The article focuses on expanding the use of barcodes in selected logistics activities in a
                                            company. Our study discusses the application of barcode technology to selected logistics activities
                                            in the company in order to address the error rate in these activities and to control ownership of
                                            this technology in other logistics activities within the company during the COVID-19. The priority
                                            of the testing phase was to point out the elimination of errors in the original versus the newly
                                            proposed solution for the company on 10 products. In the test phase, the 10 products with the highest
                                            turnover in the company were used to point out the elimination of errors in various logistics activities,
                                            especially the time saved compared to the work of human personnel in the company. The company
                                            has this technology at its disposal, in the parent company as well as in the subsidiary. It was only
                                            a matter of expanding the use and applicability of this technology as well as other possibilities for
                                            research hypotheses, which we outlined at the end of the article. In this article, we focus on RFID and
                                            barcode technologies, since the company initially considered using RFID technology, however, chose
                                            the use of barcodes because it was an already known work technology. The current situation affected
                                            with COVID-19 disease requires many advantages and disadvantages of both technologies.


                                            Keywords: RFID technology; barcode; comparison; company; production
Citation: Kubáňová, J.; Kubasáková,
I.; Čulík, K.; Štítik, L. Implementation
of Barcode Technology to Logistics
Processes of a Company.
Sustainability 2022, 14, 790. https://      1. Introduction
doi.org/10.3390/su14020790                       The RFID (Radio Frequency Identification) technologies arose after 2003. They improve
Academic Editors: Ján Ližbetin and
                                            the effectiveness of many processes. Thanks to automatization, it is possible to save a lot of
Ondrej Stopka
                                            time. These technologies also have some vulnerabilities that we should consider during
                                            their application. By its very nature, automated identification has the potential to expose its
Received: 18 November 2021                  subject to privacy and security risks. Literature [1] identifies these specific vulnerabilities
Accepted: 6 January 2022                    associated with barcodes and RFID technologies and discusses ways to address such risks.
Published: 11 January 2022
                                                 To supplement the theoretical knowledge in the literature on these two technologies,
Publisher’s Note: MDPI stays neutral        we have used a study by the University of Bristol entitled “A Comparison of Barcoding
with regard to jurisdictional claims in     and RFID Technologies in Practice.” This study compares RFID technology and barcode
published maps and institutional affil-     technology used by an unnamed company in their refrigerated warehouse. The company
iations.                                    currently provides a comprehensive supply chain solution for several companies in the
                                            EU. The Marks & Spencer Company contacted this unnamed company and requested
                                            RFID technology introduction into its food supply chain. This chosen system replaced
                                            the existing barcode system. After the RFID technology implementation in one of the
Copyright: © 2022 by the authors.
                                            refrigerated warehouses, it was possible to prepare a comprehensive study [2].
Licensee MDPI, Basel, Switzerland.
                                                 The paper describes the information gathered from the company, the method of
This article is an open access article
                                            collecting data, then the evaluation of the information obtained by the test phase of the
distributed under the terms and
                                            barcode implementation and the start of the test phase on the ten cables. We described
conditions of the Creative Commons
                                            the results of the measurements and the error rate in the Results section of the paper. The
Attribution (CC BY) license (https://
                                            discussion and conclusion include evaluation, other possible measurements, and answering
creativecommons.org/licenses/by/
4.0/).
                                            the hypotheses.

Sustainability 2022, 14, 790. https://doi.org/10.3390/su14020790                                           https://www.mdpi.com/journal/sustainability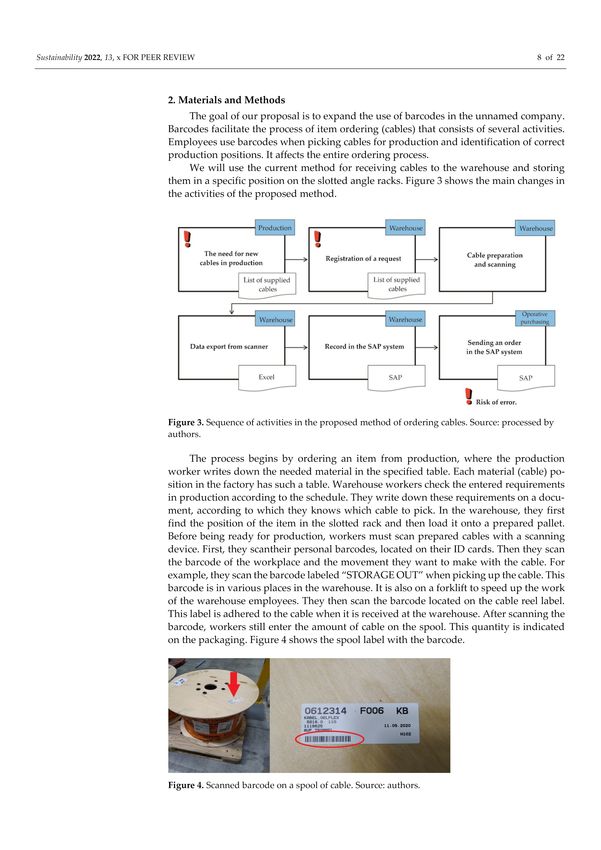
Sustainability 2022, 14, 790                                                                                            2 of 20

                                    The study focuses on the operational performance of the technologies as scan cycle
                               time and device failure. Data were collected in the refrigerated warehouse using time and
                               motion studies of employees using RFID and barcode technology to scan products shipped
                               in stackable plastic trays. Operator uptime was measured using a stopwatch for each
                               scan cycle. The cycle began by activating the scanning device and ended by successfully
                               scanning a stack of plastic trays. Measurements lasted during the morning shift between
                               7:00 and 9:00 on Sunday, Monday, and Tuesday. As part of the sample size selection,
                               20 warehouse employees were selected. These fully trained employees performed barcode
                               and RFID scanning. Their age ranged from 21 to 48 years [2].
                                    The following table (Table 1) shows scan cycle times measured over the monitored
                               days divided according to the used technology.

                               Table 1. Results of scan cycle times for monitored days. Source: [2].

                                         Number of
    Day and Used Technology                                       Min. Value (s)          Max. Value (s)    Average (s)
                                         Scanning
          Sunday—RFID                         80                         5.0                   15.7             9.520
         Sunday—barcode                       80                        18.4                   35.4            24.895
          Monday—RFID                         60                         5.2                   15.7             9.182
         Monday—barcode                       60                        15.3                   31.2            24.167
          Tuesday—RFID                        60                         5.0                   16.8            10.357
         Tuesday—barcode                      60                        18.5                   32.6            24.237

                                    Based on the measurement results, we can say that the average time of one cycle when
                               operating with RFID technology was 9.669 s and, when using barcode technology, 24.479 s.
                                    Observations of time and motion studies have revealed that many problems affect the
                               timing of RFID and barcodes that have been difficult to predict. The difficulties of RFID
                               technology were the following [2]:
                               •    non-functional RFID equipment and tags;
                               •    usage errors related to the RFID antenna;
                               •    errors when scanning the entire stack of plastic trays;
                               •    incorrect identifiers in the tray (it leads to a warning sound then the operator looks at
                                    the screen and stops scanning).
                                    The issues found with the barcodes were [2]:
                               •    missing labels on the outside of the plastic tray;
                               •    illegible labels on a plastic tray;
                               •    non-functional scanning device;
                               •    a usage error in which the operator scans the barcode incorrectly or slowly.
                                     It is clear from the previous figures that different errors occurred with both technolo-
                               gies. As part of the monitoring, 200 measurements were performed. There were 91 errors
                               in barcode scanning. It means that the error rate for barcodes was 45.5%. With RFID
                               technology, the error rate was 46.5%, which represents 93 errors. It suggests that RFID is
                               prone to more errors during the scanning process [2].
                                     The study [2] shows that RFID technology more has more user errors than barcodes.
                               In comparison, the RFID had 29 errors; barcode technology only had five errors. Perhaps
                               this suggests the maturity of the barcodes that the company used several years before.
                                     This study provides a comparative analysis of RFID and barcode technology in an
                               organization with a refrigerated warehouse. The findings support the most current research
                               about RFID. It can provide faster scan times than barcode scanning. On the other hand,
                               RFID scanning is prone to failures of device and usage errors. Improvement of employee
                               training can partially eliminate these failures [2].
                                     Figure 1 shows the error rate when using RFID technology and Figure 2 includes the
                               error rate of barcode technology.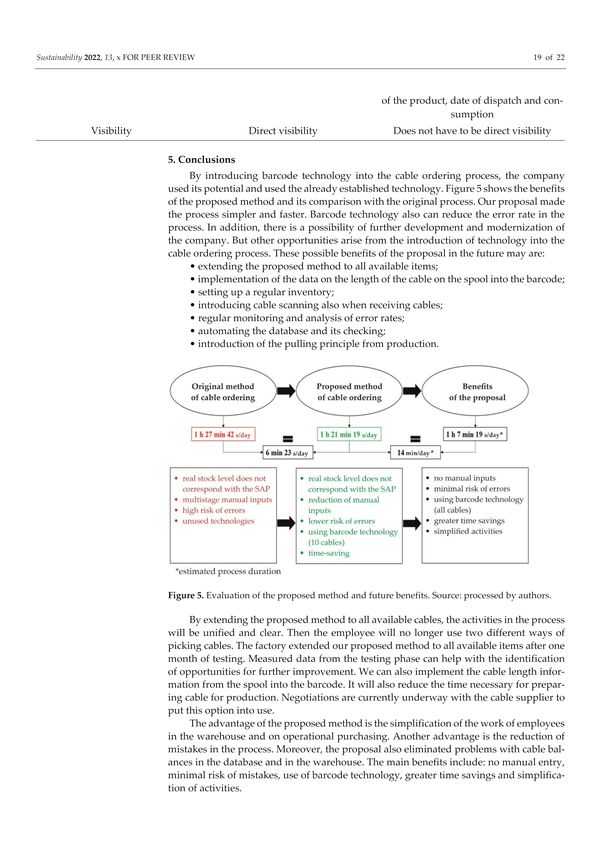
Sustainability 2022, 14, 790                                                                                          3 of 20

                               Figure 1. Error rate of RFID technology [2].

                               Figure 2. Error rate of barcode technology [2].

                                    In article [3], the authors explain the change from the use of barcodes to radio fre-
                               quency identification (RFID) in manufacturing logistics and point out the importance of
                               barcodes for the future implementation of RFID. Based on two projects, they prove the
                               interconnection of the use of barcodes and the RFIN system. The study mentions the
                               potential consequences for future activities related to the introduction of an RFID system in
                               production logistics [3].
                                    This study [4] presented the application of RFID technology to increase the efficiency
                               and effectiveness of warehouse management. The RFID system can quickly and simultane-
                               ously read multiple tags compared to sequential barcode reading with a handy barcode
                               scanner for manual operations. Significant improvement was observed in preliminary ex-
                               periments. The number of pallets and items processed by each operator per day increased
                               by 425% and 438%, respectively. Data processing time in revenue and transport docks has
                               been reduced by more than 90%. With RFID technology, it is possible to reduce the number
                               of operators while maintaining the current capacity of services in the warehouse under
                               study [4].
                                    Radio Frequency IDentification (RFID) technology is a well-known wireless appli-
                               cation for traceability, logistics and access control. It has become ubiquitous in industry
                               and in our daily lives (ticket sales, payments, passports, car keys, etc.). RFID is now a
                               standardized technology; its inherent benefits, which are unity, identification, or wireless
                               communication, provide it with decisive practical benefits that drive new developments in
                               concepts and applications. This trend is largely confirmed by the market forecast, but also
Sustainability 2022, 14, 790 4 of 20
its implementation in the field of health (smart hospital), assistance to people, as well as its
perspective in terms of new paradigms of distributed environmental intelligence and the
Internet of Things [5].
Currently, several RFID systems are commercially available for a number of applica-
tions, such as management control, transportation, supply chain, etc. However, the pooling
of RFID tags and sensors could provide many new solutions to develop, in particular, green
projects, such as more efficient energy production in chains, better waste control, recycling
and other environmental challenges. In addition, the development of these new solutions
requires the resolution of several technical issues addressed by the authors in Article [6].
The bar-code system currently in use on the market has a weakness in that identifi-
cation is only carried out when the bar-code is visible. Unlike a barcode system, an RFID
system uses radio frequency technology that allows for more accurate and faster identifica-
tion of objects than a barcode system. RFID is a method of identifying object data using
radio frequency technology by affixing a tag to identifying objects to be monitored. Recently,
active research has been carried out and many attempts have been made to introduce RFID
technology in the logistics and manufacturing sector. In Article [7], the authors present
a method of checking the exact number of cells loaded in a truck using RFID technology.
This research concerns the method by which an RFID reader and middleware are used to
accurately and quickly count the number of RFID-tagged articles in real time. When the
tagged articles reach the reader area, the information read by the reader is delivered to the
middleware. The middleware then identifies the number of tags and displays the results to
the user [7].
The RFID system has also found application in the rail transport of goods. Based
on RFID technology and the proposed problems, the authors in Article [8] propose a
well-functioning platform for managing railway package information. This platform can
provide fast, highly efficient, intelligent, secure and stable solutions. The platform consists
of five systems, which are a manual terminal system, a sorting system, a warehouse
management system, a tracking system and a railway package management system. The
implementation on the platform shows that it not only reduces the package transport cycle,
but also improves the stability and security of the logistics management system. Multiple
verification shows that the proposed platform has a very good practicality.
Although the RFID system is expanding and gradually replacing the use of barcodes, it
will certainly not be limited. On the contrary, the need for barcodes is likely to increase due
to their universal acceptance and ease of use with the low cost of barcode production (e.g., it
is usually included in the cost of printing labels or packaging materials on products) [9]. As
the population grows, so does the need to streamline and increase the safety of workplaces
and their environment. Barcodes are used in supply chain management (SCM) applications
in healthcare. The use of barcodes in healthcare facilities allows hospitals to save space
and reduce overstocking by ordering necessary supplies on a daily basis [10]. In retail,
barcodes are becoming part of smartphones with applications. Consumers can purchase
and scan items through their phones. This makes it easy for the retailer to track consumer
spending. Most manufacturing companies also turn to the barcode system. The use of
barcodes in production plants helps to speed up and streamline the production process.
However, as Table 2 shows, important advantages and disadvantages need to be considered
for barcodes, as with all IT-intensive technologies [10].
Table 2. Selected advantages and disadvantages of barcoding as a part of identification technologies.
Source: [10].
Advantages Disadvantages
Inventory Control (through tracking and Costs (associated equipment and replacement
essentially error-free readings) costs)
Accuracy (2D, 3D Barcodes), Error reduction Accuracy (especially with linear barcode)
Time savings Limitations by line of sight scanning
Easy-to-use Security issues, as they are easily readSustainability 2022, 14, 790 5 of 20
Discussing the benefits of RFID technology only makes sense if compared to bar-
codes [11]. Important advantages of RFID over barcodes include the following [9,12,13]:
1. Speed—because an RFID reader can read tags faster than a normal barcode scanner
can scan barcodes. For example, RFID readers designed for supply chain operations
can perform up to 1500 read operations per second;
2. Reading distance—because it is common to read RFID tags at a distance of at least
three meters between the tag and the antenna. Reading sizes and ranges are also
compared with different RFID chips and the longest reading range in Article [14] is
14.6 m for a metal mounting antenna. Their passive UHF RFID tag had a range of 26
m for reading using the Higgs 4 RFID chip manufactured by Alien Tech.
3. Simultaneous instead of sequential scanning—because RFID readers can identify
multiple tags in a reading field;
4. Direct view—because radio waves can penetrate most materials depending on the
frequency used;
5. Durability—as RFID tags can work in extremely demanding working conditions
and can be packaged in plastic packaging or even embedded directly into finished
products [10,15,16].
However, barcodes can be easily printed or applied directly to products, and involve
extremely accurate reading speed and very low cost [17–22].
Many authors compare the technology of using barcodes and RFID technology in the
medical environment, specifically in the handling of medicines. In recent years, reference
technology has moved to forensic techniques and systems that can transmit unique vali-
dated information over a distribution line to the point of delivery to a patient. Barcodes,
2D data matrix codes, tags and radio frequency identification (RFID) enable instant remote
authentication, making it significantly more difficult for counterfeit products to enter the
supply chain. These systems rely on a scanning and sending system, which means that,
unlike the markings on the packaging, there is no interpretation of the information by
the user; the remote device does all the work. Technology is relatively young and often
expensive, and the reliability of some of its systems is still questionable, but it offers a signif-
icant opportunity to reduce the spread of counterfeit products if government agencies and
medicine manufacturers adopt deviations from these strategies. They concluded that the
medical tracking system is better in terms of safety when using RFID technology [23–26].
The effectiveness of bar-codes and RFID is also compared by other authors. Barcoding
is an advanced technology of automatic identification (auto-ID), used in supply chain
management (SCM) for several decades now. It enjoys free governance widespread appli-
cation, especially in retail. Recently, however, radio frequency identification (RFID) has
been considered a competitive technology that is excellent in its ability to store and update
instant information as well as its non-line-of-sight (nLoS) reading ability. However, RFID is
more expensive and, even if more convenient than barcoding, the current barcode is still
the most widespread and widely used standard in the world. However, analyses have
found that the need for barcodes in the supply chain will never really go away. What is
being observed, rather, is a model of convergence, which suggests the need to integrate
both technologies into the supply chain, all of which serve a common goal [27–30].
There are many discussions about the costs and benefits of implementing RFID in
supply chains. As a result, researchers are finding an opportunity in the green field to
explore how organizations can use technology in the context of the supply chain. The
authors explore the potential benefits and limitations of RFID in a storage environment in
two ways. First, it discusses issues related to pallet-level labelling and case-level labelling by
creating a decision framework. Second, the knowledge from the framework is used to define
an object-oriented modelling framework that facilitates warehouse simulation of RFID vs.
interoperability barcode [31,32]. This simulation is used to examine some of the trade-offs
between price and performance associated with six implementation strategies. The various
strategies make important cost trade-offs and evaluate the statistical significance of the
differences [33–35].Sustainability 2022, 14, 790 6 of 20
The unique features offered by radio frequency identification (RFID) technology dis-
tinguish it from other technologies, such as the Internet and EDI, and require further
investigation, in particular related to its adoption. RFID is a wireless automatic iden-
tification and data acquisition (AIDC) technology [36] used to track shipments. RFID
caught the attention of the media when giant retailers such as Walmart, Tesco, Target
and Albertsons announced their intention to adopt RFID to streamline supply chain op-
erations and demanded that their suppliers be RFID compliant. The literature on the
adoption and use of RFID has demonstrated the high operational and strategic value of
this technology [37]. Nonetheless, many potential adopters have not opted for RFID due to
its implementation problems, including: infrastructure costs; environmental shocks; top
management concerns; second-order organizational training; resource commitment; and
organizational transformation. Most vendors have had difficulty adopting and using RFID
technology cost-effectively for competitive advantage [35]. In addition, while previous
RFID adoption studies have highlighted the importance of adoption mandates, especially
in the early stages of exploring the potential of the technology, the importance of these
mandates decreases over time, as perceived benefits and risks related to this technology are
assessed [38].
Thus, the fact is that the adoption of RFID technology has been slower than expected,
mainly because the hype associated with any new information technology (IT) [39] gave
unrealistic expectations to researchers and practitioners [40]. Therefore, it is important
to deepen our understanding of the various factors that determine the adoption of RFID
technology by companies [35].
Although RFID technology brings many advantages over barcoding, it is necessary to
look at its disadvantages. In Article [1], the authors identify a number of risks associated
with the use of RFID, such as the risk of personal data protection and security. They
consider the specific vulnerabilities associated with barcoding and RFID to identify related
attack scenarios and discuss ways to address these risks and attacks [1].
As mentioned in the previous article, in this article [41] the authors are interested in all
aspects of the introduction of RFID technology in business. However, any decision to adopt
an RFID system without a clear and objective analysis of its effectiveness in an uncertain
business environment carries serious risks. This article presents a tool for statistical analysis
of the effectiveness of RFID compared to barcodes [41].
Despite the fact that RFID is making an impact on the world, for this technology’s
sustainability, it is necessary to think about reducing its price tag. Toward this end, scientists
from around the world are working on chip-free RFID systems, though their use is not
appropriate for every sector, as mentioned by the authors in Article [42]. For the purposes
of conducting an examination of the possible application of the barcode and RFID system,
this study focuses on the Thai timber industry, aiming to identify the most favourable
traceability technology as well. The results suggest that RFID is a more advantageous
identification method in terms of efficiency and user acceptability. However, the cost of
an RFID tag should be reduced. Barcodes are not suitable for wood products, at least in
the context of the Thai wood industry, even if they are used for other purposes. RFID, on
the other hand, provides several advantages throughout the supply chain compared to
barcodes and other conventional identification systems [42–44].
The Fourth Industrial Revolution significantly changed the traditional way of man-
aging supply chains. Applications of Industry 4.0 (I4.0) technologies, such as the Internet of
Things (IoT) and artificial intelligence (AI) in various supply chain processes, have helped
companies improve their performance. Procurement can be considered a critical process
in supply chain management, as it can provide new opportunities for supply chains to
improve their efficiency and effectiveness. However, I4.0 applications can be ex-pensive
and may not be reasonably available [45].
Procurement digitization can provide significant opportunities for excellence in ren-
ovation operations. This article [46] focuses on Procurement Resources 4.0 for front-end
applications and core technologies. Based on Resource Based View theory, this researchSustainability 2022, 14, 790 7 of 20
examines the role of resources influencing procurement 4.0 to increase productivity in
renovation operations and the performance of the circular economy. Survey data for this
research was collected from working professionals in South Africa, and the results show
that technological resources are needed in procurement 4.0, which in turn can increase
productivity in refurbishment operations.
The findings of this empirical study [47] suggest that Procurement Strategy 4.0 posi-
tively influences buyer intent to optimize business processes. Second, Procurement Per-
formance Control 4.0 positively affects buyer intent to optimize business processes. Third,
the ability to process information mitigates the impact of Procurement Performance Control
4.0 on buyer intent to optimize business processes. Finally, buyer intention to optimize
business processes plays a key role in improving the performance of the circular economy.
The simulation results demonstrate the potential benefits of Industry 4.0 appli-cations in
the circular economy procurement function.
In this research [48], the authors provide an overview of the system architecture and
also define a protocol and a smart contract at each stage that stores data in a blockchain
center. They implemented a decentralized database and authentication system that uses
blockchain and smart contract technology; each protocol at each stage was designed to
achieve data integrity and undeniable reporting. Their system is more flexible in terms of
transport, more secure in the communication protocol and more difficult to manipulate
and falsify data.
Blockchain technology is basically a decentralized database managed by a team. It has
the characteristics of high reliability and high confidentiality and has good prospects for
an effective solution to the problem of trust between the two parties. In short, block-chain
information will be publicly verifiable and will not be manipulated, which provides solu-
tions for traditional logistics. The proposed scheme also achieves data integrity, resilience,
forward and backward secrecy, undeniability and mutual authentication [49,50].
2. Materials and Methods
The goal of our proposal is to expand the use of barcodes in the unnamed company.
Barcodes facilitate the process of item ordering (cables) that consists of several activities.
Employees use barcodes when picking cables for production and identification of correct
production positions. It affects the entire ordering process.
We will use the current method for receiving cables to the warehouse and storing them
in a specific position on the slotted angle racks. Figure 3 shows the main changes in the
activities of the proposed method.
Figure 3. Sequence of activities in the proposed method of ordering cables. Source: processed
by authors.Sustainability 2022, 14, 790 8 of 20
The process begins by ordering an item from production, where the production worker
writes down the needed material in the specified table. Each material (cable) position in the
factory has such a table. Warehouse workers check the entered requirements in production
according to the schedule. They write down these requirements on a document, according
to which they knows which cable to pick. In the warehouse, they first find the position of
the item in the slotted rack and then load it onto a prepared pallet. Before being ready for
production, workers must scan prepared cables with a scanning device. First, they scantheir
personal barcodes, located on their ID cards. Then they scan the barcode of the workplace
and the movement they want to make with the cable. For example, they scan the barcode
labeled “STORAGE OUT” when picking up the cable. This barcode is in various places in
the warehouse. It is also on a forklift to speed up the work of the warehouse employees.
They then scan the barcode located on the cable reel label. This label is adhered to the cable
when it is received at the warehouse. After scanning the barcode, workers still enter the
amount of cable on the spool. This quantity is indicated on the packaging. Figure 4 shows
the spool label with the barcode.
Figure 4. Scanned barcode on a spool of cable. Source: authors.
Then the employees can move the cable to the specified position in the factory. Before
placing the cable in the correct place, they must scan the cable again. Each position in the
factory has barcode labels. When employees stock an item, they must scan the position
and movement barcode. At the end of the work shift, employees gives the scanner passes
to the warehouse support manager. This person exports the collected data to a prepared
database in Excel and performs a quick check of the data in the database with the help of
preset macros. Based on the data from the database, it is possible to update the data in
the SAP system. The SAP system then automatically evaluates the need to order cables,
which reduces workload. Operational purchasing employees check the generated orders,
set the date, and send them to the customer. We analyzed the main errors that arose during
ordering cables. We also measured the duration of individual activities in the process. We
used this data to design a new way of ordering.
With the current state of the cable ordering process, problems arose, especially with
multi-stage manual recording, checking the current cable balance in the warehouse, and
creating orders. They occurred due to an incorrectly entered balance from the warehouse
or an incorrect quantity order. Based on the analysis of the error rate, we can highlight the
most common errors:
• incorrectly entered balance from the warehouse;
• ordering the wrong quantity;
• error when entering data manually;
• differences between the actual stock balance and the stock level in the SAP system.
Many errors were connected with the incorrect amount of delivered material. Em-
ployees recorded information to the error record table. This information included the date,
the material number of the cable, the number of unnecessary coils, the responsible person,
and notes.Sustainability 2022, 14, 790 9 of 20
Warehouse support managers always send a table with the cables prepared for pro-
duction before the end of the shift. They also write the balance of the item in this table.
Errors can occur when warehouse managers check the cable balance on the rack. They can
make a mistake when rewriting the table to Excel. In this case, the operational purchasing
department has incorrect inputs. The second case can occur if the correct cable balance in
stock is sent for an operational purchase, but an error occurs when evaluating the need for
an order.
Another case is errors that occur when rewriting data in Excel. Employees do not
record these errors anywhere. An error can occur in production, in the warehouse, and
during its recording to Excel. Usually, an error occurs when the material number is incor-
rect. The operational purchasing department usually finds it. Subsequently, warehouse
employees solve the problem; they find out what kind of cable it was.
The current method allows making a difference between the actual cable balance in
the warehouse and the stock level in the SAP system. Responsible employees solve this
problem by checking the stocks once a month and downloading the current state of the
cables in the warehouse and the SAP system. They select the 20 most expensive cables
with differences. According to the physical check of the cables, they adjust the data in the
SAP system.
2.1. Measuring the Duration of Individual Activities in the Process
After analyzing the most common errors in the current method, the time of individual
activities within the cable ordering process was measured. Before the measurement itself,
it was necessary to determine appropriate activities that will be measured in time. The
following activities were selected for measurement:
• registration of a request for documentation;
• picking cables for production
# picking cables on a pallet;
# cable transport;
# placing cables;
# checking (OK);
• rewriting the material for ordering and sending the list for operational purchase;
• copying the list to the cable order and evaluating the order;
• issuing an order in the SAP system.
The measurement was divided into three parts, according to who performed the
individual activities. In the first part, the recording of requirements for documentation
for production and the time of picking cables for production were measured. Due to the
accuracy and usability of the results, the measurement of cable picking into production
was divided into four separate activities, which were measured separately. These activities
are handled by a warehouse workers who write the documentation requirements several
times a day and prepare the cables for production. The measurement lasted for two days
and a total of 4 measurements were performed.
In the second part, the activity of warehouse support managers, who are in charge of
rewriting the material for ordering and sending the list for operational purchasing, was
measured. This measurement was always performed at the end of the work shift within
five days, with five measurements made.
The last part of the measurement was focused the work of operational purchasing.
Four measurements were made over a period of four days. The measurement data were
entered into a pre-prepared form, and then transcribed into and evaluated in Excel. Table 3
shows processed data from the whole measurement of individual activities in the cable
ordering process.Sustainability 2022, 14, 790 10 of 20
Table 3. Measured data of current activities in the cable ordering process.
Number of Duration Time Average
Responsible
Activity Cables of the Required for Duration of
Workplace
(in Pcs) Activity 1 Cable Activity *
Registration of a
request for 26 5 min 43 s 13 s -
documentation
Pallet picking 36 50 min 8 s 1 min 24 s -
Warehouse
Cable transport - - - 1 min 11 s
Cable
36 63 min 30 s 1 min 46 s -
documentation
Enrollment (OK) 41 4 min 48 s 7s -
Rewriting the
material for
ordering and
91 11 min 16 s 8s -
sending the list
for operational
purchase
Copy the list to
the cable order
Operational 74 18 min 15 s -
and evaluate the
purchasing
order
Issuing an order
in the SAP 44 47 min 1 min 4 s -
system
Note: (*) The average duration of an activity is the time calculated as the arithmetic mean of several measurements
of the activity. This activity does not depend on the number of cables.
The measured values are added up for individual days and then model-converted to
one cable. The measured value of cable transport is expressed as the arithmetic average
of the duration of 15 measured cable transports. This activity cannot be expressed on a
single cable because the warehouse workers transport multiple cables at one time. The
number of cables per carriage depends on the size of the cable reel that is placed on the
pallet. The special activities in picking up the cable for production will be the same in the
proposed way. Therefore, after performing the measurement on the proposed method, the
measured data of these activities were added up. The data for these activities are therefore
more accurate and will not affect the results when comparing the current and the proposed
method. Measured data of these activities in Table 4 are expressed over a period of five
days, taking a total of 11 measurements.
Table 4. Conversion of measured data of current activities on one cable.
Responsible Number of Cables Duration of
Activity
Workplace (in Pcs) Activity
Registration of a request for 1 13 s
Warehouse documentation
Picking cables for production 1 4 min 28 s
Rewriting the material for
ordering and sending the list 1 8s
for operational purchase
Operational Copy the list to the cable order 1 15 s
purchasing and evaluate the order
Issuing an order in the SAP
1 1 min 4 s
system
The total time of the cable ordering process 1 6 min 8 sSustainability 2022, 14, 790 11 of 20
In Table 4, the converted data per cable were recorded as well as the total time of the
single cable ordering process.
The process of picking cables for production shown in Table 4 was divided into several
activities for more detailed data. In Table 5 these activities were converted to one cable and
added together. Finally, the total time of the process for ordering one cable was expressed,
which is six minutes and eight seconds.
Table 5. Measured values in the proposed method. Source: processed by authors.
Responsible Number Activity Necessary Time Activity
Department Activity of Cables (pcs) Duration (s) per One Cable (s) Duration * (s)
Registration of a request 26 5 min 43 s 13 s -
Preparation of cables for 36 50 min 8 s 1 min 24 s -
production
Scanning (warehouse) 20 7 min 57 s 24 s -
Cable transport - - - 1 min 11 s
Warehouse
Scanning (production) 20 7 min 21 s -
Cable unloading 36 63 min 30 s 1 min 46 s -
Writing (OK) 41 4 min 48 s 7s -
Download from the scanner - - - 57 s
and copy to database
Working with the database 70 1 min 41 s 2s -
Record in the SAP system - - - 30 s
Operational
Sending an order in the SAP
purchasing - - - 3 min 30 s
system
department
* The average duration of an activity is the time calculated as the arithmetic mean of several measurements. This
activity does not depend on the number of cables.
2.2. Methodology for Time Measurements
We wanted to evaluate time savings when the factory used the proposed method of
ordering cables. Therefore, we measured the duration of activities and then compared
these values to those measured with the previous method. This measuring consisted of
several parts, each representing different activity.
The first part of measurement focused on the work of warehouse employees. As in the
original method, they prepare the cable for production based on production requirements.
We performed seven measurements for operations carried out by warehouse employees
over twenty-three days. Their activities were the same as in the original method, making it
possible to put the results together and calculate one value from 11 measurements over five
days. This can also ensure more accurate results. The proposed method adds scanning to
the work of warehouse employees, which affects the cable preparation for production.
The second part of the measurement focused on the work of warehouse support
managers. They download data from the scanner and update the database at the end of
each shift. They check the data in the database and write down the values from the SAP
system. We measured their activities over six days, with the measured data differing from
the original measurement due to the activity changes of warehouse support managers.
We performed the last part of the measurement in the department of operational
purchasing. Before the changes, its employees evaluated the stocked cables and placed
orders accordingly. With the proposed method, all this is done by the SAP system. It
automatically evaluates the need to order cables after usage in production. Employees only
confirm the automatically generated orders, and sets the date. Then workers can send the
order to the customer. This operation differs from the original method and, when we were
measuring this activity, a problem arose during the test phase on ten selected cables within
the monitored period. All these items were unnecessary in production.
Table 5 shows the measured values of the activities within the ordering of cables in
the proposed method.Sustainability 2022, 14, 790 12 of 20
In our proposal, we added some tasks to the work of warehouse employees. They must
scan cables during preparation as well as after sending the cables to a specific position in
production. The cable transport duration remains the same as in the previous measurement.
When evaluating the results of measuring the work of the warehouse support managers,
we found that there are activities that do not depend on the number of cables. For example,
the steps of downloading from the scanner, copying the data to the database, and working
with the SAP system take as long for one item as for twenty cables. It is a similar case for
operational purchasing, where the ordering in the SAP system does not depend on the
number of items.
For a better comparison, Table 6 shows a model of recalculated data of activities in the
proposed method for one cable.
Table 6. Measured values in the proposed method. Source: processed by authors.
Responsible
Activity Number of Cables (pcs) Activity Duration (s)
Department
Registration of a request 1 13 s
Preparation of cables for production 1 5 min 13 s
Warehouse Download from the scanner and copy 1 57 s
to database
Working with the database 1 2s
Record in the SAP system 1 30 s
Operational purchasing
Sending an order in the SAP system 1 3 min 30 s
department
Total ordering time (proposal) 1 10 min 25 s
We then recalculated the measured data per cable. We found that the duration of the
proposed method is four minutes and seventeen s longer than the original method. In the
proposed method, consisting of three new activities does not depend on the number of
cables. This means that, with more cables, it is possible the proposed method will be much
more efficient.
3. Results
This part of the paper compares the original method of ordering cables to the proposal,
a comparison made through error analysis and time measurement.
Probably the biggest problem with the original way of ordering cables was the emerg-
ing differences between the actual stock balance and the stock level in the SAP system. In
the original method, warehouse workers wrote down the remaining amount of material
after preparing the cable for production. Then the operational purchasing department
received the data of consumption and material balance. After that, they could order the
new material according to the balance in the warehouse. Problems arose when employees
either entered the wrong stock balance or ordered the incorrect quantities based on the
correct stock balance. Another problem was that the multiple manual entries of dataled to
a high risk of mistakes.
In order to reduce the rate of error in their operations, the factory aimed to introduce
entirely new technology into their procedures. Our proposal introduced a new method able
to eliminate the mentioned errors, involving the cable having two positions, storage and
production, and the warehouse support managers writing down the remaining amount of
cables at the end of the shift. The latter is to ensure that the stock level in the SAP system
is equal to the actual stock balance. During the phase of testing if and how the proposed
method would work, and to reveal any unanticipated errors before implementation, em-
ployees still used manual data entry (using ten cables for testing). Starting the test phase
on a single cable consisted of several steps. The scanning device is not connected to the
SAP system, it is necessary to create a simple database in Excel, for the obtained data to beSustainability 2022, 14, 790 13 of 20
stored. Based on this database, the cables will be depreciated from the SAP system and
used to check the correctness of the scan. Based on the data from the database downloaded
from the SAP system, a cable with the sample material number 0612201 is selected for the
turnover testing phase. This cable has the highest turnover. It was ordered 19 times in the
previous year, while the preset amount of cable in one order is 15 000 m. Sometimes there
may be another quantity in the order, usually in cases where the need is higher and the
cable needs to be reordered. In the last step, the barcode scan itself started in the cable
ordering process. When required to provide proof of the selected test cable, the storekeeper
must pick up the cable on a pallet and scan the barcode on the package using a scanner.
Other cables are prepared for production in the original way. Subsequently, before the end
of the change, the head of the support department transfers the data from the scanner to
the computer, copies of the data to the database and writes the given cable from the SAP
system. All other cables will work in the original way. The process of ordering cables using
a barcode is functional, but very impractical, because the storekeeper must be careful not to
forget to select the selected cable. Therefore, this phase will not last long and the process
will be extended to ten selected cables. Testing on ten cables is the last stage before the
design of all cables used. The purpose of this testing is to fine-tune all activities so that
they are ready to run fully. The reason for this between steps is to reveal shortcomings
and problems that were not found when testing on a single cable as well as to resolve
inconsistencies from the previous phase. The actual procedure for starting the test phase
will be similar to one cable and will also consist of several steps.
For the test phase, it is necessary to select the other nine cables that have the highest
annual turnover. The last step is to start the test phase on ten selected cables. In fact, it is a
sharp test before applying the design to all available cables. The warehouse workers will
scan all cables, regardless of which ones have been selected for testing. After downloading
the data from the scanner, the warehouse managers will distinguish which cables need to
be sent for the operational purchase and which need to be written off from the SAP system.
In the testing phase, it is necessary to monitor the progress of the entire process and record
all errors and problems that occur during the process. These will be the basis for further
design development in the cable ordering process.
Due to the lack of data in the original method, we could not compare the error rate
with our proposal. During testing after technological changes, only seven errors occurred.
The test process took six days (142 performed scans). The error rate after the first six days
of use was 4.93%.
We have divided the measurement of the individual activities into three parts. Some
activities are the same in both methods, which means that the introduction of our proposal
does not change them. Therefore, we have calculated an average value. In the proposed
process, scanning has been added to the duties of warehouse workers. It was necessary to
measure this activity. However, there are activities that no longer depend on the number of
cables. We have expressed the duration of these activities as the average time from several
measurements.
We have recalculated the measured data to one cable. On average, the factory uses
17 cable spools in one day. Table 7 compares the values of the original cable ordering
method and the proposed method.
Table 7 shows values recalculated to one cable. The duration of the proposed method
is longer by 4 min and 17 s. The right side of the table shows values of the processing of
17 cables (the average number per day). We have measured the time of transportation and
other preparation activities separately. It is not possible to recalculate the time of transport
to one cable. Warehouse workers can transport several cables at once. The number of cables
per carriage depends on the size of the cable spool. Warehouse workers usually transports
6 to 10 cable spools at a time. In our calculations, we have supposed that they transport
only six cable spools during one transport. It means that 17 cables need three rides. The
average cable transport takes 1 min 11 s. The recalculation of the picking of 17 cables for
production was therefore as follow:Sustainability 2022, 14, 790 14 of 20
• original method = (3 min 17 s × 17) + (1 min 11 s × 3) = 59 min 23 s
• proposed method = (4 min 2 s × 17) + (1 min 11 s × 3) = 1 h 12 min 7 s
The calculation of the average number of picked cables per day shows a time saving of
6 min and 23 s per day. This time saving arises thanks to the activities that do not depend
on the number of cables. The proposed method of ordering cables is valuable with larger
orders. If the production needs 17 cables per day, we can calculate timesaving for:
• one week 31 min and 55 s;
• one month 2 h, 7 min, and 40 s.
Table 7. Comparison of measured data of the original and the proposed method. Source: processed
by authors.
Responsible Duration
Ordering Method Activity
Department 1 Cable 17 Cables
Registration of a request 13 s 3 min 41 s
Warehouse Preparation of cables for production 4 min 28 s 59 min 22 s
Download data from the scanner and
Original
sending to operational purchase 8s 2 min 16 s
department
Copying data list to order and order
Operational purchasing 15 s 4 min 15 s
evaluation
department
Sending an order in the SAP system 1 min 4 s 18 min 8 s
Total time of cable ordering process 6 min 8 s 1 h 27 min 42 s
Registration of a request 13 s 3 min 41 s
Preparation of cables for production 5 min 13 s 1 h 12 min 7 s
Warehouse Download from the scanner and copy to
57 s 57 s
Proposed database
Working with the database 2s 34 s
Record in the SAP system 30 s 30 s
Operational purchasing
Sending an order in the SAP system 3 min 30 s 3 min 30 s
department
Total time of cable ordering process 10 min 25 s 1 h 21 min 19 s
We propose to increase the use of barcodes in the company. This company has already
established barcode technology, but intelligent solutions can ensure the modernization and
further development of the company. The proposal elaborates the process of changes, error
analysis, and measurement of the duration of individual activities. Barcode technology
was implemented into the process gradually, using two test phases.
We have performed the first phase on a single cable after thorough preparation. First,
we created a simple database in Excel to store the data collected from the scanner. It was
also necessary to prepare technical equipment. The company bought a scanning device to
collect the scanned data. It was also important to mark the warehouse workplace with a
bar code. The last task was to flip the selected cable to two positions in the SAP system. We
also performed the second testing phase on another nine spools of cable. Again, several
preparatory steps were necessary. We modified the database due to the larger data volume.
Macros and other functions in Excel make this step faster. Due to increased inspection, we
have marked each position in production with a barcode. Subsequently, we have flipped
selected cables into two positions in the SAP system. This test was the last stage before
implementing the proposed method on all available items. During the test, warehouse
workers scanned all cables when picking. Subsequently, warehouse support managers had
to distinguish two types of items. The first group was cables ordered via SAP system, and
the second was cables sent for operative purchasing (original method).
We also prepared a detailed analysis of the error rate and duration of activities in the
factory. Then we could compare the original way of ordering cables with our proposal.
We have eliminated almost all mistakes and problems that arose in the original methodSustainability 2022, 14, 790 15 of 20
with barcode technology. Flipping the cables to two positions in the SAP system resolved
the emerging differences between the actual stock balance and the stock level in the SAP
system. Our proposal partially resolved multiple manual data entries with a high risk of
error. For some activities, however, warehouse workers must still manually enter the data
into the prepared form. In the future, we can also resolve this problem by introducing the
pull-out principle from production via the SAP system. We could not express the exact
error rate in the original method due to a lack of data. However, we can determine the error
rate in the proposed process. During the six days after the test phase, employees performed
142 scans with seven errors. Errors occurred due to incorrect scanning and subsequent
incorrect database settings. The error rate after the first six days of use was 4.93%.
After the introduction of the proposed method of ordering cables, the error rate
was also monitored, which was recorded and evaluated every day. The error rate was
checked every day after downloading data from the scanner in the database. Data are only
available for the first six days of use to prepare and evaluate the analysis. In the company,
monitoring and evaluation of error rates will continue, as this is one of the basic indicators
when introducing a new proposal. When monitoring the error rate, errors were formulated
that occurred or may still occur in this way. The following basic errors were made:
• scan error—incorrectly entered length;
• scanning error—writing in the wrong field;
• scan error—no input or output scan;
• scanning error—the same operation scanned 2 times;
• incorrectly ordered cable quantity;
• database error.
When checking the data in the database, it may happen that there is a difference
between the agreed and the actual amount of cables. The reason is that the company that
supplies the cables does not always send the exact and agreed amount of cable on the spool.
In this case, the storekeeper enters the quantity that is on the package during the scan, and
during the subsequent check in the database, the difference between the quantity actually
scanned and the quantity that was agreed upon is marked. The agreed number of cables
from the SAP system is generated in the database for inspection. This difference will not be
considered a mistake, as this problem also occurred in the original way and is not related to
the introduction of barcode technology into the process. The reason for this error may also
be an incorrectly ordered amount of cable. Since only 10 cables are currently being tested
under the proposed method, the other cables are ordered in the old way. This means that
the need to order a cable must be evaluated in an operational purchase. Once the proposed
method has been implemented on all cables, this error will no longer occur because the
need to order a cable will be automatically generated by the SAP system. Excel database
errors can also be a problem. Some macros and formulas may not always work correctly,
or some material numbers may not have an agreed number of cables. This means that the
control will not work.
Another group of errors are warehousing errors when scanning barcodes on cables.
Warehouse workers may enter the wrong cable length or inadvertently scan the data into
another field. Warehouse workers scan the cables when picking them up for production,
but also before documenting the cables in the specified position. Just by double-scanning
the cables, this error rate could be minimized. Nevertheless, the warehouse workers may
forget to scan the cables, either when picking or documenting the cables for production.
Alternatively, it accidentally scans the cable twice.
First, we measured individual activities with the original method. We performed
13 measurements in 11 days. After the introduction of the proposed method, we performed
another 13 measurements for nine days. The measurement data were then processed and
evaluated in tables. For better comparison, we calculated the time required for one cable. It
was necessary to determine the average number of used cables per day to find out how
much time the company will save per day. On average, production sends 17 cables per day.
We calculated with 17 cables and then compared time savings (Table 8).Sustainability 2022, 14, 790 16 of 20
Table 8. Comparison of total time of cable ordering process. Source: processed by authors.
Total Time of Cable Ordering Process
Ordering Method
1 Cable 17 Cables
Original 6 min 8 s 1 h 27 min 42 s
Proposed 10 min 25 s 1 h 21 min 19 s
Difference 4 min 17 s 6 min 23 s
4. Discussion
Barcoding is a technology that is currently one of the most used technologies on the
market of Slovak manufacturers, logistics companies and, last but not least, distributors. It
results from its affordability. It also offers easy implementation within the entire logistics
chain. If we consider the speed and possibility of processing a large amount of data, RFID
technology is better. Currently, RFID is used only in companies that need to process a large
amount of information. The barcode technology is used in smaller companies because it
is more affordable. We should mention that barcodes have possible limitations in terms
of visibility, accessibility, processing quality, readability, and delays in barcode processing.
The RFID technology can avoid these disadvantages. It is possible to process more RFID
tags in one moment without direct visibility. It is not yet possible to read the RIFD tag in
liquid or on any metal. We cannot forget that RFID technology installing requires technical
and technological equipment. It is essential to have experience with the implementation
of this technology in the entire logistics chain. The advantage of RIFD in one department
of the company is debatable if other departments will not adapt to it and accept these
technical and technological means.
Radio Frequency Identification Technology was developed as a suitable alternative to
barcode applications. These two technologies complement each other. Despite the spread
use of RFID, many factories still use barcodes [1,2].
Compared to a barcode, RFID has a higher scanning speed and lower operator require-
ments, so it is easy to apply in automated systems. The big difference is that the barcode
needs direct visibility between the code and the scanner to scan it. Scanning is, therefore,
more damning for the operator who orients the barcode to the scanning device. RFID tech-
nology does not require direct visibility between the tag and the reading device. Therefore,
the reading device can scan all RFID tags which are within range. Another difference is
that the barcode scanner uses a laser or other optical sensor. RFID reads information from
the tags via radio frequency waves. Due to low label prices and established standards,
barcode technology is significantly widespread. RFID technology is used only in some
specific cases [2].
The basic differences between the barcode and RFID technology are summarized in
Table 9.
Table 9. Basic differences between barcode and RFID. Source: [1].
Evaluated Properties Barcode RFID
Coding by color contrast
Coding between vertical lines and Coding in electronic form
spaces
Time Scanning takes a few minutes Scanning takes a few seconds
Scanning May not load or scanned twice It cannot be unloaded or duplicated
Information on the type of product,
Information on the type of packaging, production date, origin,
Information
product price of the product, date of
dispatch and consumption
Visibility Direct visibility Does not have to be direct visibilityYou can also read