Impact Score 2022 - 26 Strategy Period - CDC Group
←
→
Page content transcription
If your browser does not render page correctly, please read the page content below
Impact Score
2022 – 26 Strategy Period

01                                                                                                         Contents
                                                                                                           01 Our approach to impact
                                                                                                              management                              2
Our approach to impact management
                                                                                                           02 Role and design of the Impact
As an impact-led organisation, we have set three strategic development
                                                                                                              Score3
impact objectives that respond to the opportunities and challenges we see in
the countries we serve: to make investments that are productive, sustainable,                              03 Calculating the score                   5
and inclusive.1 We manage our activities around delivering those strategic                                    3.1 Productive score                    6
objectives, and seek to maximise them throughout the investment lifecycle. It
                                                                                                              3.2 Sustainable score                   7
starts with the way we set strategies to invest in sectors and regions, then in
finding investment opportunities and deciding what to invest in, through to                                   3.3 Inclusive score                     8
structuring our investments and managing our portfolio, and finally to                                     4. Scoring based on actual
responsible exits and evaluations.                                                                            performance9
Our approach to impact management is grounded in the Operating Principles                                  Annex A: Inclusive –
for Impact Management (OPIM) (see Figure 1 below), of which we are a                                       country default score list                 10
founding signatory. At the heart of our approach sits our overarching Impact
Framework, which draws on the five dimensions of impact defined by the                                     Annex B: Productive –
Impact Management Project. This framework shapes how we assess the                                         list of needs and indicators               11
expected impact of individual investments, as summarised in our Impact
Dashboards, when taking investment decisions; how we assess the difference
we are making as an investor; and how we monitor and manage their impact
performance after investment.

                                           Origination &        Portfolio
     Strategic Intent                                                                  Impact at Exit
                                            Structuring        Management

       1                               3                      6                        7
    Define strategic                 Establish the          Monitor the              Conduct exits
    impact objective(s)              manager’s              progress of each         considering the
    consistent with                  contribution to the    investment in            effect on sustained
    the investment                   achievement of         achieving impact         impact.
    strategy.                        impact.                and expectations
                                                            and respond                8
        2                              4                    appropriately.
                                                                                     Review, document,
    Manage strategic                 Assess the expected                             and improve
    impact on a                      impact of each                                  decisions and
    portfolio basis.                 investment, based                               processes based on
                                     on a systematic                                 the achievemnt of
                                     approach.                                       impact and lessons
                                                                                     learned.
                                       5
                                     Assess, address, monitor and manage potential
                                     negative impacts of each investment.

                                              Independent Verification

       9
    Publicly disclose alignment with the Impact Principles and provide regular independent
    verification of the alignment.

Figure 1: The Operating Principles for Impact Management

                                                                                                           CDC is changing its name to
1 For more information about the implementation of our strategic impact objectives see our Technical
  Strategy document, and for the rationale behind these objectives sees The Economics of Development       British International Investment plc
  Finance, both available on our website.                                                                  on 4 April 2022.

2 0 2 2 - 2 6 S T R AT E G Y P E R I O D                                                                                        I M PA C T S C O R E    2
02
Role and design of the Impact Score
For our 2022-2026 strategy period, we have developed an Impact Score as a tool
for ‘managing strategic impact on a portfolio basis’, which is the second
principle of the OPIM. The Impact Score is designed to recognise and
incentivise investments that are likely to contribute most to our three
strategic impact objectives. It complements our more detailed assessments of
the expected impact of individual investments, by providing a quantitative
metric that can be aggregated and used to monitor and analyse strategic
impact performance across the portfolio. It is calculated using a subset of the
information found in the Impact Dashboards and monitoring plans. These
Impact Dashboards remain the primary tool we use to make individual
investment decisions.
The Impact Score replaces our Development Impact Grid which we have used
since 2012, as one of the key performance indicators reported to our
shareholder, the Foreign, Commonwealth & Development Office (FCDO). As a
performance indicator, its design favours objectivity and simplicity. More
nuanced and qualitative aspects of the expected development impact of
investments, which require subjective judgment to interpret, such as an
investment’s expected ‘depth’, ‘risk’ and ‘contribution’, are excluded from the
Impact Score but remain central to our investment decisions and impact
management, and are captured in our full assessments of the expected impact
of individual investments.

2 0 2 2 - 2 6 S T R AT E G Y P E R I O D                                          I M PA C T S C O R E   3

The Impact Score’s design features include:
– Portfolio tool: Individual scores are aggregated at the portfolio level into
  an ‘Aggregate Impact Score’ (a weighted average of individual impact
  scores for all investments committed to from 2022 onwards). We will
  generate and report an Aggregate Impact Score, which we expect to range
  between four and eight during the 2022-26 period. We are accountable to
  our Board and FCDO for performance against the Aggregate Impact Score,
  and we will publicly report on it in our Annual Review, as external scrutiny
  is an important part of the model. This is a portfolio performance measure
  and there is no minimum threshold score requirement for individual
  investments, which reflects the fact that it is designed to be ‘right on
  average’ across the portfolio. The approach also allows us to take a
  balanced approach to constructing our portfolio, where we are also
  required to meet annual investment return targets.
– Predictable: The Impact Score is designed to be intuitive and easy to
  calculate from the early stages of originating investment opportunities, to
  be most effective at providing our investment teams with the clarity they
  need to prioritise their activities. The Impact Score would not effectively
  influence investment behaviour if it only emerged from a ‘black box’ at the
  final Investment Committee stage.
– Pragmatic: The Impact Score is designed to adapt to the level of
  information we have available, which varies across products, sectors, and
  the stage of the investment process. Various ‘default’ assumptions can be
  used to calculate the Score where more granular information is not
  available.
Every investment we make will have an associated Impact Score which is based
on the expected development impact of the investment (ex-ante). The score for
each investment will also be updated over the lifetime of the investment at
regular intervals, based on the actual impact performance (ex-post).
The Aggregate Impact Score is also used to partially determine staff
remuneration, under our Long-Term Incentive Performance Plan, another
reason that the score is designed as a simple and objective measure.

2 0 2 2 - 2 6 S T R AT E G Y P E R I O D                                         I M PA C T S C O R E   4
03
Calculating the score
Every eligible investment will receive Productive, Sustainable, and Inclusive
scores. The sum of the three scores will result in a Total Impact Score, which
can range from -1 to 10. 2
– Productive score: reflects how efficiently an investment addresses the
  biggest developmental needs, and the extent to which the investment is
  expected to have positive spillovers onto the productivity of other firms. It
  ranges from 0 to 4.
– Sustainable score: reflects to what extent the investment will contribute
  to the transition to net zero and climate-resilient economies. The score
  depends on whether and to what extent the investment qualifies as
  climate finance3 . If qualifying, an investment is scored according to its
  contribution to climate mitigation, adaptation and resilience. If not, it is
  scored on greenhouse gas (GHG) emissions and contribution to climate
  adaptation and resilience. It ranges from -1 to 4.
– Inclusive score: captures who is directly benefitting from the investment,
  using either known characteristics of workers and customers (initial income,
  gender and ethnicity), or a default country score. It ranges from 0 to 4.

       Impact
        score

    What does
                     =            Productive
                                    score

                             Raising the
                                                    +    Sustainable
                                                            score          +
                                                       Helping transform the
                                                                                     Inclusive
                                                                                       score

                                                                                 Sharing the
    this mean?               productivity of an        economy to reduce         benefits of higher
                             economy so that it        emissions, protect        productivity and
                             can support a decent      the environment and       greater sustainability
                             standard of living        adapt to the changing     with poor and
                             for all.                  climate.                  marginalised sections
                                                                                 of society.

    How will we              1.   Degree of need       1. Climate mitigation     1. Reach to low-
    measure it?              2.   Intensity            2. Climate adaptation        income populations
                             3.   Economic enablers       and resilience         2. Poor and fragile
                             4.   Catalysing markets                                countries
                                                                                 3. Gender and
                                                                                    diversity

2 While the sum of the Productive, Sustainable and Inclusive scores can in theory be greater than 10, the
  total score will be capped at 10 by design given these opportunities are extremely rare
3 Our climate finance methodology uses the Common Principles for Mitigation Finance Tracking and the
  Common Principles for Adaptation Finance Tracking used by the Multilateral Development Banks (MDBs)

2 0 2 2 - 2 6 S T R AT E G Y P E R I O D                                                                    I M PA C T S C O R E   5
3.1 Productive score
The Productive score is constructed from four elements. The first two elements
are combined to generate a base score of 0 to 4; the second two award additional
points to a maximum of 4.
1. The relative degree of need which the investment will address. The primary
need selected for scoring purposes must be central to and consistent with
the impact thesis presented in the Impact Dashboard. Eligible needs are
linked to the Sustainable Development Goals and either improve people’s
quality of life directly, such as through higher incomes, food security,
healthcare, or directly by producing outputs that have proven large-scale
positive economic spillovers, such as power, transport and logistics,
financial services for businesses. For each need, a score is assigned to
countries based on a relative gap assessment: countries where the need is
greater will have a higher score. Investments that operate in multiple
countries are scored by a regional weighted average. See Annex B for the
full list of needs and indicators.
2. The intensity at which the investment delivers the impact. This captures
how efficient the investment or company is in delivering impact compared
to relevant benchmarks. Benchmarks for different sectors are built from
available data sources, including both our own investments and other
market level information. Default ‘in line with benchmark’ intensity scores
will be used where no suitable benchmarks are available, and intensity will
be considered immaterial where our investment does not result in additional
impact.
3. Economic enablers. Investments will receive an additional point where they
produce inputs that are required by many other firms; where there is
evidence that reducing the price or increasing the quality of these inputs has
a significant impact on the growth of firms; and where the impact case rests
on these effects.
4. Potential to catalyse markets. Additional scores will reward investments
that have the potential to improve market structures and the behaviours of
other market actors by increasing competition, pioneering new business
models that can lead to replication by others, reinforcing demonstration,
building skills and human capital, or improving the enabling environment.
The impact thesis of such investments typically materialises only in the
medium to long term – and relevant benchmarks may not yet exist – and we
want to recognise the transformative potential.
Intensity
Productive score elements Relative Below In line with Above
need Immaterial benchmark benchmark benchmark
Degree of need Default score based on country relative degree
oF need and ‘in line with benchmark’ intensity Low 0 0 1 2
Intensity (compared to Adjust for above/below benchmark or Medium 0 1 1 2
other sector benchmarks) immaterial intensity
High 0 1 2 3
Economic enablers +1 point over score
Very high 0 2 3 4
Catalysing markets +1 or +2 point(s) over score
Default score without any additional
Figure 2: How the Productive score works in practice information on the investment
2 0 2 2 - 2 6 S T R AT E G Y P E R I O D I M PA C T S C O R E 63.2 Sustainable score
The Sustainable score aims to incentivise investments that contribute the most
towards the transition towards net zero and climate-resilient economies. These
investments should be creating impact by facilitating the transition to net zero
through avoiding, reducing or sequestering GHG emissions (mitigation); as well
as strengthening the adaptative capacity and building the climate resilience of
people, business, physical and natural assets, and economies to acute and
chronic physical climate risks.
Design of the Sustainable score
The Sustainable score depends on whether and to what extent an investment
qualifies as climate finance. Non-climate finance investments are scored based
on GHG emissions (mitigation) and can be awarded an additional point for
meeting adaptation and resilience (A&R) finance qualification. Climate finance
investments qualify based on our climate finance methodology and are scored
on GHG emissions avoided (renewable energy), reduced (energy efficiency), or
sequestered (forestry), general contribution to mitigation objectives, or on their
A&R finance qualification. The visual below provides an overview on the
Sustainable scoring.
-1 0 1 2 3 4
Non/partial climate finance Climate finance
• Fossil fuel • High emissive • High emissive • Low emissive • Climate finance • Climate finance
infrastructure sectors in line sectors sectors that investments investments with
Examples
• High emissive with sector significantly demonstrate high intensity
sectors pathway below sector significant
significantly pathway emissions
above sector • Low emissive intensity
pathway sectors reduction
• Partial mitigation
Emission
Default score -1 if Renewable
Fossil fuels4 Default score 3 avoidance
≥50% fossil fuels energy
intensity
Default score 0
High
• Ex-post only: these could get +1 or -1 based on Paris-aligned Energy ≥40% improvement
emissive Default score 3
sector pathways or qualitative/quantitative criteria (based on efficiency for buildings
sectors
actual emissions)
Mitigation
Default score 1 • Natural forestry
Low • Ex-post only: these could get +1 for • For plantations
emissive good performance against qualitative/ Forestry Default score 3 with high
sectors quantitative criteria (based on actual annual carbon
emissions) sequestration
Other
Default score 2 mitigation
Partial • N/A until
Partial climate finance
climate Default score 3 benchmarks are
mitigation finance (incl.
finance established
(30-60%) circular
economy)
& resilience
Adaptation
+1 over default score based on ≥10% in Default 3 if ≥30% in ≥50% in A&R
A&R finance A&R finance finance
≥10% fossil fuels ≥50% high emissive
Intermediated
(fund investments) sectors Ex-post only: if 10-
≥20% fossil fuels 5-20% fossil fuels ≥50% low emissive 30% in climate Default 3 if ≥30% in ≥50% in climate
(financial (financial sectors finance (fund climate finance finance
institutions institutions investments)
investments) investments)
Figure 3: How the Sustainable score works in practice
4 The vast majority of new investments in the fossil fuel value chain are excluded as per our
Fossil Fuel Policy.
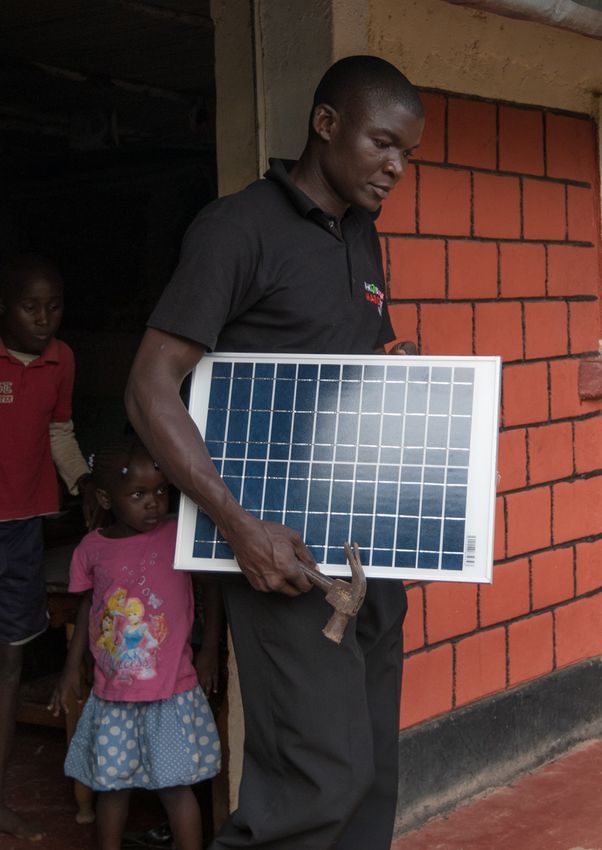
2 0 2 2 - 2 6 S T R AT E G Y P E R I O D I M PA C T S C O R E 73.3 Inclusive score
The Inclusive score is based on the profile of the stakeholders that the
investment is expected to positively benefit. We consider inclusion across
three dimensions: cross-country inequality, within-country inequality, i.e.
reach to lower-income members of society, and reaching or empowering
otherwise excluded groups, namely women and black African business
owners and leaders.
Design of the Inclusive score
– Reach to low-income populations. Where stakeholder characteristics are
known, and reaching these stakeholders is central to the impact thesis,
scores are determined by percentage of stakeholders reached living below
$5.50/day (a poverty line based on consumption measured in Purchasing
Power Parity dollars, maintained by the World Bank). These stakeholders
could be customers, employees or suppliers, but the score will only consider
the key stakeholder group corresponding to the intended impact of the
investment. Evidence to support our assessment of the poverty level of
expected stakeholders can be obtained through surveys or based on a set
of approved proxies. The maximum direct reach score is 4.
– Alternatively, default country scoring is used when micro data about the
poverty level of key stakeholders is not available. This will usually be the
case when the investment thesis is based on the effects of “economic
enablers” on productivity across a market or region. These scores are based
on ranking countries according to the poverty gap, GDP per capita and
fragility measures (see Annex A for the full list). Where an investment is in
multiple countries, the score will be determined by the average of the
investment’s reach weighted by the most relevant metric (jobs, revenues,
use of proceeds etc). The maximum default country score is 3.
– Gender and diversity. Additional point(s) can be awarded for investments
that meet these criteria. We use the 2X Challenge criteria to determine
which investments enhance women’s economic participation, and have
developed similar criteria to recognise black African business ownership
and leadership. These points are awarded in addition to the poverty level or
default country score (one point for each qualification) to a maximum of 4.
0 1 2 3 4
‘Delta’ ‘Gamma’ ‘Beta’ ‘Alpha’
Default country score countries countries countries countries
or
Reach to low-income populations No/negligible 5-15% reach to 15-30% 30-50% >50%
(if known or can be estimated) low income
Gender and diversity based on 2X
+ qualification and/or black African +1 point over score (for each qualification)
ownership and leadership
Figure 4: How the Inclusive score works in practice
2 0 2 2 - 2 6 S T R AT E G Y P E R I O D I M PA C T S C O R E 804 Scoring based on actual performance All investments will be re-scored at regular intervals to track whether they are performing against their original thesis. Scores can remain constant or move up or down depending on performance. A re-score will automatically be triggered at exit. Each investment has a monitoring plan that is tailored to its impact thesis as outlined in the Impact Dashboard. For instance, the ‘intensity’ component of the Productive score is based on a forecast impact metric at relevant time horizons, and this element of the score will be recalculated periodically, based on observed delivery. Other elements of the score that are amenable to rescoring based on new information include the geographic split for investments through fund managers, or elements of the Sustainable score that are tied to quantifiable thresholds. 2 0 2 2 - 2 6 S T R AT E G Y P E R I O D I M PA C T S C O R E 9
Annexes

Annex A: Inclusive – country default score list

                                      • Uses 3 indicators: Poverty Gap @ $5.5, GDP per capita (current PPP), OECD Fragile
                                      • Methodology: Poverty Gap and GDP per capita (PPP) normalised using z-scores, then
   Methodology                          added. Categories drawn using larger gaps in the distribution.
                                      • Fragile countries (OECD) moved to Beta where otherwise lower, extremely fragile
                                        countries (OECD) moved to Alpha where otherwise lower

                                                        South Sudan        Guinea-Bissau       Sierra Leone        Rwanda
                                                        Burundi            Liberia             Tanzania            Zambia
                                                        Somalia            Eritrea             Chad                Mozambique
                                      ‘Alpha’           Central African    Niger               Mali                Madagascar
                                      Default score 3
                                                        Republic           Togo                Benin               Afghanistan
                                                        Congo, Dem. Rep.   Malawi              Sudan               Haiti
                                                        Congo, Rep.

                                                        Burkina Faso       Kenya               Djibouti            Cambodia
                                                        Uganda             Senegal             Mauritania          Lao PDR
                                                        Zimbabwe           Lesotho             Bangladesh          Papua New Guinea
                                                        Angola             Cameroon            Pakistan            Solomon Islands
                                      ‘Beta’            Nigeria            Cote d’Ivoire       Myanmar             Micronesia
                                      Default score 2
                                                        Sao Tome and       Comoros             Libya               Vanuatu
                                                        Principe           Gambia, The         Equatorial Guinea
                                                        Ethiopia           eSwatini
                                                        Guinea
          Output
                                                        Nepal              Namibia             Philippines         Kiribati
                                                        India              South Africa        Timor-Leste         Tuvalu
                                      ‘Gamma’           Ghana              Eqypt, Arab Rep.    Belize              Marshall Islands
                                      Default score 1
                                                                           Cabo Verde                              Samoa
                                                                                                                   Tonga

                                                        Morocco            Mauritius           Indonesia           Dominica
                                                        Botswana           Sri Lanka           Thailand            Dominican
                                                        Bhutan             Gabon               Malaysia            Republic
                                                        Tunisia            Maldives            Vietnam             Grenada
                                                        Algeria            Seychelles          Fiji                Guyana
                                      ‘Delta’                                                  Nauru               Jamaica
                                      Default score 0
                                                                                               Palau               St Lucia
                                                                                                                   St Vincent and the
                                                                                                                   Grenadines
                                                                                                                   Suriname

 Three eligible geographies in the Indo-Pacific (Niue, Tokelau and Wallis & Futuna) are not classified in World Bank income
 groups and data availability is limited. These countries will be scored using the regional average.

2 0 2 2 - 2 6 S T R AT E G Y P E R I O D                                                                             I M PA C T S C O R E   10
Annex B: Productive – list of needs and indicators
We have segmented needs and identified indicators for each to assess the degree of need for the Productive score. The
preference was for a single indicator or index from an external, independent source which captured the relative degree
of need wherever possible – in some cases, we have created indices to combine several indicators.
Need SDG Gap assessment indicator Source
Jobs and economic Index of: 1) wage and salaried workers as a % of total
ILO/World Bank
opportunities employment, and 2) poverty gap at $5.50/day
Concern Worldwide/
Food security Global Hunger Index
Welt Hunger Hills
Healthcare UHC service coverage index UN SDG
Education Learning adjusted years of schooling World Bank
Water Population using at least basic drinking water services WHO
Combined proprietry index: 1) access to electricity, 2)
Power access (consumers UN SDG/International
energy consumption per capita, and 3) proportion of
and businesses) Energy Agency/WB
electricity from a generator
Index: 1) Logistics Performance Index (quality of trade
Transport and logisitcs and transport-related infrastructure), and 2) passenger World Bank/ UN SDG
travel by road and rail per capita (passenger km)
Housing/Real estate Urban population growth World Bank
Proportion of adults (15 years and older) with an
Financial services for
account at a financial institution or mobile-money- Findex
consumers
service provider
Financial services for MSME finance gap as % of GDP and domestic credit to
World Bank/IFC
SMEs private sector (% GDP)
Financial services for
business and capital Domestic credit to private sector (% GDP) World Bank
market development
World
Information and
ICT Development Index Telecommunications/ICT
communications services
Indicators Database
Industrialisation and Index: manufacturing value added (% of GDP) and
World Bank
economic complexity economic complexity
Economic productivity Productivity Capacity Index UNCTAD
2 0 2 2 - 2 6 S T R AT E G Y P E R I O D I M PA C T S C O R E 11CDC is changing its name to British International Investment on 4 April 2022
You can also read