Impact of the US Housing Crisis on the Racial Wealth Gap Across Generations - JUNE 2015
←
→
Page content transcription
If your browser does not render page correctly, please read the page content below
Impact of the US
Housing Crisis on the
Racial Wealth Gap
Across Generations

By Sarah Burd-Sharps and Rebecca Rasch

                         SOCIAL SCIENCE RESEARCH COUNCIL

                         An Independent Report Commissioned
                         by the American Civil Liberties Union

                                         JUNE 2015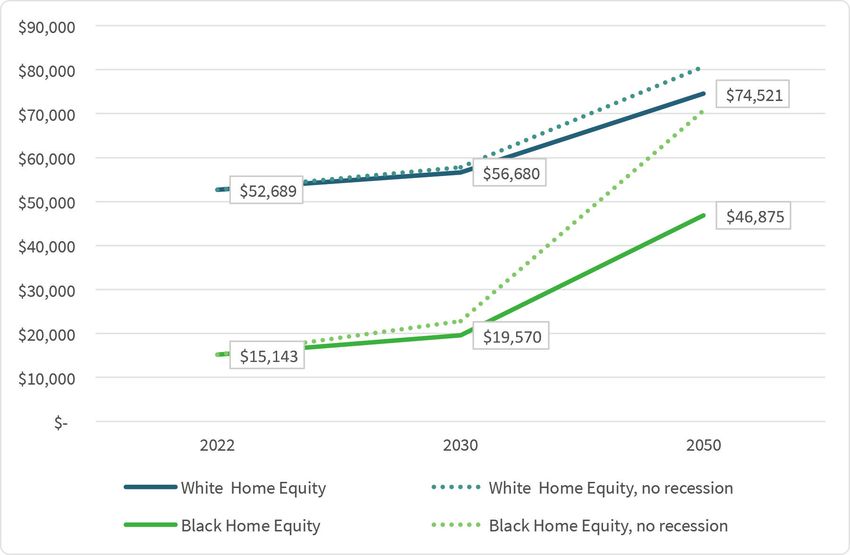
The Social Science Research Council        For nearly 100 years, the American Civil

(SSRC) is an independent, international,   Liberties Union (ACLU) has been our

nonprofit organization founded in 1923.     nation’s guardian of liberty, working in

It fosters innovative research, nurtures   courts, legislatures, and communities

new generations of social scientists,      to defend and preserve the individual

deepens how inquiry is practiced within    rights and liberties that the Constitution

and across disciplines, and mobilizes      and laws of the United States guarantee.

necessary knowledge on important           With more than a million members,

public issues.                             activists, and supporters, the ACLU fights

                                           nationwide for the principle that every

                                           individual’s rights must be protected

                                           equally under the law.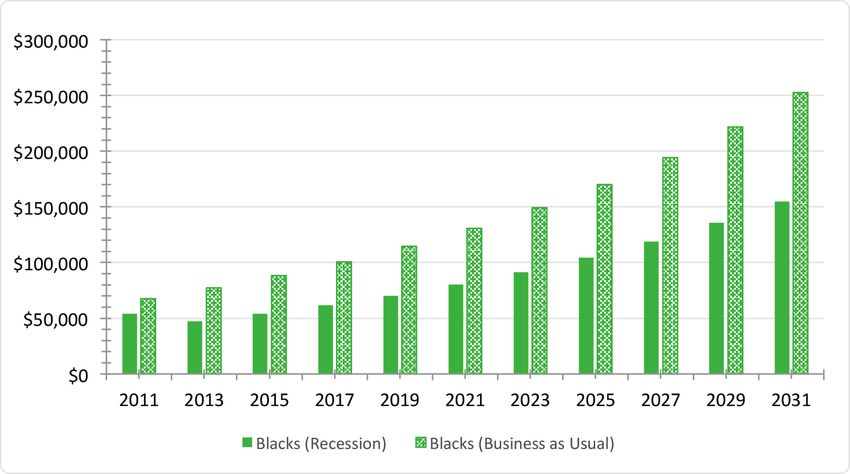
About the Report
Beginning in 2013, the SSRC has collaborated with the ACLU to provide

autonomous research as a contribution to a sound evidence basis on topics

on the ACLU agenda. This editorially independent report presents the results

of a quantitative study designed to explore how discriminatory lending

practices might affect the intergenerational transfer of wealth.

About the Authors
Sarah Burd-Sharps is codirector of Measure of America, a project of the Social

Science Research Council that provides easy-to-use yet methodologically

sound tools for understanding the distribution of well-being and opportunity

in America. Rebecca Rasch is Measure of America’s senior project manager,

conducting both quantitative and qualitative research and analysis.

                      Report designed by: visionandcode.com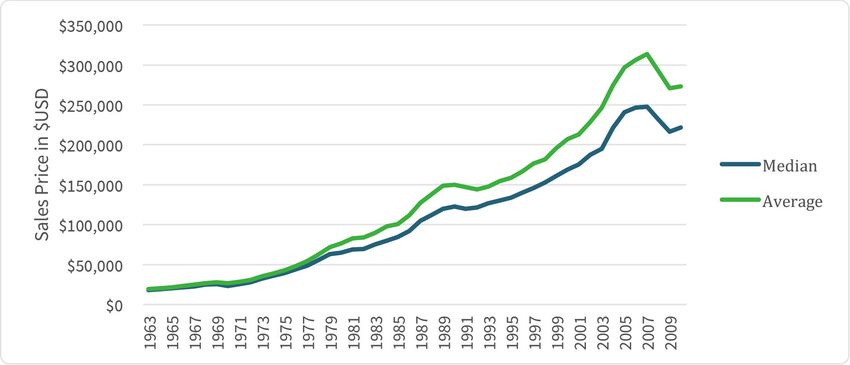
CONTENTS
01
Executive Summary

06
Introduction

09
Changes in Wealth and Home Equity
from 1991 to 2011

15
Forecasting Future Disparities

20
Impacts on Home Equity Values of the
Next Generation

24
Conclusion and Policy Implications

28
Notes

29
Bibliography
Executive Summary
The causes and consequences of the subprime boom, housing market collapse, and financial crisis
hold tremendous significance for policymakers and activists seeking to ensure a strong and fair
economy. Coming out of the Great Recession, one of the most pressing economic problems is the
widening racial wealth gap. In the lead-up to the financial crisis, economic opportunity remained
deeply unequal across racial lines, but economic trends suggested that America was on a path
toward narrowing the yawning wealth disparities between white and black families. Deeply rooted
economic inequality, however, fueled some of the most harmful lending practices, allowing financial
institutions to engage in discriminatory and predatory lending that accelerated the financial collapse.
Looking back, it is clear that racial discrimination played a pivotal role in the housing market crash.

This report looks forward. It examines the likely effect of the financial crisis on the racial wealth gap for
the next generation. What it uncovers is a tale of two recoveries: among families that owned homes,
white households have started to rebound from the worst effects of the Great Recession while black
households are still struggling to make up lost ground. The divergent recoveries are important in the
immediate term, but they are also an especially ominous sign for the future. Unequal opportunity
to rebuild wealth coming out of the crisis is leading to widening racial disparities. The racial wealth
gap, in other words, is now on track to compound over time. This trend has urgent implications
for the future of racial justice in America, and it should inform policymaking strategies aimed at
guaranteeing fair economic opportunities in the coming years.

This report analyzes the effects of the Great Recession on the racial wealth gap among homeowning
families in order to identify racially disparate trends in the current recovery and extrapolate how
those effects will reverberate generations into the future. It puts forward several key findings,
highlighted in the following pages.

                                                                                                           1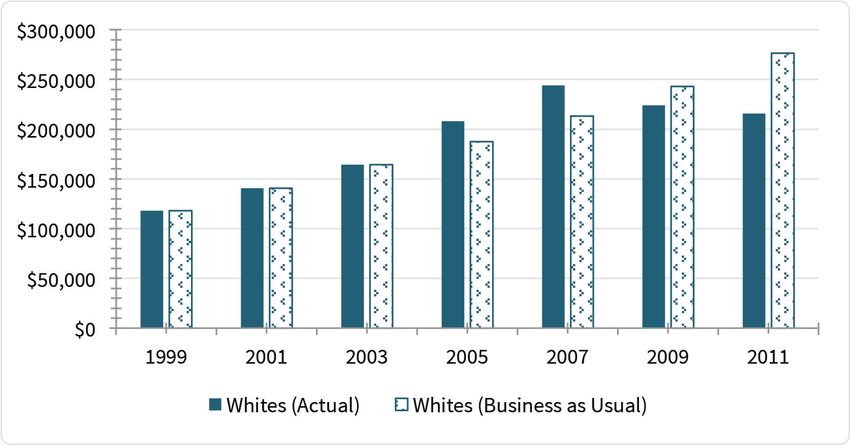
1.
             In the recovery,
              race matters.
From 2007 to 2009, household wealth, with and without home equity,

dropped sharply for black and white families. But during the crucial

recovery period of 2009 to 2011, black and white families had very

different experiences. In that period, white wealth levels, excluding

home equity, began to show signs of recovery: median white household

wealth exhibited zero loss. During that same time period, however, black

households continued to experience severe declines, with the typical

black household losing 40 percent of non-home-equity wealth. Similarly,

black and white wealth levels, including home equity, each dropped

significantly during the 2007–2009 period. During the 2009–2011 period,

however, the typical white family’s losses slowed to zero, while the typical

black family lost an additional 13 percent of its wealth. (At the time this

study was conducted, 2011 was the most recent year for which data were

available in the dataset used for this research.)

                                                                               2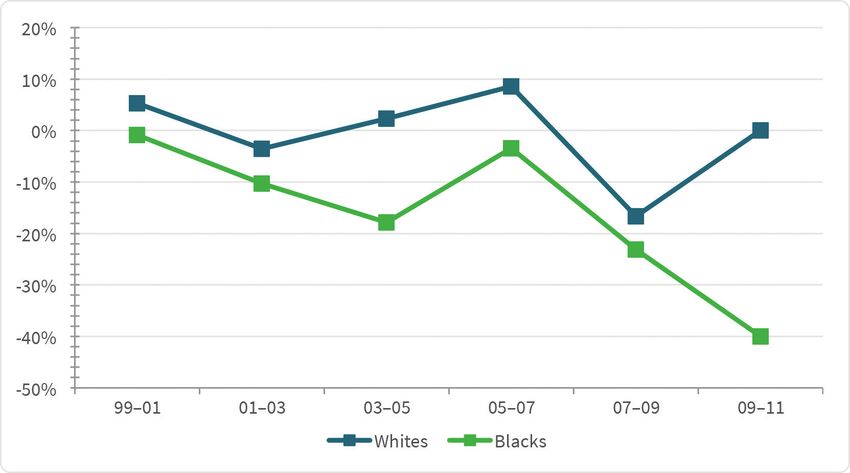
2.
A generation from now,
black family wealth will
 still be more severely
  impacted than white
     family wealth.
One of the most important markers of economic opportunity is a family’s

ability to support its children’s economic future by helping to pay for

college or down payments on a home or by leaving an inheritance. Deep

losses to a family’s wealth, especially losses to home-equity wealth, can

drastically diminish the ability to assist children in these ways, which

is why understanding the effects of the Great Recession on the next

generation is so important. And the racial effects appear to be profound.

As this report finds, the Great Recession will continue to impact black

families more severely in the future in terms of lost potential wealth. By

2031, white wealth is forecast to be 31 percent below what it would have

been without the Great Recession, while black wealth is down almost 40

percent. For a typical black family, median wealth in 2031 will be almost

$98,000 lower than it would have been without the Great Recession.

                                                                             3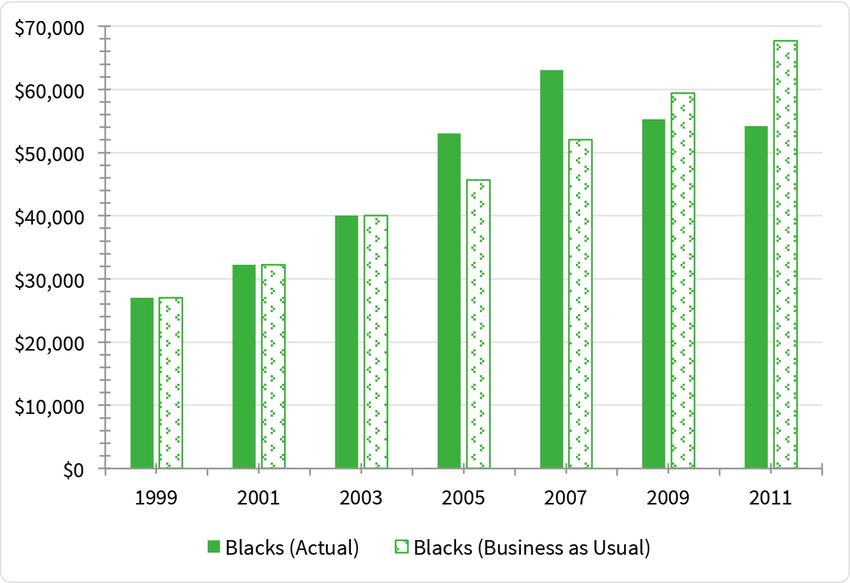
3.
  Without policy actions
  to remedy it, the racial
     wealth gap will be
   significantly greater
  in the next generation
       because of the
   differential impact of
   the Great Recession.
As a result of the financial crisis, the racial wealth gap will continue to grow

well into the next generation. If economic trends had continued without

the shock of the Great Recession, the ratio of white to black median

wealth would have been forecast to drop from 4.4 times greater in 1999

to 4.0 times greater by 2031. But given the impact on black family wealth

of the financial crisis, by 2031 the racial wealth gap will instead grow: the

typical white household’s wealth is projected to be 4.5 times that of the

typical black household’s wealth. This increased disparity will be even

more profound from the perspective of home equity wealth. Without the

Great Recession, home equity values for black and white families at the

same income and education levels were headed toward parity by 2050. As

a result of the Great Recession, however, the gap between black and white

home equity will likely remain large decades into the future.

                                                                                   4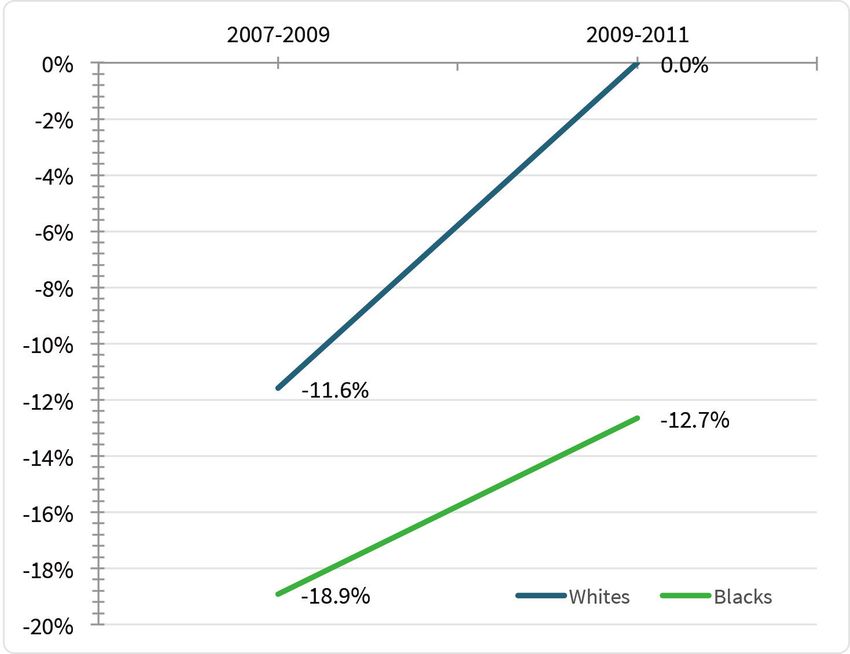
These findings offer an important lens for understanding the economic recovery and for charting a
path forward. The financial crisis was sparked by a housing market collapse that had its roots in racial
discrimination. It resulted in mass foreclosures that impacted racial minorities with disproportionate
ferocity. The aftereffects of the Great Recession continue to deepen racial inequality. Policymakers
should consider these findings in crafting economic interventions. The ongoing effects of the housing
crisis on the racial wealth gap have implications for several pressing policy areas, including reform of
the secondary mortgage market, access to credit, and regulation of the mortgage servicing industry.
To the extent that solutions for the housing and mortgage markets do not squarely confront the
widening racial wealth gap, this study shows that the current dynamics will reinforce racial inequality
for a generation or more to come.

                                                                                                      5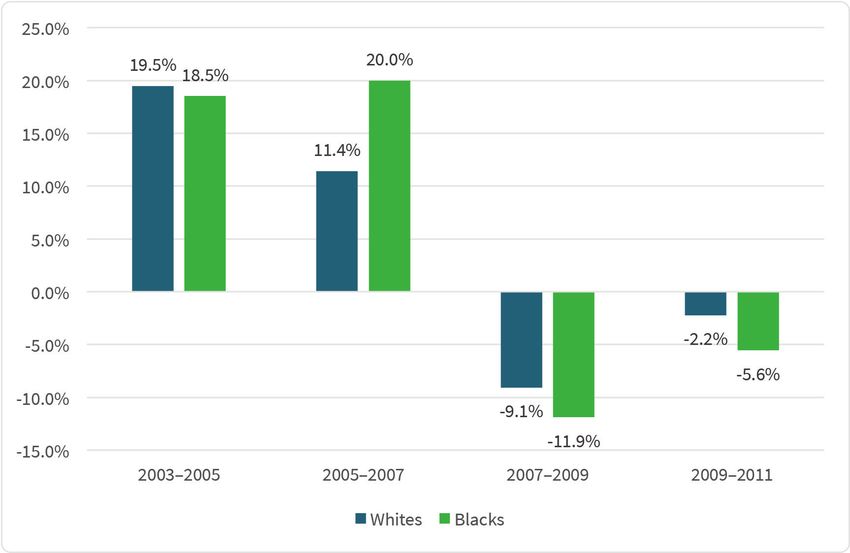
Introduction
A considerable body of research exists on foreclosure rates among people of color and on their higher
likelihood of receiving subprime loans. There has been less research, however, on the long-term
consequences of these discriminatory lending practices on households and families, particularly
families of color. This study examines how discriminatory lending practices and the Great Recession
will likely affect disparities in wealth and home equity between white and black households for
generations to come.

Using a unique dataset, the Panel Study of Income Dynamics (PSID) of the University of Michigan,
this study examines changes in wealth and home equity within the same households over time and
approximates the relationships between wealth and home equity across several generations. The PSID
is a representative survey of US families begun in 1968 that comprises a range of social, economic,
and demographic questions. The same households are surveyed each time, and when children in
these households grow up and start their own households, they are added to the survey. The PSID
provides researchers with the unique opportunity to analyze change over generations in American
households. The dataset is also one of the few that capture household wealth, which is otherwise not
widely measured in the United States. Wealth is notoriously difficult to measure, partially because the
value of many assets, such as stocks, bonds, and real estate, is constantly varying.
                             1999–2003                          2007–2009
                       Lead Up to Housing Boom           Housing Bust and Recession

                                                 2003–2007                            2009–on
                                            Housing Boom                              Recovery

Predatory loans in communities of color were partly responsible for the housing boom and subsequent
housing crisis and Great Recession of the last decade. These loans, defined by unnecessarily high fees
or risky features, such as complicated, changing interest rates, were far more prevalent in communities
of color.¹ While the exact start and end dates of the housing crisis varied widely by location, the US
Census Bureau shows the trajectory of both median and average home sale prices (see Figure 1). This
trend and the index of home prices from Standard & Poors/Case-Shiller show the late 1990s to be the
prelude to the housing boom.² This was followed by the boom (roughly 2003 to 2007), the bust and
Great Recession (2007–2009), and the recovery. The research that follows, which includes analysis of
households that reported owning a home, focuses on the pre-boom period starting in 1999 to up to
2011, after housing prices fell sharply (and the most recent year for which data are available in the
PSID). Because of the very small number of Latinos who owned a home that were surveyed in the
PSID during this period, this research focuses on black and white households only.³ For some limited
analysis of wealth in Latino households, see the end of this section.

                                                                                                     6
THIS RESEARCH ON THE IMPACTS OF DISCRIMINATORY LENDING
ASKS THREE SETS OF BASIC QUESTIONS:
1.
How have variables such as family
wealth and home equity changed in
the United States from the period
before the housing boom began
to today? How have these changes
differed across racial groups?
2.
How important is homeownership
as a proportion of wealth in US
households? Do differences exist
across racial groups?
3.
How might discriminatory lending
practices and their consequences
for household wealth influence
the next generations? Do these
impacts differ by racial group?
7We conclude that the Great Recession disproportionately impacted, and continues to impact, black
families, and that the effects of this disparity in wealth loss due to the subprime crisis will persist
across the next several generations.
FIG URE 1. NEW H O M E S A L ES P R I CES , 1 96 3– 2 01 1
Source: US Census Bureau, “Median and Average Sales Prices of New Homes Sold in United States,”
https://www.census.gov/construction/nrs/pdf/uspricemon.pdf.
Why Are Latino Households Not Included in This Research?
The PSID does collect data on Latinos. However, only 149 Latino households surveyed owned a home
at some point during the survey period, a requirement for inclusion in this analysis. In addition, the
geographic distribution of Latinos varies far more by state than white and black populations, as
more than one in three (36 percent) Latinos in 2012 lived in California alone. This highly concentrated
geographic distribution makes it difficult to compare values for Latinos with those for blacks and whites.
For these reasons, we are unable to include Latinos in this research.
It is possible, however, to analyze some wealth data for these 149 Latino households, revealing startling
trends. In 2007, median Latino household wealth was $156,500. When Latino home equity is excluded,
however, Latino median wealth falls to only $14,000, making very clear the importance of homes at the
peak of the housing boom to Latinos’ wealth portfolio. By 2011, median Latino wealth, including home
equity, had dropped to $50,000, and the typical household saw a 49 percent decline in total wealth.
Median wealth excluding home equity, which comprises mostly savings, dropped to only $5,000, and a
typical household saw a decline of 55 percent in wealth when home equity is excluded. These figures
are not adjusted for inflation.
8Changes in Wealth and
Home Equity from 1991 to 2011
Any analysis of racial wealth disparities arising from the Great Recession must be framed by the racial
dynamics of the subprime lending practices that set the stage for the financial crisis. Subprime lending
and race were tightly linked. A joint report from the US
Department of Housing and Urban Development and
the US Department of the Treasury found that, as of Key Terms
2000, “borrowers in black neighborhoods [were] five Discriminatory lending is when
financial institutions push predatory
times as likely to refinance in the subprime market loans on customers based on their race,
than borrowers in white neighborhoods,” even when ethnic origin, religion, or sex.
controlling for income.4 Indeed, “Borrowers in upper- Home equity is the value of the principal
income black neighborhoods were twice as likely as home minus the value of any remaining
mortgages.
homeowners in low-income white neighborhoods
to refinance with a subprime loan.”5 Scholars Predatory lending is when a financial
institution takes unfair advantage of
have identified these dynamics as creating a “dual a customer by providing a loan that is
mortgage market,” characterized by “a different mix of likely to harm the borrower economically
by resulting in default or foreclosure,
products and by different types of lenders,” allowing typically by charging excessively high
subprime lenders to “disproportionately target fees, imposing unnecessarily high or
complicated interest rates, or including
minority, especially African American, borrowers other terms that carry excessive risk.
and communities, resulting in a noticeable lack of
A subprime mortgage is a loan with
prime loans among even the highest-income minority a higher-than-average interest rate.
borrowers.”6 Subprime mortgages were designed
for individuals who do not qualify for a
conventional mortgage.
Many studies have found that, throughout the
Wealth is defined in the PSID as the
subprime market, black borrowers stood a sum of the value of nine assets minus all
significantly higher chance of receiving higher-cost debts. These assets include checking/
savings accounts, farms and businesses,
and higher-risk loans than white borrowers, even when other real estate, stocks, all vehicles,
controlling for factors related to creditworthiness.7 any other assets, annuities, retirement
accounts, and home equity.
The unsurprising result was a high level of racial
disparities in rates of foreclosure. As of 2010, “African
Americans and Latinos [were], respectively, 47 percent
and 45 percent more likely to be facing foreclosure than whites.”8 One influential study found that
“the greater the degree of Hispanic and especially black segregation a metropolitan area exhibits,
the higher the number and rate of foreclosures it experiences.”9
9Against that backdrop, this report examines how the housing market collapse and broader financial
downturn have unfolded along racial lines. What follows is an analysis of trends in wealth and home
equity using data every two years from 1999 to 2011. Only households that reported owning a home
in at least one of these years are included in the analysis.10
During this dozen-year period, white and black households both saw peak wealth in 2007 and
declines after. However, the data also reveal very important differences by race between 2009 and
2011. White wealth levels, excluding home equity, showed signs of recovery, with the median white
household experiencing zero losses in wealth excluding home equity. During that same period of 2009
to 2011, black households continued to experience severe declines, with the typical black household
losing 40 percent of wealth, excluding home equity. Figure 2 shows the percentage change in wealth
excluding home equity from 1999 to 2011 for these two groups. Each point represents the percentage
change in wealth excluding home equity of the typical household between the two years shown. For
example, the point 99-01 shows median change in household wealth between 1999 and 2001. The
differences for each pair are statistically significant.
FIGURE 2. PERCENTAGE CHANGE IN HOUSEHOLD WEALTH (excluding home equity)
10As Figure 2 illustrates, in the 2007 to 2009 period, wealth declined
for both groups. White wealth excluding home equity dropped by 17
percent; blacks lost 23 percent of their wealth, not including the value
of their homes. But starting in 2009, white wealth trends began an
uptick, whereas blacks saw a 17-percentage-point further decline.
These large losses for blacks are indicative, among other things, of the higher interest payments on
home loans. Researchers at the Urban Institute and others found that blacks saw the largest declines
in retirement savings accounts due to pressures from the recession, including the need to withdraw
money in order to cover the rising costs of their loans.11 While black households continued to raid
their retirement savings accounts, the typical white household was not experiencing this pressure.
To explore this finding further, we examine the differences in wealth levels between white and black
households in the period leading up to and during the Great Recession.
Both total wealth and the proportion of that wealth held in home equity vary tremendously by race.
In 2007, total white median wealth, or the wealth of the typical white
household, was $244,000; for blacks, it was just over one quarter that
level, or $63,060 (see Figures 3a and 3b).
FIGURE 3A. TOTAL WEALTH VS. WEALTH FIGURE 3B. TOTAL WEALTH VS. WEALTH
EXCLUDING HOME EQUITY: WHITE HOUSEHOLDS EXCLUDING HOME EQUITY: BLACK HOUSEHOLDS
11Given the interest of this study in understanding the impact of home lending practices, it is useful to
compare the median wealth of white and black households with and without including the value of
their homes. Blacks and whites both have a considerable portion of their assets in home equity, but
for blacks, it is a far more important part of their wealth portfolio. In 2007, median wealth
excluding home equity was $14,200 for blacks as compared with over
six times that amount, $92,950, for whites. Home equity, therefore,
made up 51 percent of total wealth for the typical white homeowner
in 2007. For the typical black homeowner this same year, on the other
hand, home equity constituted a far larger 71 percent of total wealth.
Given that the bulk of black wealth is held in home equity, we would expect that blacks would
experience greater losses in total wealth on a percentage basis as a result of the housing crisis and
subsequent Great Recession. Figure 4 shows the percentage change in wealth of the typical white and
black households over each two-year period from 2007 through 2011. As the graph illustrates, black
households experienced significantly greater declines in wealth, on a percentage basis, compared to
whites. Between 2007 and 2009, a typical black household’s wealth declined by 19 percent, compared
to a 12 percent decline for whites. More notably, while the typical white household experienced
zero losses between 2009 and 2011 (when the blue line reaches 0 percent change), the typical black
household continued to experience significant declines in wealth over the same period.
FIGURE 4. PERCENTAGE CHANGE IN HOUSEHOLD WEALTH, INCLUDING HOME EQUITY, 2007–2011
12The fact that blacks hold the bulk of their wealth in home equity likely explains, at least in part, why
black wealth, on a percentage basis, declined more than white wealth during the housing bust and
subsequent Great Recession.
To confirm the preceding supposition, we examine whether these declines in home equity were
evenly distributed across races or if blacks lost more home equity than whites.
Figure 5 displays the percentage change in household home equity for all who owned a home in
the previous year. As can be expected during a housing boom, the period from 2003 through 2007
yielded positive gains in home equity values for both racial groups. From 2007 through 2011, both
groups experienced losses, with greater losses for blacks. Between 2007 and 2009, typical white
home equity declined by 9 percent while typical black home equity declined by 12 percent. This
disparity may stem from the fact that blacks were more exposed to predatory loans and other types
of toxic mortgages and ballooning interest rates as compared to whites, leading to disparate rates
of delinquency and foreclosure.12 Further, these losses slowed to only 2 percent between 2009 and
2011 for white households, but for blacks, home equity values continued to decline by 6 percent.
While white home equity began to recover quickly after the housing crisis stabilized, this was not the
case for blacks; again, this difference likely emerges as a result of blacks’ disproportionate exposure
to predatory loans and other deceptive mortgage schemes.13
FIGURE 5. PERCENTAGE CHANGE IN HOME EQUITY DURING AND AFTER THE HOUSING BOOM
13By 2009 the housing boom, buttressed in large part by subprime mortgages and predatory loans,
came to an end. Many Americans fell far behind on their mortgages, and banks, fearful of losing their
investments, began to foreclose on thousands of homes around the country.
Dividing this dozen-year period into two important phases, the housing peak and the housing
bust, is useful for illustrating the relative benefits of the peak and relative losses in the bust years
between these two racial groups. In the peak housing boom period, 1999–2005, whites and blacks
reaped very similar wealth gains (see Figure 6). Later, however, losses in wealth for the typical
black household far outstripped those of the typical white household: a 33 percent loss for blacks
compared to a 12 percent loss for whites between 2007 and 2011. These trends further demonstrate
the disproportionate impact of the foreclosure crisis on black household wealth.14
One might counter the preceding results by saying that part of the story of greater wealth losses
among blacks could be due to the fact that they held more of their wealth in their homes and thus it
is unsurprising that a housing bust would affect them disproportionately. However, the significant
disparities in declines in wealth between blacks and whites, excluding home equity, previously
discussed (see Figure 2), lends support to the notion that the uneven distribution of subprime
loans—and not simply the disproportionate amount of wealth blacks hold in home equity compared
to whites—is a key explanatory factor in the overall disparities in percentage change in total wealth
between blacks and whites between 2007 and 2011 (see Figure 6).
FIGURE 6. PERCENTAGE CHANGE IN TOTAL WEALTH: HOUSING PEAK TO HOUSING BUST
14Forecasting Future Disparities
Moving one step further with this analysis and in order to understand the impacts of the Great
Recession on household wealth in the future, we begin by comparing actual wealth levels in 2011
to what they might have been absent a recession. To forecast these values, we calculate the median
growth rate in wealth from the pre–housing boom period (1999 up to 2001), which was approximately
14 percent for whites and blacks over the two-year period. Next, we apply this growth rate to the
median wealth of households in 2003 in order to forecast what wealth would have been without
the recession. We use the median growth rate between 1999 and 2001, as this was the period before
the housing bubble truly hit its stride. This growth rate does, however, assume a relatively strong
economic climate. As such, the forecasted wealth levels are an optimistic projection, and assume
that the strong economic climate observed in the early part of the decade continued on into the next
decade.
On a percentage basis, the differences in actual vs. forecast wealth in 2011 for black and white
households were about the same: 20 and 22 percent, respectively. Figures 7a and 7b display these
actual vs. forecasted values. The difference in forecast vs. actual wealth for whites in 2011 is slightly
greater than that of blacks because white wealth was so much greater at the outset. If pre-crisis
trends had continued, white households were projected to keep increasing this wealth every year.
So even though blacks lost more of their actual wealth, whites lost more “potential” wealth—the
wealth they would have accrued if their larger wealth at the outset had continued to grow at pre-
boom rates.
15FIGURE 7A. ACTUAL VS. FORECASTED BLACK WEALTH
FIGURE 7B. ACTUAL VS. FORECASTED WHITE WEALTH
16As discussed for Figures 7a and 7b, white households were showing signs of recovery by 2011, while
black households were still experiencing significant losses. This evidence suggests that the Great
Recession affected black households for longer than it did white households.
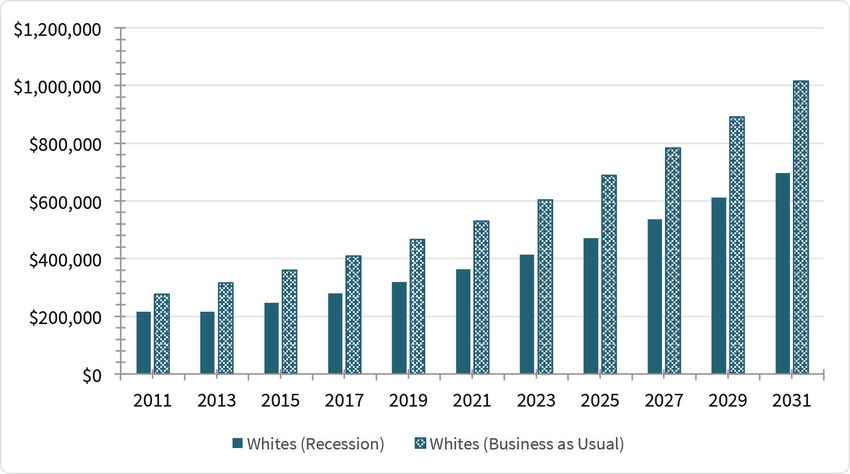
FIGURE 8A. FORECAST OF WHITE HOUSEHOLD WEALTH:
GREAT RECESSION VS. BUSINESS-AS-USUAL SCENARIOS
FIGURE 8B. FORECAST OF BLACK HOUSEHOLD WEALTH:
GREAT RECESSION VS. BUSINESS-AS-USUAL SCENARIOS
17In order to understand the long-term consequences of these continued losses on racial wealth
disparities, it is useful to forecast the future wealth of each racial group—assuming that the observed
wealth growth rates of each group between 2009 and 2011 remained constant through 2013 as the
recession’s after-effects lingered. After 2013 we are making the assumption for this calculation
that each group will return, more or less, to its pre-crisis, pre-housing-boom growth rate—the rate
experienced between 1999 and 2001. This is an admittedly optimistic assumption. We use these
growth rates for illustrative purposes, assuming a best-case scenario, though it is likely that black
households did not rebound as quickly as white households, even after 2013, given that foreclosures
were disproportionately in communities of color and housing prices in those places are experiencing
slower rates of recovery.15
FIGURE 9. PERCENTAGE DIFFERENCE IN WEALTH: IMPACT OF THE GREAT RECESSION
18Figures 8a and 8b compare a business-as-usual scenario (if wealth growth rates stayed the same
as they were in the pre-boom period) to forecasted wealth levels taking the Great Recession into
account. In both cases, these rates are projected forward to 2031, two decades from the most
recent data. This twenty-year projection is one way to capture how the recession will impact the
same households twenty years in the future. A child who was ten in 2011 would be thirty in 2031,
thereby enabling analysis of whether the Great Recession will impact the next generation of black
households differently from white households.
Figure 9 summarizes the results of these forecasts: The Great Recession will continue to affect blacks
more severely in terms of lost potential wealth in the future. By 2031, white wealth is forecast to be
31 percent below what it would have been without the Great Recession, while black wealth is down
almost 40 percent. For a typical black family, median wealth in 2031 will be almost
$98,000 lower than it would have been without the Great Recession.
The disparity between black and white wealth would have been large without the Great Recession.
In 1999 the ratio of median white wealth to black wealth was 4.4. However, trends were shifting
and black wealth was slowly approaching white wealth levels. By 2003 the ratio of white to black
median wealth dropped to 4.1. By 2031 the ratio of white to black median wealth would have been
forecast to drop to 4.0, that is, white wealth would be four times that of black wealth. However, as
a result of the Great Recession and its disproportionate impact on black wealth, this already severe
disparity is projected to increase even further. By 2031 the typical white household’s
wealth is projected to be 4.5 times that of the typical black household’s
wealth. Figure 10 highlights the increasing disparities in wealth of blacks and whites projected
twenty years in the future as a result of the Great Recession.
FIGURE 10. THE EFFECTS OF THE GREAT RECESSION ON WEALTH DISPARITIES BETWEEN
WHITES AND BLACKS: RATIO OF WHITE TO BLACK HOUSEHOLD WEALTH
19Impacts on Home Equity
Values of the Next Generation
The preceding discussion documents the extent to which the impacts of the recession on household
wealth were unevenly distributed across white and black households, with the typical black household
experiencing greater losses in total wealth, on a percentage basis, between 2007 and 2011 compared
to the typical white household. Additionally the typical black household continued to experience
losses in wealth between 2009 and 2011 while the typical white household was breaking even over
the same period. These disparate impacts will undoubtedly continue to affect the next generation.
In order to explore the possible magnitude of the intergenerational impacts of the recession, we look
into the relationship between parent household wealth and the home equity value of their adult
children. Using the PSID dataset that tracks households over several generations, we examine wealth
levels of the parents in 1984 and the home equity values of their adult children, ages thirty to forty,
in 2003. The result is that in black and white households, parent wealth is a statistically significant
predictor of an adult child’s home equity value, controlling for the income and education level of the
adult child.16 However, parent wealth is a stronger predictor of future home equity of black families
compared to white families.
In order to illuminate the long-term consequences of wealth losses on the disparities in home equity
across racial groups, we forecast the future wealth of each racial group and calculate a projected
level of home equity for the next generations. Using parent wealth values projected earlier under
the two scenarios, a business-as-usual projection and a recession projection, we forecast the home
equity value of their children, ages thirty to forty, nineteen years into the future. We use these age
ranges in order to apply the relationship observed between parent wealth in 1984 and the home
equity value of their adult children, ages thirty to forty, in 2003.
Since the original wealth calculations (from which the forecasted values are based) are only for
households that owned a home sometime between 1999 and 2011, the projections of future home
equity values of the next generations are for those whose parents or grandparents owned a home
at some point between 1999 and 2011. We use this subgroup of households, as these people are the
most likely to have been impacted by the discriminatory lending practices of the Great Recession.
In order to forecast the impact on home equity across generations, we apply the same relationships
observed in the data between parent wealth in 1984 and the home equity value of their adult children
20(ages thirty to forty) in 2003. We estimate the income and education levels of the adult children as the
median value for each racial group observed in 2003, as provided in the PSID. For white households,
the median income is $60,000 and median education level is fourteen years of schooling. For black
households, the median income is $37,164 and median education level is twelve years of schooling.
We assume that median income levels increase by 2 percent each year for each racial group. In
Figure 11, we chart the forecasted home equity values for the adult children, ages thirty to forty,
in 2022, measuring parent wealth in pre-Recession 2003 and comparing those home equity values
with forecasted home equity values for adult children, ages thirty to forty, whose parents and/or
grandparents were likely impacted by the recession. As the dotted lines illustrate, without
the Great Recession, black and white home equity values for this group were
headed toward parity by 2050. As a result of the Great Recession, however,
the gap between black and white home equity remains large, decades into the
future.
FIGURE 11: THE EFFECTS OF THE GREAT RECESSION ON HOME EQUITY FOR
THE NEXT GENERATION OF WHITES AND BLACKS (AGED 30–40)
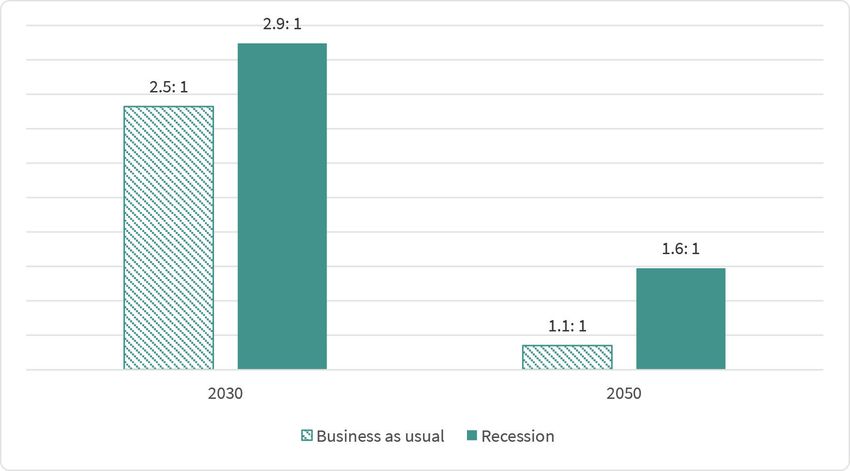
21Another way to examine the projected disparities in home equity between racial groups is to
explore the ratio of white household home equity to black household home equity with and without
a recession. Figure 12 displays the results of this analysis. It is clear that, as a result of the Great
Recession, the gap in home equity value between white and black households will be more severe.
Using parent wealth levels in the pre-Recession year of 2003, the forecasted home equity for white
adult children (ages thirty to forty) by 2022 would have been 3.5 times that of black adult children,
and that gap was projected to narrow. Without the recession, by 2050, home equity
values for white and black households earning their respective median
income levels may have been almost on par with each other. However, as a
result of the wealth lost by black households during the Great Recession, by
2050, white home equity is projected to be 1.6 times that of black households.
FIGURE 12. THE EFFECTS OF THE GREAT RECESSION ON HOME EQUITY DISPARITIES BETWEEN
WHITES AND BLACKS: RATIO OF FORECAST WHITE TO BLACK HOME EQUITY
The previously referenced projections (Figure 12) for home equity ratios of adult children in 2030 and
2050 are based on the wealth levels of their parents in 2011 and 2031 (projected wealth), respectively.
They are calculated using the median income and education levels of whites and blacks. Medians
are helpful for understanding the impacts on a typical family; however, it is also interesting to
examine the possible impacts of the recession on two hypothetical families with similar earnings
and educational attainment levels.
22A Tale of Two Households:
Illustrating Impacts on the Next Generation
FAMILY A is white, and their total wealth in 2003 is around $164,000. As a result of the Great Recession,
their wealth is $216,000 by 2011, approximately $61,000 less than it would have been without the
recession. By 2030, nineteen years later, Family A’s oldest son, Adam, has moved out and earned a
college degree and has household income of approximately $108,000. With financial help from his
parents, he is able to provide a down payment of approximately $97,000 for a home. This amount is only
about 1 percent, or $1,000, less than he would have been able to afford had the recession not reduced
his parents’ wealth by $61,000.
By 2050, Adam’s daughter Adriana has earned a college degree and moved out on her own. Her
household income is $132,000. Drawing on the resources of her parents, and possibly grandparents,
Adriana purchases a home with a $120,000 down payment. This amount is only around 5 percent, or
$6,000, less than she could have afforded had the recession not impacted the wealth of her grandparents.
Now let’s imagine a second family. FAMILY B is black, and their total wealth in 2003 is $40,000. By 2011,
as a result of the Great Recession, their wealth is $54,000, $14,000 less than it would have been without
the recession. By 2030, Family B’s oldest daughter, Betty, has purchased a home. Just like Adam in
Family A, she has graduated from college and earns the same $108,000. Her home equity is only $53,000,
over $3,000, or 6 percent, less than it would have been without the recession impacting her parent’s
wealth and subsequent ability to pitch in on a down payment.
Nineteen years later, in 2050, Betty’s oldest son, Bert, has purchased a home. Bert follows a similar path
as Adriana in Family A, with a college degree and an income of $132,000. Bert’s down payment is only
$85,000, almost $24,000 less or 22 percent below what it may have been without the Great Recession.
This short, hypothetical scenario illustrates the differential impacts the Great Recession will likely have
on the next generations of white and black households. By 2050, a white household’s home equity may
be only 5 percent below what it would have been without the Great Recession, while a black household,
with the same income and education levels, may have a home equity value 22 percent lower than it
could have been without the effects of the Great Recession.
23Conclusion and Policy Implications
The research described demonstrates that the Great Recession impacted households unevenly.
Black households experienced greater declines in household wealth, both when including and
excluding the wealth they hold in their homes. Moreover, while the typical white household
showed strong signs of recovery between 2009 and 2011, the typical black household continued to
experience significant declines in wealth.
Among the sample of people who owned a home at some point between 1999 and 2011, home
equity is a more significant proportion of total wealth for blacks than for whites. As such, a typical
black household that was subject to a toxic mortgage had fewer resources to fall back on when home
values plummeted and interest rates skyrocketed, compared to the typical white household.
The significant losses in wealth experienced by black households will likely create ripple effects,
hampering the ability of the next generations of black households to catch up to whites in terms of
total wealth and home equity values.
Through an illustrative forecasting exercise, we show that the gap between typical black wealth and
white wealth (for those who owned a home at some point between 1999 and 2011) was narrowing,
and that by 2031, without the impacts of the Great Recession, white wealth would amount to 4 times
that of black wealth. As a result of the Great Recession, by 2031 the ratio of white to black wealth
jumps to 4.5 to 1.
The home equity value of children is more closely related to the wealth levels of their parents for
blacks as compared with whites. This finding highlights why losses of wealth for black households
will affect the home equity values of their children more than it will for white households.
Without the Great Recession, by 2050, home equity values for blacks and whites whose parents or
grandparents owned a home at some point between 1999 and 2011 may have approached parity. As
a result of discriminatory lending practices and the Great Recession, our analysis suggests that the
next generations of black families will still have home equity values only 70 percent of their white
counterparts.
The findings of this report should inform policymaking in areas that affect the economic recovery
and access to the housing market. Among other things, these findings are relevant to policymaking
in the following areas.
241.
Reforming the
secondary mortgage
market
Many of the worst lending abuses during the subprime era grew out
of incentives set by the secondary mortgage market, particularly the
Wall Street banks that dominated that market during the boom. Loan
purchasers provide the capital that fuels the lending industry, and their
policies and practices thus have tremendous influence on mortgage
origination. Debate continues over how to restructure the government-
sponsored entities, such as Fannie Mae and Freddie Mac, which have
traditionally been the primary actors in that market. Reforms should
ensure that all of these players operate in a way that encourages inclusive
lending and provides a disincentive for discrimination on the part of
originators.
252.
Opening access
to credit
Legislation and regulations enacted in response to the financial crisis have
aimed to prevent the kind of predatory lending that proliferated during
the subprime boom. Increasingly, however, financial institutions appear
to be going far beyond those wise restrictions, limiting access to credit
to low-income individuals even when responsible credit options that
would benefit borrowers exist. Such practices unjustifiably exclude many
borrowers of color from the market and limit their ability to build wealth
through home equity. Policymakers should carefully monitor current
lending practices to ensure that low-income and minority communities
are not being unfairly excluded, and to clarify that recent legislation does
not support racially disparate limitations on access to credit.
263.
Regulating mortgage
servicing
Just as race discrimination permeated subprime lending, the ongoing
servicing of mortgage loans may adversely impact communities of color,
as a result of intentional discrimination and facially neutral policies
that exacerbate existing disparities. Government enforcement agencies
should focus special attention on identifying and stamping out racial
disparities in servicing practices. Policy reforms aimed at strengthening
regulators or addressing abuses in the mortgage servicing industry should
be specially attuned to the civil rights consequences of unequal exclusion
from housing opportunity.
27Notes
1 American Civil Liberties Union, Justice Foreclosed.
2 S&P Dow Jones, “S&P/Case-Shiller Home Price Indices.”
3 This research involved construction of two datasets from the PSID. The first dataset includes a total
of 3,031 households questioned in each survey year between 1999 and 2011: 2,290 white (non-
Hispanic) households and 741 black households. The second dataset includes households surveyed
in 1984 whose adult children, ages thirty to forty, were also surveyed in 2003. This sample comprised
609 white households and 314 black households.
4 US Department of Housing and Urban Development and US Department of Treasury, Curbing
Predatory Home Mortgage Lending, 47–48.
5 Ibid., 48.
6 Apgar and Calder, “Dual Mortgage Market,” 102.
7 Bocian, Ernst, and Li, Unfair Lending, 3; Bocian et al., Lost Ground, 5.
8 Bocian, Li, and Ernst, Foreclosures by Race and Ethnicity, 10.
9 Rugh and Massey, “Racial Segregation and the American Foreclosure Crisis.”
10 This subsample of the population, those who have been or are currently homeowners, has higher
overall wealth levels than the general population. Median wealth levels we refer to throughout this
document are therefore substantially higher than median wealth for white and black households
in the US population. The disparities between black and white former or current homeowner
households are also considerably smaller than those between black and white households overall.
The extent of missing data in this dataset is surprisingly low. PSID researchers attribute this to the
fact that “PSID respondents have confidence in the interviewers and have been interviewed on
numerous prior occasions” (see http://psidonline.isr.umich.edu/Data/Documentation/wlth1984-
2001.pdf). To impute missing values, the PSID applies a multilevel, “hot deck method.”
11 Bocian et al., Lost Ground, 17, 21; McKernan et al., Less Than Equal, 3–4.
12 Bocian et al., Lost Ground, 21.
13 Ibid.
14 B
ocian, Smith, and Li, Collateral Damage, 2; Bocian, Li, and Ernst, Foreclosures by Race and
Ethnicity, 3.
15 Dreier et al., Underwater America, 5.
16 We acknowledge that parent wealth levels may also have affected adult education and adult
income levels, and thus the independent variables in the model are not as conceptually
independent as we would hope for in an ideal statistical model. However, using tests for
multicollinearity across the variables, we found that correlations between parent wealth, child
income, and child education levels were below 0.2, indicating that the variables are not highly
correlated with each other.
28Bibliography
American Civil Liberties Union. Justice Foreclosed: How Wall Street’s Appetite for Subprime Mortgages
Ended Up Hurting Black and Latino Communities. New York, NY: ACLU, October 2012.
Apgar, William, and Allegra Calder. “The Dual Mortgage Market: The Persistence of Discrimination in
Mortgage Lending.” In The Geography of Opportunity: Race and Housing Choice in Metropolitan America,
edited by Xavier de Souza Briggs. Washington, DC: Brookings Institution, 2005.
Bocian, Debbie Gruenstein, Keith S. Ernst, and Wei Li. Unfair Lending: The Effect of Race and Ethnicity
on the Price of Subprime Mortgages. Durham, NC: Center for Responsible Lending, 2006.
Bocian, Debbie Gruenstein, Wei Li, and Keith S. Ernst. Foreclosures by Race and Ethnicity: The
Demographics of a Crisis. Center for Responsible Lending, 2010.
Bocian, Debbie Gruenstein, Wei Li, Carolina Reid, and Roberto G. Quercia. Lost Ground, 2011:
Disparities in Mortgage Lending and Foreclosures. Durham, NC: Center for Responsible Lending, 2011.
Bocian, Debbie Gruenstein, Peter Smith, and Wei Li. Collateral Damage: The Spillover Costs of
Foreclosures. Center for Responsible Lending, 2012.
Dreier, Peter, Saqib Bhatti, Rob Call, Alex Schwartz, and Gregory Squires. Underwater America: How the
So-Called Housing Recovery Is Bypassing Many Communities. Berkeley, CA: Haas Institute, 2014.
McKernan, Signe-Mary, Caroline Ratcliffe, Eugene Steuerle, and Sisi Zhang. Less Than Equal: Racial
Disparities in Wealth Accumulation. Washington, DC: Urban Institute, 2013.
Rugh, Jacob S., and Douglas S. Massey. “Racial Segregation and the American Foreclosure Crisis.”
American Sociological Review 75, no. 5 (2010): 629–51.
S&P Dow Jones. “S&P/Case-Shiller Home Price Indices.” S&P Dow Jones Indices. http://us.spindices.
com/index-family/real-estate/sp-case-shiller.
US Department of Housing and Urban Development and US Department of Treasury. Curbing
Predatory Home Mortgage Lending. Washington, DC: US Department of Housing and Urban
Development and Department of Treasury, 2000.
29COPYRIGHT ©2015 SOCIAL SCIENCE RESEARCH COUNCIL
This work carries a Creative Commons Attribution-NonCommercial-NoDerivs 3.0 License. This license permits you to copy,
distribute, and display this work as long as you mention and link back to the Social Science Research Council, attribute
the work appropriately (including both author and title), and do not adapt the content or use it commercially.
For details, visit http://creativecommons.org/licenses/by-nc-nd/3.0/us/
Social Science Research Council
One Pierrepont Plaza, 15th Floor
300 Cadman Plaza West
Brooklyn, NY 11201 USAYou can also read