Impact of Sowing Time on Chickpea (Cicer arietinum L.) Biomass Accumulation and Yield - MDPI
←
→
Page content transcription
If your browser does not render page correctly, please read the page content below
agronomy
Article
Impact of Sowing Time on Chickpea (Cicer arietinum L.)
Biomass Accumulation and Yield
Mark F. Richards *, Lancelot Maphosa and Aaron L. Preston

                                          NSW Department of Primary Industries, 322 Pine Gully Road, Wagga Wagga, NSW 2650, Australia;
                                          lance.maphosa@dpi.nsw.gov.au (L.M.); aaron.preston@dpi.nsw.gov.au (A.L.P.)
                                          * Correspondence: mark.richards@dpi.nsw.gov.au; Tel.: +61-2-6938-1831

                                          Abstract: Chickpea growth, development and grain yield are affected by a range of climatic and
                                          environmental factors. Experiments were conducted across four sowing dates from mid-April to the
                                          end of May, over two years at Trangie in central western New South Wales (NSW), and Leeton, Wagga
                                          Wagga and Yanco (one year) in southern NSW, to examine the influence of sowing time on biomass
                                          accumulation, grain yield and plant yield components. Climatic and experimental location data
                                          were recorded during the growing seasons. Early sowing (mid-April) resulted in taller plants, higher
                                          bottom and top pod heights, fewer pods, more unfilled pods and greater biomass accumulation,
                                          but low harvest index due to reduced grain yield compared with late sowing (end of May). Grain
                                          number was positively correlated with grain yield and was the main yield component accounting for
                                          most of the variation in yield. There was largely a positive correlation between biomass and yield,
                                          especially with delayed sowing except for Leeton experiments. This study concludes that sowing
                                          around the end of April in central western NSW and mid-May in southern NSW is conducive to
                                          higher grain yield as it minimises exposure to abiotic stresses at critical growth periods and allows
                                          efficient conversion of biomass to grain yield.

                                Keywords: abiotic stresses; biomass; chickpea; phenology; sowing date; yield

Citation: Richards, M.F.; Maphosa, L.;
Preston, A.L. Impact of Sowing Time
on Chickpea (Cicer arietinum L.)
Biomass Accumulation and Yield.
                                          1. Introduction
Agronomy 2022, 12, 160. https://               Chickpea (Cicer arietinum L.) is a cool-season legume grown over a wide range of
doi.org/10.3390/agronomy12010160          environments mainly in the arid and semi-arid regions of the world, where it often encoun-
                                          ters hostile climatic conditions. Its numerous nutritional and farming system benefits are
Academic Editor: Masoud Hashemi
                                          well documented. Chickpea is a source of essential proteins and amino acids in human
Received: 6 December 2021                 diets [1] and provides valuable energy and proteins in animal feed [2]. Within farming
Accepted: 21 December 2021                systems, it is a useful break crop for weed control and prevention of soil- and stubble-borne
Published: 10 January 2022                disease outbreaks. Furthermore, its ability to fix atmospheric nitrogen improves soil fertility,
Publisher’s Note: MDPI stays neutral
                                          providing benefits for subsequent cereal crops.
with regard to jurisdictional claims in        Although chickpeas are grown in approximately 17.8 million ha across 56 countries [3]
published maps and institutional affil-   the Indian subcontinent is the major producer and consumer [4,5]. In Australian Mediter-
iations.                                  ranean regions, it is predominantly grown in the northern parts, in Queensland and
                                          northern New South Wales (NSW). Over a 20-year period (1999–2019), in Australia the har-
                                          vested area increased from 218,000 to 263,000 ha, with a corresponding increase of 229,900
                                          to 281,200 tonne production [3]. However, over this period yield gains have been minimal,
Copyright: © 2022 by the authors.         increasing by 14 kg per ha (1055 to 1069 kg/ha) [3]. The northern regions of Australia have
Licensee MDPI, Basel, Switzerland.        deep soils and high water-holding capacity, and chickpea is sown in late autumn and/or
This article is an open access article    early winter when the soil water profile is full. Due to summer dominant rainfall [6] these
distributed under the terms and
                                          regions receive low in-crop rainfall and thus chickpeas get exposed to unfavourable climatic
conditions of the Creative Commons
                                          conditions such as terminal water deficit and extreme high temperatures later in the season,
Attribution (CC BY) license (https://
                                          which limit yield potential. The benefits to farming systems and profitability of chickpeas
creativecommons.org/licenses/by/
                                          have encouraged production to expand into new agroecological zones such as the central
4.0/).

Agronomy 2022, 12, 160. https://doi.org/10.3390/agronomy12010160                                       https://www.mdpi.com/journal/agronomy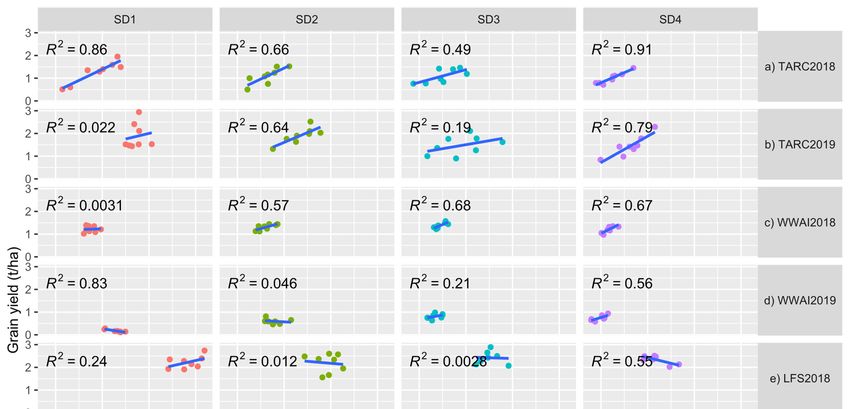
Agronomy 2022, 12, 160                                                                                            2 of 16

                         western and southern regions of NSW. In these colder- and winter-rainfall-dominated
                         regions [6], biomass accumulation and grain yield are constrained by cold temperatures
                         and frost events early in the growing season and terminal drought and heat stress later in
                         the season.
                               The optimum temperature during the sensitive reproductive phase for chickpea pro-
                         duction is between 10 and 30 ◦ C [5], with flower/pod abortion and yield reductions
                         observed at temperatures above or below this range [7–12]. In this temperature range there
                         tends to be sufficient accumulation of biomass and its efficient conversion to grain yield.
                         The number of productive flowers and filled pods is greatly affected by high temperatures,
                         and therefore these traits can be used as a selection criterion for heat tolerance [5]. Further-
                         more, a mean daily temperature of approximately 15 ◦ C is required for successful pod set
                         and grain retention [7,8]. At very low temperatures, frost induces flower and pod abortion
                         leading to a high number of empty pods. In most growing regions chickpea is largely
                         grown on stored soil moisture, with no supplementary irrigation, and therefore tends to
                         encounter terminal drought. Globally, drought accounts for about 50% of the chickpea yield
                         reductions [13]. While grain weight, grain number and pod number contribute to final
                         grain yield, grain number has been overwhelmingly shown to be the main driver of yield
                         in crops [6,14]. Grain weight, however, has important commercial quality implications
                         especially if abiotic stresses result in shrivelled or small grain [6,15].
                               Identifying crop varieties that are suitable for new production environments is key
                         to increasing crop expansion, adaptation and overall productivity [16,17]. Understanding
                         the mechanisms for maintaining productivity and/or increasing yield under multiple
                         stresses assists in determining varietal suitability in other environments. Desi chickpea
                         varieties tend to be more tolerant of abiotic stresses such as drought and heat than the kabuli
                         varieties [5]. Generally, crops adopt a range of avoidance or tolerance strategies to survive
                         and yield satisfactorily under abiotic constraints [18,19]. In chickpea, the reproductive
                         phase is more sensitive to environmental stresses than the vegetative phase. However, due
                         to its indeterminate growth habit, these growth phases can overlap, and chickpeas can be
                         exposed to the same environmental stressors during both growth phases simultaneously.
                         Biomass accumulation and satisfactory conversion to grain yield can be maximised through
                         management practices such as optimising sowing dates for specific varieties, to ensure that
                         the crop is not in susceptible growth phases when environmental stresses are highest [20].
                               Sowing across a range of dates and different environments is a practical way of testing
                         both a crop’s adaptability to and productivity in new regions and matching the genetic
                         performance of varieties to the long-term average climatic conditions. The aim of this
                         study was to identify the varieties best adapted to two agroecological environments of
                         central western and southern NSW through varying sowing date and to understand the
                         genotype-by-environment (G × E) interactions. The study also aimed to quantify the
                         drivers of chickpea yield by measuring yield components, biomass, harvest index and the
                         relationships between grain number and biomass with grain yield.

                         2. Materials and Methods
                         2.1. Experimental Locations and Seasonal Conditions
                               In 2018, the experiments were conducted at four locations, Trangie Agricultural Re-
                         search Centre (TARC; 31.99◦ S, 147.95◦ E), Wagga Wagga Agricultural Institute (WWAI;
                         35.05◦ S, 147.35◦ E), Leeton Field Station (LFS; 34.59◦ S, 146.36◦ E) and Yanco Agricultural
                         Institute (YAI; 34.61◦ S, 146.41◦ E). YAI is 6 km from LFS and was considered as a drought
                         stressed companion to the LFS experiment. In 2019 experiments were conducted at TARC,
                         WWAI and LFS but not at YAI. Experiment details, overall trial management and long-term
                         seasonal conditions, have been presented previously [21] and in Supplementary Figure
                         S1. Daily temperatures (maximum and minimum) and rainfall amount for all experiments
                         (Table 1) were obtained from the local Bureau of Meteorology (BOM) weather stations. The
                         experiments were sown on similar dates at all the locations, with fortnightly sowing from
                         mid-April to end of May.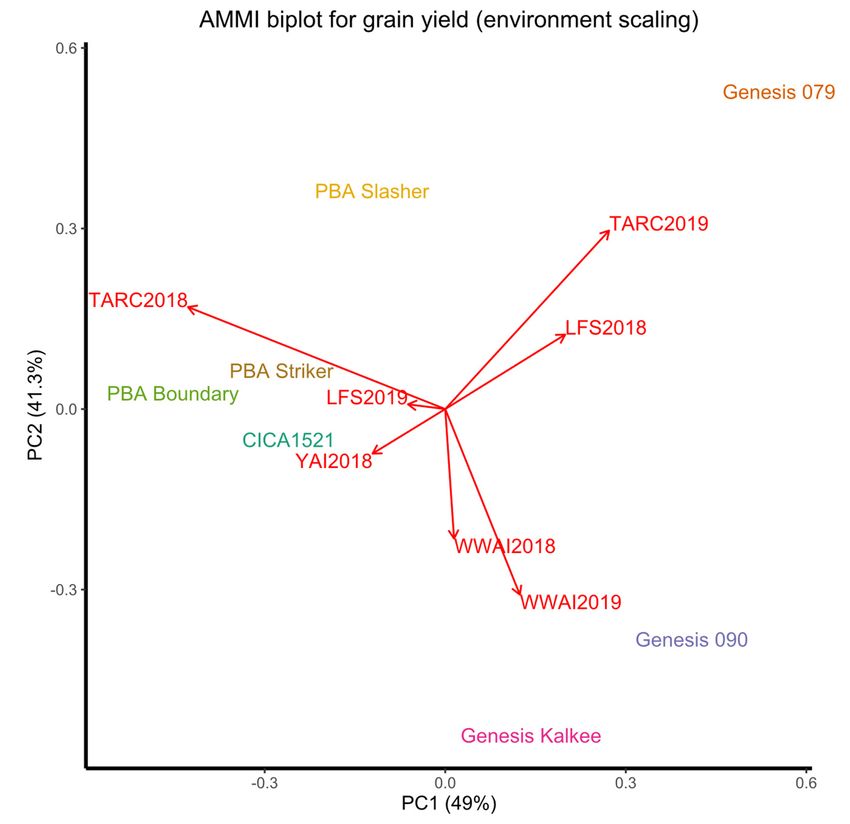
Agronomy 2022, 12, 160                                                                                                   3 of 16

                                Table 1. Rainfall, supplementary irrigation, minimum (min) and maximum (max) temperatures
                                recorded in 2018 and 2019. TARC18 = Trangie Agricultural Research Centre 2018 experiment;
                                WWAI18 = Wagga Wagga Agricultural Institute 2018 experiment; LFS18 = Leeton Field Station 2018
                                experiment; YAI18 = Yanco Agricultural Institute 2018 experiment; TARC19 = Trangie Agricultural
                                Research Centre 2019 experiment; WWAI19 = Wagga Wagga Agricultural Institute 2019 experiment;
                                and LFS19 = Leeton Field Station 2019 experiment.

 Experiment                         Jan     Feb     Mar     Apr     May      Jun     Jul   Aug     Sep    Oct    Nov     Dec
   TARC18          Rainfall (mm)    26.2     13      7.8      3     14.2     27.2    0.8    23.8    9.2    59     50     28.8
                  Irrigation (mm)    0        0      40      15      30        0     20      20      0      0      0       0
                  Min Temp. (◦ C)   20.6    19.1    17.5    14.7     7.4      5.5    2.7     3.8    7.9   13.5   15.5    19.3
                  Max Temp. (◦ C)   36.9    34.8    33.4    30.1    21.7     17.8   18.1    18.9   23.7   27.5   29.2    34.8
   WWAI18          Rainfall (mm)    60.3    46.5     7.7    3.9     26.8     40.1   15.2     19    25.3   22.3   91.3    48.4
                  Irrigation (mm)    0        0       0      16      18        0      0       0      0      0      0       0
                  Min Temp. (◦ C)   18.2    16.3    13.6     11      5.5      3.9    1.4     2.7    3.8    9.3    13     17.5
                  Max Temp. (◦ C)   34.5    32.6    30.2    27.9    18.6      15    14.2    15.1   19.5   26.3   26.7    32.6
    LFS18          Rainfall (mm)    24.2      1      4.2      2     23.2     29.2    5.8     8.8   12.4    7.4   57.6    22.6
                  Irrigation (mm)    0        0     220       0      10        0      0       0     12     12      0       0
                  Min Temp. (◦ C)    19     17.7    14.4    11.4     6.1      3.8    2.1     3.3    4.8   10.4   13.6    18.6
                  Max Temp. (◦ C)   35.8    33.9     31     28.9    19.6     15.4   15.9    16.9   21.2    27    27.9    33.8
    YAI18          Rainfall (mm)    24.2      1      4.2      2     23.2     29.2    5.8     8.8   12.4    7.4   57.6    22.6
                  Irrigation (mm)    0        0       0      11      11        0      0      16     48      0      0       0
                  Min Temp. (◦ C)    19     17.7    14.4    11.4     6.1      3.8    2.1     3.3    4.8   10.4   13.6    18.6
                  Max Temp. (◦ C)   35.8    33.9     31     28.9    19.6     15.4   15.9    16.9   21.2    27    27.9    33.8
   TARC19          Rainfall (mm)     58     16.8    17.6      0     18.6      5.8    9.8     3.2    5.4    2.2   20.2     2.4
                  Irrigation (mm)    0       60      60      49      24        0     25      20     30      0      0       0
                  Min Temp. (◦ C)   24.6    19.8     18     14.5     8.6       5     5.2     3.6    7.8   12.9   15.5    19.6
                  Max Temp. (◦ C)   39.7    34.2    31.9    28.2    21.5     17.9   18.3    19.2   24.3   29.1   30.7    36.4
   WWAI19          Rainfall (mm)    25.5    11.4    39.7     23     53.9     44.3   25.5    18.4    19    8.7    54.9    7.7
                  Irrigation (mm)    0       0        0      15       0        0      0       0      0      0      0       0
                  Min Temp. (◦ C)   22.1    16.7    15.2    11.4     6.3      2.8    3.6     1.1    3.8    8.1   11.4    15.9
                  Max Temp. (◦ C)    38     31.8    28.6     25     17.7     14.5    14     14.4   19.9   26.1   27.3     34
    LFS19          Rainfall (mm)    10.6    28.4    14.8    33.4     34      37.4   28.8    13.2   13.2     7    41.2     4.9
                  Irrigation (mm)    0       0        0     200       0        0      0       0      0      0      0       0
                  Min Temp. (◦ C)   21.9    17.1    15.5     12      6.7      3.2    4.2     1.6    4.9    9.4   12.2    16.7
                  Max Temp. (◦ C)   38.9     33     30.1    26.1     19      15.4   14.9    15.8   21.4   27.6   28.6    34.6

                                     Southern and central western NSW had low autumn and growing season rainfall in
                                2018 and 2019. At TARC the long-term average growing season (April–October) rainfall is
                                248 mm, but only 137 and 45 mm was received in 2018 and 2019, respectively. At WWAI
                                the long-term average growing season rainfall is 322 mm, but only 153 and 193 mm was
                                received in 2018 and 2019, respectively. Likewise, the 87 mm of growing season rainfall
                                received at LFS (6 km from YAI) in 2018 was well below the 193 mm long term average,
                                but improved in 2019 to 160 mm. All experiments received supplementary irrigation to
                                maintain them considering the very dry conditions. The LFS experiments received the most
                                supplementary irrigation (244 and 220 mm in 2018 and 2019, respectively).

                                2.2. Plant Material and Experimental Conditions
                                       Varieties (genotypes) were selected based on their diverse characteristics, including
                                 maturity classification, adaptation to the agroecological zones and disease resistance. In
                                 total, nine chickpea genotypes were examined: the desi varieties PBA Striker, PBA Slasher,
                                 PBA Boundary, PBA HatTrick, Neelam and CBA Captain (previously reported/known
                                 as breeding line CICA1521) and the kabuli varieties, GenesisTM 079, GenesisTM 090 and
                                 GenesisTM Kalkee. Seven of these genotypes were common across the three regions and
                                 two years, as PBA HatTrick replaced Neelam in 2019. Four sowing dates (SD) were used to
                                 identify the optimal sowing period, timed to coincide with ‘very early’ (SD1), ‘early’ (SD2),
                                ‘timely’ (SD3) and ‘late’ (SD4) sowing practices.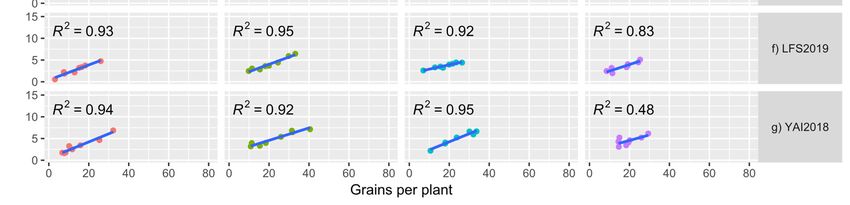
Agronomy 2022, 12, 160                                                                                            4 of 16

                              Each experiment was established as a split-block design with three replicates, with
                         sowing date as main plots and varieties as subplots. In both years, the experiments were
                         sown with a five (TARC) or six-row cone seeder, at 3–5 cm depth. The row spacing was
                         0.33 m at TARC, 0.3 m at WWAI and 0.25 m at both LFS and YAI. The area of each plot
                         was 16.5 m2 at TARC, 21.6 m2 at WWAI, 15 m2 at LFS and YAI. All experiments had a
                         target sowing density of 40 plants/m2 . At sowing, a Rhizobium group N inoculant (New
                         Edge Microbials), was made into a water slurry and injected into the furrow at a rate
                         of 50 L/ha. Local management practices, including hand chipping and application of
                         registered herbicides, fungicides and pesticides, were used to maintain the plots free of
                         weeds and diseases.

                         2.3. Measurements at Physiological Maturity
                              Plant height was measured in situ, from the base to the top of the plant, with five
                         plants randomly measured within each plot at maturity. At harvest, two 1 m2 quadrats
                         were cut from the inner rows and at least 1 m from the end of each plot [22]. These samples
                         were dried at 72 ◦ C for at least 48 h. Total above ground biomass (t/ha), grain yield (t/ha),
                         harvest index (HI), grain number and weight (g) were calculated from the dried quadrat
                         samples. Harvest index was calculated as grain yield/total shoot dry weight. In addition,
                         10 plants were taken at random from each plot to measure and/or count plant components
                         including: top and bottom pod height, number of filled/unfilled (viable/unviable) pods,
                         total pods, pod weight, branch number, grain number and grains per pod. These were
                         expressed on a per plant basis.

                         2.4. Statistical Analyses
                              Statistical analysis was performed using the REML linear model algorithm of GenStat
                         19th Edition [23]. The effects of sowing date, genotype and their interaction were tested
                         separately for each environment, as the datasets were unbalanced among environments.
                         The multi environment correlation of the 14 traits measured in this study was analysed.
                         The contribution of the yield components to grain yield on per plant basis was assessed by
                         simple linear regression, with yield as the response variant and the yield components as
                         explanatory variants. The predicted means, generated by the REML linear model algorithm,
                         for grain yield were used to test the environmental correlations, genotype-by-environment
                         (G × E) interactions and genotype adaptability/stability using the additive main effects
                         and multiplicative interaction (AMMI) model. Furthermore, the predicted means were
                         used to characterise the environments using the genotype main effects (G) and genotype-
                         by-environment interaction (G × E) GGE model.

                         3. Results
                         3.1. Correlation between Traits
                              Significant positive phenotypic correlations were observed between biomass and
                         yield-related traits (Table 2). The strongest positive correlations (r > 0.70) were between pod
                         number with branch number and filled pods. The number of filled pods was correlated
                         with both grains per plant and grain yield per plant. Plant height was correlated with both
                         bottom and top pod heights, while biomass was strongly correlated with both plant height
                         and top pod height. Bottom and top pod heights were correlated with each other. Pod
                         number per plant was correlated with both grains per plant and grain yield per plant. The
                         number of grains per plant was correlated with both grain yield per plant and overall grain
                         yield, with both these traits also correlated.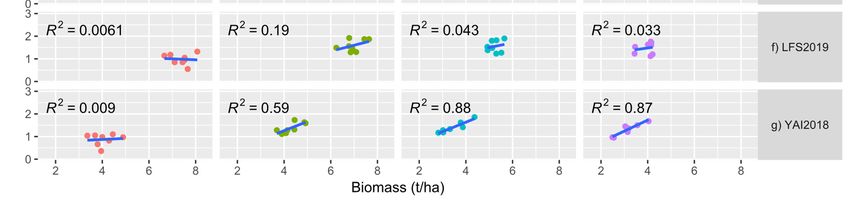
Agronomy 2022, 12, 160                                                                                                           5 of 16

                                  Table 2. Multi-environment phenotypic correlation coefficients for biomass- and yield-related traits.

       Branch Number (BN)            -
      Dry matter (DM) (t/ha)       0.19      -
    Filled pods per plant (FPP)    0.69    0.16      -
  100 grain weight (100 GW) (g)    0.18    −0.09   −0.07   -
         Harvest index (HI)        0.22    −0.38   0.53  0.08          -
      Plant height (PH) (cm)       −0.05   0.73    0.00  −0.35       −0.45     -
  Bottom pod height (BPH) (cm)     −0.23   0.58    −0.25 −0.33       −0.50   0.78     -
    Top pod height (TPH) (cm)      0.06    0.81    0.15  −0.29       −0.35   0.88   0.78      -
   Pod number per plant (PNP)      0.70    0.23    0.99  −0.04       0.49    0.03   −0.22   0.19    -
      Grains per plant (GPPl)      0.67    0.26    0.92  −0.01       0.51    0.06   −0.18   0.24   0.93     -
       Grains per pod (GPP)        0.27    0.14    0.15  0.22        0.17    0.03   −0.04   0.08   0.18   0.40    -
   Grain yield per plant (GYP)     0.68    0.34    0.85  0.08        0.49    0.07   −0.13   0.27   0.88   0.93   0.41  -
  Unfilled pods per plant (UPP)    0.42    0.46    0.43  0.17        0.07    0.18   0.02    0.31   0.58   0.52   0.22 0.56  -
      Grain yield (GY) (t/ha)      0.42    0.42    0.67  0.04        0.64    0.11   −0.07   0.29   0.69   0.74   0.33 0.81 0.47 -
                                   BN      DM      FPP 100 GW         HI     PH     BPH     TPH    PNP    GPPl   GPP GYP UPP GY

                                        Moderate correlations (r = 0.50–0.69) were observed between branch number with
                                  filled pods, grains per plant and grain yield per plant. There was also moderate correlation
                                  between bottom pod height and dry matter. Filled pod number was moderately correlated
                                  with total grain yield and harvest index. Harvest index was correlated positively with
                                  grains per plant and negatively with bottom pod height. The number of unfilled pods was
                                  correlated with pod number, grains per plant and grain yield per plant, while pod number
                                  was correlated with number of unfilled pods.

                                  3.2. Biomass and Related Traits
                                       In both years, harvest index, above ground biomass, plant and bottom pod height all
                                  varied with sowing date (Table 3; Supplementary Tables S1–S7). Genotypes, sowing date
                                  and their interactions were all sources of variation for the measured traits.
                                       Harvest index increased with delayed sowing at all locations across both years, ranging
                                  from 0.22 at YAI to 0.55 at LFS (during 2018) and 0.04 at WWAI to 0.44 at TARC (during
                                  2019). Genotype-by-sowing date (G × SD) interactions were significant at only the WWAI
                                  and YAI locations during 2018 and at all the locations during 2019.
                                       Later sowing resulted in lower biomass across both years. In 2018, biomass accumu-
                                  lated from the earliest and latest sowing dates ranged from 2.35 t/ha (SD4 at WWAI) to
                                  7.66 t/ha (SD1 at LFS), and in 2019, from 1.95 t/ha (SD4 at WWAI) to 7.36 (SD1 at LFS). G
                                  × SD interactions for biomass were only found at WWAI during 2019.
                                       Later sowing reduced plant height at most locations across both years. In 2018, plant
                                  height ranged from 35.64 cm at WWAI (SD4) to 57.89 cm at LFS (SD1), with no differences
                                  at YAI. Plant height was not measured at TARC. In 2019, plant height ranged from 36.99 cm
                                  at WWAI (SD4), to 63.63 cm at LFS (SD1). Across both years, only WWAI had a significant
                                  G × SD interaction for plant height.
                                       Bottom pod height was lowered by delayed sowing across both years. In 2018, this
                                  ranged from 18.78 cm at TARC (SD3) to 33.05 cm at LFS (SD1). In 2019, this ranged from
                                  21.47 cm for SD4 at TARC to 41.62 cm for SD1 at LFS. Across both years, G × SD interactions
                                  for bottom pod height were only found at WWAI in 2019. Branch number was affected by
                                  sowing date only at WWAI2018, WWAI2019 and LFS2019, with more branches at earlier
                                  sowing times and lowest in the later-sown treatment (SD4).
Agronomy 2022, 12, 160 6 of 16
Table 3. Effect of sowing date on chickpea architecture and biomass accumulation. The values in
the table are the mean values predicted by linear modelling. Means followed by the same letter
are not significantly different. TARC18 = Trangie Agricultural Research Centre 2018 experiment;
WWAI18 = Wagga Wagga Agricultural Institute 2018 experiment; LFS18 = Leeton Field Station 2018
experiment; YAI18 = Yanco Agricultural Institute 2018 experiment; TARC19 = Trangie Agricultural
Research Centre 2019 experiment; WWAI19 = Wagga Wagga Agricultural Institute 2019 experiment;
and LFS19 = Leeton Field Station 2019 experiment.
Branch Number Bottom Pod Top Pod Plant Height Biomass Harvest
Experiment Sowing Date
per Plant Height (cm) Height (cm) (cm) (t/ha) Index
TARC18 SD1 5.29 20.26 38.33 b - 3.87 0.34
SD2 5.24 19.37 34.82 a - 3.25 0.33
SD3 6.07 18.78 38.64 b - 2.99 0.37
SD4 4.73 19.24 36.99 ab - 2.52 0.40
p-value ns ns * - ns ns
TARC19 SD1 5.39 31.70 b 49.97 b 52.71 b 5.45 c 0.34 a
SD2 4.84 28.31 b 45.67 b 55.47 b 4.69 bc 0.41 bc
SD3 4.38 24.16 a 38.06 a 45.49 a 3.82 ab 0.39 b
SD4 4.64 21.47 a 33.73 a 39.99 a 3.24 a 0.44 c
p-value ns *** *** *** *** ***
WWAI18 SD1 9.02 c 27.69 d 42.91 c 45.37 c 3.49 c 0.35 a
SD2 8.53 c 25.90 c 42.03 c 45.19 c 3.23 c 0.41 b
SD3 6.55 b 23.30 b 35.62 b 39.25 b 2.91 b 0.48 c
SD4 5.49 a 21.50 a 31.96 a 35.64 a 2.35 a 0.51 c
p-value *** *** *** *** *** ***
WWAI19 SD1 6.31 d 33.42 d 43.80 d 51.71 d 4.58 d 0.04 a
SD2 5.79 c 29.46 c 44.15 c 47.35 c 3.53 c 0.17 b
SD3 4.48 b 27.20 b 39.74 b 42.13 b 2.69 b 0.31 c
SD4 3.55 a 24.56 a 34.28 a 36.99 a 1.95 a 0.38 d
p-value *** *** *** *** *** ***
LFS18 SD1 11.73 33.05 c 58.01 d 57.89 c 7.66 d 0.29 a
SD2 10.92 30.24 b 49.77 c 47.21 b 5.85 c 0.38 b
SD3 10.47 27.07 a 46.87 b 45.83 b 5.01 b 0.49 c
SD4 10.91 25.55 a 44.31 a 42.61 a 4.38 a 0.55 d
p-value ns *** *** *** *** ***
LFS19 SD1 4.74 b 41.62 d 63.11 d 63.63 d 7.36 d 0.13 a
SD2 5.39 c 37.09 c 57.97 c 58.21 c 6.97 c 0.23 b
SD3 4.41 ab 29.77 b 48.91 b 48.38 b 5.23 b 0.30 c
SD4 4.00 a 25.05 a 41.53 a 41.75 a 3.96 a 0.37 d
p-value *** *** *** *** *** ***
YAI18 SD1 9.47 20.93 a 35.53 35.69 4.05 c 0.22 a
SD2 10.33 19.66 a 38.65 39.61 4.31 c 0.32 b
SD3 7.42 20.18 a 35.78 41.15 3.53 b 0.41 c
SD4 5.12 24.36 b 36.22 37.76 2.95 a 0.41 c
p-value ns * ns ns *** ***
- = missing data/not measured, ns = not significant, * = p < 0.05, *** = p < 0.001.
3.3. Yield and Yield Components
Yield and yield components responded to variation in sowing date across locations
in both years (Table 4; Supplementary Tables S1–S7). The main effects of genotypes and
sowing date, together with their interactions, were all sources of variation for the measured
traits.Agronomy 2022, 12, 160 7 of 16
Table 4. Effect of sowing date on chickpea yield and yield components. The values in the table are the
mean values predicted by the linear modelling. Means followed by the same letter are not significantly
different. TARC18 = Trangie Agricultural Research Centre 2018 experiment; WWAI18 = Wagga
Wagga Agricultural Institute 2018 experiment; LFS18 = Leeton Field Station 2018 experiment; YAI18
= Yanco Agricultural Institute 2018 experiment; TARC19 = Trangie Agricultural Research Centre 2019
experiment; WWAI19 = Wagga Wagga Agricultural Institute 2019 experiment; and LFS19 = Leeton
Field Station 2019 experiment.
Sowing Filled Pods Unfilled Pods Pods per Grains per Grains per 100 Grain Grain
Experiment
Date per Plant per Plant Plant Pod Plant Weight (g) Yield (t/ha)
TARC18 SD1 32.6 10.2 a 42.8 a 1.1 38.5 22.9 1.302
SD2 23.6 5.9 b 29.5 b 1.2 27.5 23.0 1.071
SD3 27.8 4.1 b 31.8 b 1.2 34.3 23.5 1.095
SD4 25.1 3.7 b 28.8 b 1.3 32.0 23.23 1.001
p-value ns *** * ns ns ns ns
TARC19 SD1 15.2 4.0 19.2 1.2 18.1 23.7 a 1.868 a
SD2 15.5 3.2 18.7 1.3 19.6 23.3 a 1.903 a
SD3 15.1 3.5 18.5 1.2 18.9 21.9 b 1.473 b
SD4 15.3 3.6 18.9 1.2 18.8 20.7 c 1.438 b
p-value ns ns ns ns ns *** *
WWAI18 SD1 22.8 bc 1.7 a 24.6 bc 0.9 a 19.1 a 22.2 1.216
SD2 25.6 c 1.8 a 27.4 bc 0.9 a 23.3 b 22.3 1.306
SD3 20.4 ab 1.4 ab 21.8 a 1.0 ab 19.5 a 22.3 1.377
SD4 17.0 c 1.1 b 18.1 ab 1.1 b 18.8 a 22.0 1.209
p-value ** * ** * * ns ns
WWAI19 SD1 4.6 a 0.5 5.0 a 1.2 a 4.7 a 5.0 a 0.173 a
SD2 9.9 b 1.0 10.9 b 1.1 ab 10.3 b 15.9 b 0.600 b
SD3 12.6 c 1.0 13.6 c 1.0 ab 13.6 c 17.5 c 0.812 c
SD4 10.6 b 1.4 12.0 bc 1.0 b 12.4 c 15.8 b 0.747 d
p-value *** ns *** *** *** *** ***
LFS18 SD1 34.0 7.0 b 41.0 b 1.3 a 43.1 25.1 a 2.221 a
SD2 28.6 4.7 a 33.3 a 1.4 ab 39.2 26.2 b 2.190 a
SD3 28.8 4.0 a 32.8 a 1.4 ab 39.5 26.1 b 2.422 b
SD4 29.7 3.7 a 33.4 a 1.5 b 42.5 26.0 b 2.335 ab
p-value ns *** ** *** ns *** *
LFS19 SD1 10.1 a 2.7 12.8 a 1.0 13.4 a 21.5 0.983 a
SD2 15.0 b 3.4 18.4 b 1.1 20.3 b 20.8 1.593 b
SD3 13.7 b 3.7 17.5 b 1.0 18.0 b 23.8 1.552 b
SD4 13.4 ab 3.3 16.7 ab 1.0 17.2 ab 21.2 1.475 b
p-value * ns * ns * ns ***
YAI18 SD1 11.2 2.8 14.0 a 1.3 14.8 a 18.1 b 0.871 a
SD2 17.2 4.5 21.6 b 1.3 23.2 b 17.5 b 1.384 bc
SD3 - - - - - 16.3 a 1.439 c
SD4 14.6 2.1 16.7 ab 1.4 19.7 ab 15.2 a 1.225 ab
p-value ns ns * ns * ** ***
- = missing data/not measured; ns = not significant; * = p < 0.05; ** = p < 0.01; *** = p < 0.001.
3.3.1. Mean Grain Yield
Very low rainfall led to low grain yield, LFS2018 being an exception with the highest
yields of any location/year combination (location mean yield 2.29 t/ha) as compared
with WWAI2019 the lowest (location mean yield 0.59 t/ha). Grain yield was impacted
by sowing date at all locations/years except WWAI and TARC during 2018. The highest
yield occurred at LFS during 2018, with 2.4 t/ha from SD3, and the lowest at WWAI during
2019 with 0.173 t/ha from SD1. Generally, at southern NSW locations the greatest yields
were from SD3, whereas earlier sowing (SD1 and SD2) produced greater yields in central
NSW. The highest yielding varieties across this study were PBA Slasher, PBA Striker, PBA
Boundary and CBA Captain at almost all location/year combinations, with the exceptions
of PBA Boundary and PBA Slasher at WWAI2019 and PBA Boundary at LFS during 2019Agronomy 2022, 12, 160 8 of 16
and YAI2018. The other varieties, GenesisTM 079, GenesisTM 090, GenesisTM Kalkee and
Neelam, were generally low yielding, with the exception of GenesisTM 079 at TARC and
LFS during 2018. G × SD interactions were found at WWAI, LFS, and YAI during 2018,
and only TARC during 2019.
3.3.2. Pod Number and Pod Fill
Pod number was affected by sowing date at most locations during 2018 and 2019
(except TARC in 2019), with a general trend of more pods developing from earlier sowing
(SD1 and SD2) except WWAI in 2019 that had highest pods at SD3. The highest pod number
occurred at TARC in 2018 (42.8 pods per plant in SD1) and the lowest at WWAI in 2019
(5.0 pods per plant from SD1). Filled pod number was only affected by sowing date at
WWAI (both years) and LFS during 2019, whereas the unfilled pod number was affected at
all locations except YAI during 2018, and at no location in 2019. Generally, grains per pod
had a negative correlation with pod number across sowing dates at all locations. At TARC
in 2018, pod number and unfilled pods were highest at SD1, with no differences in filled
pod number, but with significant G × SD interactions for all three traits. There were also
no differences in grains per pod, 100 grain weight and grain yield per plant, though they
showed G × SD interactions. This was in contrast to the results from the following year,
which showed that sowing date had no effect on filled, unfilled, total pod numbers, grains
per pod and grains per plant and there were no G × SD interactions. However, sowing
date affected grain weight which ranged from 20.69 (SD4) to 23.65 g (SD1), though there
were no G × SD interactions.
At WWAI in 2018, late sowing decreased the total number of pods, filled and unfilled
pod numbers but increased number of grains per pod, but had no effect on grain weight.
This was in contrast to the results from 2019, which had higher filled pod and pod numbers
later in the season (SD3 and SD4). No differences were found for unfilled pod numbers
in 2019, but grain weight and grains per plant were significantly different across sowing
dates.
At LFS in 2018, pod numbers and unfilled pod numbers were highest in the earliest
sown treatment, but no differences were found for the number of filled pods. However,
the number of grains per pod increased as sowing was delayed. In 2019, this was reversed,
with SD1 recording the lowest filled pod number, total pod number and grains per plant
and SD2 the highest filled pod number, total pod number and grains per plant.
No significant differences were found for filled and unfilled pod numbers or grains
per pod across sowing dates at YAI in 2018, although total pod number, grains per plant
and grain weight were highest in SD2.
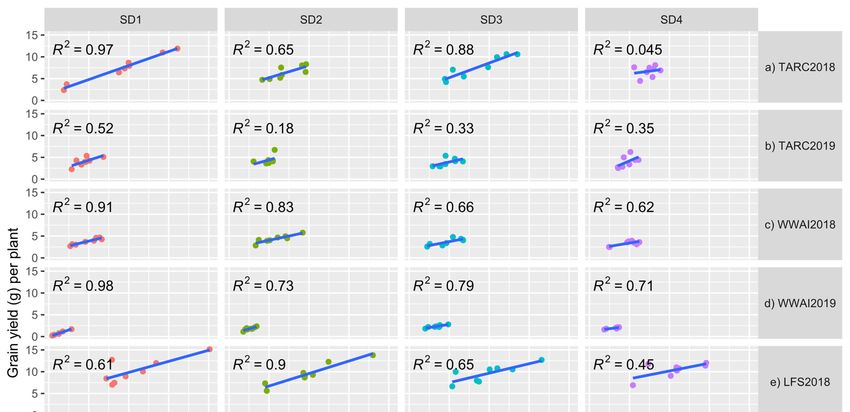
3.4. Contribution of Yield Components to Final Grain Yield
The various yield components when regressed towards final grain yield differed on
their contribution on a per plant basis across experiments and sowing dates. Grain number
accounted for most of the variation (84.9%), followed by pod number (78.3%), with grains
per pod contributing the least (29.2%). The relationship between grain yield per plant
and grain number was explored and showed positive correlations in all the experiments
(Figure 1a–g). At TARC, there was a high correlation between grain number and grain yield
per plant in 2018 except for SD4 (R2 = 0.045), with SD1 having R2 = 0.97 value. However, in
2019 at TARC the correlations were low with a high of R2 = 0.52 in SD1. At WWAI in both
years the R2 values were large, ranging from 0.62 for SD4 in 2018 to 0.98 for SD1 in 2019.
At LFS and YAI the correlations were high except for SD4 in 2018, with R2 = 0.45 and 0.48,
respectively.plant and grain number was explored and showed positive correlations in all the experi-
ments (Figure 1a–g). At TARC, there was a high correlation between grain number and
grain yield per plant in 2018 except for SD4 (R2 = 0.045), with SD1 having R2 = 0.97 value.
However, in 2019 at TARC the correlations were low with a high of R2 = 0.52 in SD1. At
WWAI in both years the R2 values were large, ranging from 0.62 for SD4 in 2018 to 0.98
Agronomy 2022, 12, 160 for SD1 in 2019. At LFS and YAI the correlations were high except for SD4 in 2018, 9with
of 16
R2 = 0.45 and 0.48, respectively.
Figure 1.
1. (a–g)
(a–g)Relationship
Relationshipofofgrain
grain number
number perper plant
plant withwith
graingrain
yieldyield (g/plant)
(g/plant) at sowing
at four four sowing
dates
dates
(SD) at Trangie (TARC), Wagga Wagga (WWAI), Leeton (LFS) and Yanco (YAI) during 2018 and 2018
(SD) at Trangie (TARC), Wagga Wagga (WWAI), Leeton (LFS) and Yanco (YAI) during 2019.
and 2019. (a) TARC2018;
(a) TARC2018; (b) TARC2019;
(b) TARC2019; (c) WWAI2018;
(c) WWAI2018; (d) WWAI2019;
(d) WWAI2019; (e) LFS2018;(e)(f) LFS2018;
LFS2019; (f)
(g) LFS2019;
YAI2018.
(g) YAI2018.
TARC18 TARC18
= Trangie = Trangie Research
Agricultural Agricultural Research
Centre Centre 2018 TARC19
2018 experiment; experiment; TARC19
= Trangie = Trangie
Agricultural
Agricultural Research Centre 2019 experiment; WWAI18 = Wagga Wagga Agricultural Institute
Research Centre 2019 experiment; WWAI18 = Wagga Wagga Agricultural Institute 2018 experiment;
2018 experiment; WWAI19 = Wagga Wagga Agricultural Institute 2019 experiment; LFS18 = Leeton
WWAI19 = Wagga Wagga Agricultural Institute 2019 experiment; LFS18 = Leeton Field Station 2018
Field Station 2018 experiment; LFS19 = Leeton Field Station 2019 experiment; and YAI18 = Yanco
experiment; LFS19
Agricultural = Leeton
Institute Field Station 2019 experiment; and YAI18 = Yanco Agricultural Institute
2018 experiment.
2018 experiment.
3.5. Relationship between Biomass and Grain Yield
3.5. Relationship between Biomass and Grain Yield
The
The correlation
correlation between
between total
total biomass
biomass and
and grain
grain yield
yield was
was highest
highest in the late-sown
in the late-sown
experiments
experiments (SD3 and/or SD4) in all the environments except for LFS (Figure 2a–g). Cor-
(SD3 and/or SD4) in all the environments except for LFS (Figure 2a–g). Cor-
relations
relations were
were mostly
mostly positive
positive except
except inin WWAI2018
WWAI2018 (SD1),
(SD1), WWAI2019
WWAI2019 (SD1(SD1 and
and SD2)
SD2)
LFS2018
LFS2018 (SD2
(SD2 and
andSD3) SD3)and
andLFS2018
LFS2018(SD1)(SD1) that showed
that showed negative correlation
negative between
correlation bi-
between
omass and grain yield. Correlations were generally low for LFS, which
biomass and grain yield. Correlations were generally low for LFS, which had very highhad very high bi-
omass
biomass ofof
upuptoto8 8t/ha forforsome
t/ha somevarieties,
varieties,ranging
rangingfrom
fromnonocorrelation
correlationfor
forSD3
SD3 in
in 2018
2018 to
to
moderately high correlation (R22 = 0.55) for SD4 in 2018.
moderately high correlation (R = 0.55) for SD4 in 2018.Agronomy 2022,
Agronomy 2022, 12,
12, 160
x FOR PEER REVIEW 10
10of 16
of 16
(a–g)Relationship
Figure 2. (a–g) Relationshipofoftotal
totalabove
above biomass
biomass (t/ha)
(t/ha) with
with grain
grain yieldyield (t/ha)
(t/ha) atsowing
at four four sowing
dates
(SD) at(SD)
dates Trangie (TARC),
at Trangie Wagga
(TARC), Wagga
Wagga (WWAI),
Wagga Leeton
(WWAI), (LFS)(LFS)
Leeton and Yanco
and Yanco(YAI)(YAI)
during 20182018
during and
2019. (a) TARC2018; (b) TARC2019; (c) WWAI2018; (d) WWAI2019; (e) LFS2018;
and 2019. (a) TARC2018; (b) TARC2019; (c) WWAI2018; (d) WWAI2019; (e) LFS2018; (f) LFS2019; (f) LFS2019; (g)
YAI2018. TARC18 = Trangie Agricultural Research Centre 2018 experiment; TARC19
(g) YAI2018. TARC18 = Trangie Agricultural Research Centre 2018 experiment; TARC19 = Trangie = Trangie Ag-
ricultural Research
Agricultural Centre
Research 2019
Centre 2019experiment;
experiment;WWAI18
WWAI18= =Wagga
WaggaWagga
WaggaAgricultural
Agricultural Institute
Institute 2018
2018
experiment; WWAI19 = Wagga Wagga Agricultural Institute 2019 experiment; LFS18 = Leeton Field
experiment; WWAI19 = Wagga Wagga Agricultural Institute 2019 experiment; LFS18 = Leeton Field
Station 2018 experiment; LFS19 = Leeton Field Station 2019 experiment; YAI18 = Yanco Agricultural
Station 2018 experiment; LFS19 = Leeton Field Station 2019 experiment; YAI18 = Yanco Agricultural
Institute 2018 experiment.
Institute 2018 experiment.
3.6. Environmental
3.6. Environmental Correlations
Correlations
An additive main effects and
An additive main effects and multiplicative
multiplicative interactions
interactions (AMMI)
(AMMI) biplot
biplot provides
provides aa
visual representation of genotype performance and environmental
visual representation of genotype performance and environmental correlations for correlations for grain
grain
yield (Figure 3). Both PCA1 and PCA2 are significant at the 0.001 level, with
yield (Figure 3). Both PCA1 and PCA2 are significant at the 0.001 level, with the PC1 axis the PC1 axis
explaining 49% and the PC2 axis explaining 41.3% of the G × E interaction sum
explaining 49% and the PC2 axis explaining 41.3% of the G × E interaction sum of squares. of squares.
Together, these
Together, these two
two principal
principal components
components explained
explained 90.3%
90.3% ofofthetheGG×× EE interaction.
interaction. The
The
genotypes did
genotypes did not
not cluster
cluster together
together in
in the
the AMMI biplot, but
AMMI biplot, but some
some environments
environments did,did, such
such
as WWAI2018
as WWAI2018 and and WWAI2019.
WWAI2019. ThereThere was
was no
no correlation
correlation between
between TARC2018 with either
TARC2018 with either
LFS2018 or YAI2018, and a negative correlation between TARC2018 and the rest of the
environments. There
There waswas a positive correlation
correlation between
between WWAI2018/WWAI2019
WWAI2018/WWAI2019 with
LFS2019, and aa negative
both YAI2018 and LFS2019, negative one
one with
with LFS2018
LFS2018 and and TARC2019.
TARC2019. LFS2018
was positively corelated with TARC2019, uncorrelated with LFS2019 and TARC2018, and
negatively correlated with the rest of the environments. Varieties PBA Slasher and PBA
Striker were closer to thethe origin
origin and GenesisTM
and Genesis TM 090
090 and
and PBA
PBA Boundary were further from
the origin. Environments in southern NSW (WWAI2018/2019, LFS2018/2019 LFS2018/2019and andYAI2018)
YAI2018)
the origin
were closer to the origin than
than the
the central
central western
western NSW
NSW environments
environments (TARC2018/2019).
(TARC2018/2019).
Southern NSW environments followed a general trend of positive interactions with
GenesisTM 090 and GenesisTM Kalkee and negative interactions with PBA Striker and PBAtive interaction with Genesis 090 and Genesis Kalkee and positive interaction with
PBA Striker and PBA Slasher). The only consistent interactions in the central western en-
vironment were a positive interaction with PBA Slasher, and negative interactions with
GenesisTM 090 and GenesisTM Kalkee across both 2018 and 2019. Strong positive interac-
tions were found with TARC2019 and GenesisTM 079, and WWAI2018 and WWAI2019 and
Agronomy 2022, 12, 160 GenesisTM Kalkee. Despite the differences in environment and years, the AMMI analysis11 of 16
demonstrated that TARC2019 and LFS2018 influenced genotypes in a similar manner.
Figure
Figure AAMI
3.3.AAMI biplot
biplot forfor grain
grain yield
yield showing
showing thecorrelation
the correlationbetween
between environments
environments and
and overall
overall
genotype
genotype stability
stability andand adaptability.
adaptability. At origin
At origin GEI GEI = 0. Acute
= 0. Acute angle angle = positive
= positive correlation;
correlation; right
right angle
= no correlation
angle and obtuse
= no correlation andangle = negative
obtuse angle = correlation. TARC18 = TARC18
negative correlation. Trangie Agricultural Research
= Trangie Agricultural
Centre 2018
Research experiment;
Centre TARC19 TARC19
2018 experiment; = Trangie Agricultural
= Trangie Research
Agricultural Centre
Research 2019
Centre experiment;
2019 experiment;
WWAI18
WWAI18= =Wagga
WaggaWagga
WaggaAgricultural
AgriculturalInstitute
Institute2018
2018 experiment;
experiment; WWAI19
WWAI19 = = Wagga WaggaAgricul-
Wagga Wagga Agri-
cultural Institute2019
tural Institute 2019experiment;
experiment; LFS18
LFS18 = Leeton
= Leeton Field
Field Station
Station 20182018 experiment;
experiment; LFS19
LFS19 = Leeton
= Leeton Field
Field Station 2019 experiment; and YAI18 = Yanco Agricultural Institute 2018 experiment.
Station 2019 experiment; and YAI18 = Yanco Agricultural Institute 2018 experiment.
ASouthern
‘which-won-where’ analysis divided
NSW environments followedthe seven environments
a general into interactions
trend of positive three mega en-with
vironments
GenesisTM(Figure
090 and4). TARC2018
Genesis formed
TM Kalkee one
and mega environment
negative on itsPBA
interactions with ownStriker
(ME1);anda sec-
PBA
ond mega environment contained LFS2018, LFS2019 and TARC2019 (ME2); the
Slasher based on the projection of genotype onto the environmental axis. The exception final mega
environment
to this trendcontained WWAI2018,
was LFS2018, with anWWAI2019 and YAI2018
inverse response (ME3). for
for interaction No these
variety per-
varieties
formed well in ME1; Genesis TM 079 TM
and PBA Slasher were
TM the best-performing
(negative interaction with Genesis 090 and Genesis Kalkee and positive interaction varieties
inwith
ME2; PBA
PBA Striker
Striker and
and PBA
PBA Captain
Slasher). (CICA1521)
The performed
only consistent best ininME3.
interactions PBA Bound-
the central western
ary, GenesisTM were
environment 090 and Genesisinteraction
a positive TM Kalkee were not suited to any specific mega environ-
with PBA Slasher, and negative interactions with
GenesisTM 090 and GenesisTM Kalkee across both 2018 and 2019. Strong positive interac-
ment.
tions were found with TARC2019 and GenesisTM 079, and WWAI2018 and WWAI2019 and
GenesisTM Kalkee. Despite the differences in environment and years, the AMMI analysis
demonstrated that TARC2019 and LFS2018 influenced genotypes in a similar manner.
A ‘which-won-where’ analysis divided the seven environments into three mega en-
vironments (Figure 4). TARC2018 formed one mega environment on its own (ME1); a
second mega environment contained LFS2018, LFS2019 and TARC2019 (ME2); the final
mega environment contained WWAI2018, WWAI2019 and YAI2018 (ME3). No variety
performed well in ME1; GenesisTM 079 and PBA Slasher were the best-performing varieties
in ME2; PBA Striker and PBA Captain (CICA1521) performed best in ME3. PBA Boundary,
GenesisTM 090 and GenesisTM Kalkee were not suited to any specific mega environment.Agronomy
Agronomy2022,
2022,12,
12,x160
FOR PEER REVIEW 1212ofof16
16
GGE biplot
Figure4.4. GGE
Figure biplot for
for grain
grainyield
yieldshowing
showingdifferent vectors
different and
vectors three
and mega
three environments
mega andand
environments vari-
ety performance
variety performance in the
in respective vectors
the respective and mega
vectors environments.
and mega The overlapping
environments. environments
The overlapping environ-in
ME3 are
ments YAI2018,
in ME3 WWAI2019
are YAI2018, and WWAI2019.
WWAI2019 TARC18 =TARC18
and WWAI2019. Trangie Agricultural Research Centre
= Trangie Agricultural 2018
Research
Centre 2018 TARC19
experiment; experiment; TARC19
= Trangie = Trangie
Agricultural Agricultural
Research CentreResearch Centre 2019
2019 experiment; experiment;
WWAI18 = Wagga
WWAI18 = Wagga Wagga
Wagga Agricultural Agricultural
Institute Institute 2018
2018 experiment; experiment;
WWAI19 = Wagga WWAI19
Wagga= Agricultural
Wagga Wagga Agri-
Institute
cultural Institute 2019 experiment; LFS18 = Leeton Field Station 2018 experiment; LFS19
2019 experiment; LFS18 = Leeton Field Station 2018 experiment; LFS19 = Leeton Field Station 2019= Leeton
Field Station 2019 experiment; and YAI18 = Yanco Agricultural Institute 2018 experiment.
experiment; and YAI18 = Yanco Agricultural Institute 2018 experiment.
4.4.Discussion
Discussion
AAwide
widesowing
sowingwindow
windowranging
rangingfromfrom mid-April
mid-April to to
end end
of of
May May tested
tested thethe effects
effects of
sowing date on chickpea biomass accumulation and overall yield in central westernwest-
of sowing date on chickpea biomass accumulation and overall yield in central and
ern and NSW
southern southern NSW environments.
environments. Varying
Varying sowing datesowing
to test date to test for adaptability
for adaptability in new poten- in
newproduction
tial potential production areas ortoresponse
areas or response to abiotic
abiotic stresses is astresses
commonly is a commonly adopted
adopted approach
approach [6,11,24–26].
[6,11,24–26]. Planting
Planting varieties at varieties
the optimum at the optimum
sowing timesowing time can
can minimise theminimise the
risk of envi-
risk of environmental stresses such as frost, heat and drought
ronmental stresses such as frost, heat and drought coinciding with sensitive growthcoinciding with sensitive
growthsuch
phases phases such as flowering
as flowering and podding
and podding that aretocritical
that are critical to yield formation
yield formation [20]. [20].
Genotype and sowing date were sources of variation for biomass
Genotype and sowing date were sources of variation for biomass accumulation and accumulation and
yield across locations and years. Previous observations have shown
yield across locations and years. Previous observations have shown that abiotic stresses that abiotic stresses
suchas
such asdrought
droughtand and heat
heat and
and the
the resultant
resultant G G ××EEinteraction
interactionstrongly
stronglyinfluence
influenceaacrop’s
crop’s
ability to develop and produce yields [7,27]. In our study, sowing earlier
ability to develop and produce yields [7,27]. In our study, sowing earlier than the current than the current
regional guidelines
regional guidelines and
and recommendations
recommendations(SD1) (SD1)resulted
resulted inin
taller plants
taller andand
plants higher biomass
higher bio-
accumulation but low harvest index, as the biomass did not translate
mass accumulation but low harvest index, as the biomass did not translate into greater into greater grain
production.
grain This This
production. illustrates weakweak
illustrates source-sink
source-sinkrelationships; the large
relationships; source
the large of biomass
source of bio-
not being translated into grain yield, with the limitation being
mass not being translated into grain yield, with the limitation being on the sink sideon the sink side of
of the
the
relationship. Source-sink relationships and the subsequent remobilisation and partitioning
of photo assimilates and nutrients into the developing grain influence final grain yield and
narrowing of the yield gap.Agronomy 2022, 12, 160 13 of 16
Harvest index is an indicator of efficiency of converting the source organs (fully devel-
oped leaves as components of biomass) into sink organs (developing grain as components
of yield) [28,29]. The low harvest index and poor correlation between biomass and grain
yield (Figure 2a–g) in earlier sown treatments was caused by early sown crops consuming
the limited and valuable resources such as water and nutrients during the vegetative phase
and subsequently suffering moisture stress during the pod fill stage. At harvest, soil water
in SD1 was lower than in SD4 (EM38 data not shown). This was most likely due to greater
water use by larger plants growing over a longer season. It was previously shown that the
growth duration is longer at late sowing dates in these environments [21]. However, this
low correlation between biomass and grain yield was not observed at TARC in 2018 due to
low plant density not using available soil water. Additionally, the dense canopy of large,
high biomass early sown crops reduces light penetration and shades the lower flowers, and
this has been shown to increase flower abortion in pulses [30] and therefore reduces grain
number and overall yield potential.
Biomass and yield at LFS were higher than at the other experiments. The importance
of water availability to yield is highlighted when comparing the LFS and YAI experiments.
These experiments were only 6 km apart and had very similar weather and environmental
conditions, which suggests that the 103 mm of extra supplementary irrigation was responsi-
ble for LFS accumulating more biomass and outyielding YAI by 1.06 t/ha (averaged across
sowing dates). These differences in supplementary irrigation also suggest that GenesisTM
090 may be drought susceptible, as it showed visual signs of stress such as yellowing and
crop wilting at the dry experiment (YAI) but not when more water was available (LFS).
The regression analysis showed that grain and pod number were the highest contributors
to yield. This confirms the close relationship between chickpea yield and grain number,
and by inference pod number [20]. It is widely accepted that grain number is more plastic,
responsive to environmental changes and easier to manipulate than grain size in most
crops [14,20,31–33]. High grain number was due to a high proportion of filled pods, or
fewer unfilled pods per plant. Unfavourable conditions such as severe frost when the
crop was at sensitive growth phases could account for most of the observed unfilled pods,
especially for the early sown treatments.
Generally, the desi varieties have been observed to display higher levels of tolerance to
abiotic stresses such as drought and heat than the kabuli varieties [5]. In agreement with this
observation, the desi varieties PBA Striker, PBA Slasher, PBA Boundary and CBA Captain
were the highest-yielding varieties in all the experiments (Supplementary Tables S1–S7).
The yield advantage of early flowering and maturing varieties [21] in stressful environments
was observed in this study with the fast flowering and maturing PBA Striker being the
highest-yielding variety at all experiment locations. This agrees with another study where
short-duration genotypes outyielded long-duration ones under heat stress [11]. When sown
in the optimum window, early varieties will mature before stored soil moisture is depleted
and before the onset of high temperature in late spring and/or early summer, which is
a common occurrence in the locations used in this study. Early flowering will increase
potential yield by using stored soil water during the reproductive phase to fill grain rather
than during the vegetative phase to grow biomass. Late-season heat stress can reduce
the potential yield, with losses estimated to be between 10% and 15% for every degree
increase in temperature above the optimum temperature range [26]. These late-season
high temperatures often coincide with moisture stress, which will reduce grain yield as
plants remobilise stored reserves to buffer the impact of these stresses [30]. This highlights
the importance of early–mid season maturity, especially during dry years in avoiding
late-season abiotic constraints.
The genotypes behaved differently across environments and demonstrated their di-
versity by not clustering together in the AMMI biplot (Figure 3). Varieties CBA Captain,
PBA Slasher and PBA Striker are closer to the origin, which shows that they are broadly
adapted and less sensitive to environmental changes, while PBA Boundary, GenesisTM
Kalkee, GenesisTM 090 and GenesisTM 079 are further from the origin, which demostratesAgronomy 2022, 12, 160 14 of 16
sensitivity to environmental interactions, and shows specific adaptation [34]. GenesisTM
Kalkee was consistently low yielding across environments and was in a sector which does
not include any specific mega environment (Figure 4). It is therefore likely not suited to the
environments of central western and southern NSW, or at least not during dry years. This
is possibly explained by its overall long growing season [21] which will likely expose it to
late-season soil water and heat stress.
The WWAI environments clustered together and influenced genotypes in a similar way
across the two years, as similar conditions and management practices were experienced
and/or applied. A higher positive correlation between the WWAI environments with
YAI2018 might partly be because of similar dry conditions, while correlation with both
YAI2018 and LFS2019 might also be due to similar climatic conditions because of geographic
proximity. However, lack of correlation with LFS2018 demonstrates that other confounding
factors such as irrigation, beyond climatic conditions and geographic proximity, also had an
effect. Differences between experiments are due to the diverse range of climates including
altitudes, watering regimes and soil types in the experimental locations. Year-on-year
variation was observed at TARC, where TARC2018 did not cluster with any environment,
including TARC2019, and formed its own mega environment (ME1). No variety performing
well in ME1. Dry conditions at TARC in 2018 created challenges with establishment and
overall plant density and this could have made this environment unique and unrelated to
TARC2019, which was in the same mega environment as the LFS environments. TARC2019,
like LFS2018 and LFS2019, received a significant amount of irrigation (175 and 87 mm
pre- and post-sowing, respectively) and this limited moisture stress might have driven
the similarities. This was possibly the case with the clustering of the WWAI and YAI
experiments as these received minimal irrigation during the season. At the other locations,
the year-on-year variation was minimal as the LFS and WWAI experiments fell into the
same mega environments across the two years. However, this study demonstrates the
importance and need to take year-on-year variation into consideration when interpreting
multi-year field studies.
5. Conclusions
The 2018 and 2019 seasons in southern and central western NSW were very chal-
lenging for growing chickpea due to low growing season rainfall. This study identifies
mid to the end of May as the optimum sowing time for chickpea in southern and central
western NSW agroecological zones, and pod and grain numbers as major drivers of yield
and overall adaptation. Sowing at this time maximises potential yield by increasing the
probability of avoiding/escaping stressful events such as winter frosts and late-season
drought and heat stress during critical growth phases. Harvest index was higher in smaller,
late-sown plants, indicating that when combined with early maturity they may have a com-
petitive advantage in water-limited environments. Given the indeterminate growth habit
of chickpea, the low harvest index and poor correlation between biomass and grain yield
observed in this study might not be as pronounced under more favourable seasonal condi-
tions. Moisture was important in environmental classifications, with the more irrigated
experiments (LFS2018, LFS2019 and TARC2019) falling into the same mega environment.
Similarly, the environments with limited irrigation (YAI2018, WWAI2018, and WWAI2019)
clustered together. The results of this study indicate a need for more multi-environmental
studies on chickpeas under Australian conditions to draw more detailed inferences and
comparisons.
Supplementary Materials: The following supporting information can be downloaded at: https:
//www.mdpi.com/article/10.3390/agronomy12010160/s1, Supplementary Figure S1a: Trangie
Agricultural Station climate 2018, Figure S1b: Trangie Ag-ricultural Research Centre climate 2019,
Figure S1c: Wagga Wagga Agricultural Institute climate 2018, Figure S1d: Wagga Wagga Agricultural
Institute climate 2019 (Supplementary Figure S1d), Figure S1e: Leeton Field Station and Yanco Agricul-
tural Institute climate 2018, Figure S1f: Leeton Field Station climate 2019. Table S1: ST1_TARC_2018,Agronomy 2022, 12, 160 15 of 16
Table S2: ST2_TARC_2019, Table S3: ST3_ WWAI_2018, Table S4: ST4_WWAI_2019, Table S5:
ST5_LFS_2018, Table S6: ST6_LFS_2019, Table S7: ST7_YAI_2018. Supplementary Tables S1–S7.xlsx.
Author Contributions: M.F.R. conceived the topic, acquired the funding, and oversaw the whole
study including coordinating data collection. A.L.P. and L.M. collected and analysed data; M.F.R.
designed the experiment; M.F.R., A.L.P. and L.M. wrote the manuscript. All authors contributed to
editing, revision and approval of the manuscript. All authors have read and agreed to the published
version of the manuscript.
Funding: This research was a joint investment between the NSW Department of Primary Industries
and Grains Research and Development Corporation (GRDC) under the Grains Agronomy and
Pathology Partnership (GAPP), with project title, ‘The adaptation of profitable pulses in the central
and southern zones of the northern grains region’. Project code: BLG112, March 2018 to June 2020,
awarded to MFR.
Acknowledgments: We thank Tony Napier, Leigh Jenkins and their technical staff at the Yanco
Agricultural Institute and Trangie Agricultural Research Centre respectively, for their assistance in
conducting and maintaining experiments. Also, thank you to Iain Hume, Muhuddin Anwar and
Tania Moore for providing useful comments and edits.
Conflicts of Interest: The authors declare no conflict of interest. The funders had no role in the design
of the study; in the collection, analyses or interpretation of data; in the writing of the manuscript or
in the decision to publish the results.
References
1. Jukanti, A.K.; Gaur, P.M.; Gowda, C.L.L.; Chibbar, R.N. Nutritional quality and health benefits of chickpea (Cicer arietinum L.): A
review. Brit. J. Nutr. 2012, 108, 11–26. [CrossRef]
2. Bampidis, V.A.; Christodoulou, V. Chickpeas (Cicer arietinum L.) in animal nutrition: A review. Anim. Feed Sci. Technol. 2011, 168,
1–20. [CrossRef]
3. FAOSTAT. 2020. Available online: https://faostat.fao.org/faostat/ (accessed on 14 November 2021).
4. Croser, J.S.; Clarke, H.J.; Siddique, K.H.M.; Khan, T.N. Low-temperature stress: Implications for chickpea (Cicer arietinum L.)
improvement. Crit. Rev. Plant Sci. 2003, 22, 185–219. [CrossRef]
5. Gaur, P.M.; Samineni, S.; Thudi, M.; Tripathi, S.; Sajja, S.B.; Jayalakshmi, V.; Mannur, D.M.; Vijayakumar, A.G.; Ganga Rao, N.V.P.R.;
Ojiewo, C.; et al. Integrated breeding approaches for improving drought and heat adaptation in chickpea (Cicer arietinum L.).
Plant Breed. 2019, 138, 389–400. [CrossRef]
6. Sadras, V.; Dreccer, M.F. Adaptation of wheat, barley, canola, field pea and chickpea to the thermal environments of Australia.
Crop Pasture Sci. 2015, 66, 1137–1150. [CrossRef]
7. Berger, J.D.; Turner, N.C.; Siddique, K.H.M.; Knights, E.J.; Brinsmead, R.B.; Mock, I.; Edmondson, C.; Khan, T.N. Genotype by
environment studies across Australia reveal the importance of phenology for chickpea (Cicer arietinum L.) improvement. Aust. J.
Agric. Res. 2004, 55, 1071–1084. [CrossRef]
8. Clarke, H.J.; Siddique, K.H.M. Response of chickpea genotypes to low temperature stress during reproductive development. Field
Crops Res. 2004, 90, 323–334. [CrossRef]
9. Devasirvatham, V.; Gaur, P.M.; Mallikarjuna, N.; Raju, T.N.; Trethowan, R.M.; Tan, D.K.Y. Reproductive biology of chickpea
response to heat stress in the field is associated with the performance in controlled environments. Field Crops Res. 2013, 142, 9–19.
[CrossRef]
10. Devasirvatham, V.; Gaur, P.M.; Mallikarjuna, N.; Tokachichu, R.N.; Trethowan, R.M.; Tan, D.K.Y. Effect of high temperature on
the reproductive development of chickpea genotypes under controlled environments. Funct. Plant Biol. 2012, 39, 1009–1018.
[CrossRef]
11. Devasirvatham, V.; Gaur, P.M.; Raju, T.N.; Trethowan, R.M.; Tan, D.K.Y. Field response of chickpea (Cicer arietinum L.) to high
temperature. Field Crops Res. 2015, 172, 59–71. [CrossRef]
12. Devasirvatham, V.; Tan, D.K.Y.; Gaur, P.M.; Raju, T.N.; Trethowan, R.M. High temperature tolerance in chickpea and its
implications for plant improvement. Crop Pasture Sci. 2012, 63, 419–428. [CrossRef]
13. Gaur, P.M.; Jukanti, A.K.; Varshney, R.K. Impact of genomic technologies on chickpea breeding strategies. Agronomy 2012, 2,
199–221. [CrossRef]
14. Sadras, V.O.; Slafer, G.A. Environmental modulation of yield components in cereals: Heritabilities reveal a hierarchy of phenotypic
plasticities. Field Crops Res. 2012, 127, 215–224. [CrossRef]
15. Wood, J.A.; Knights, E.J.; Harden, S.; Hobson, K.B. Seed quality and the effect of introducing Cicer echinospermum to improve
disease and pest resistance in desi chickpea. Legum. Sci. 2019, 1, e22. [CrossRef]
16. Pushpavalli, R.; Berger, J.D.; Turner, N.C.; Siddique, K.H.M.; Colmer, T.D.; Vadez, V. Cross-tolerance for drought, heat and salinity
stresses in chickpea (Cicer arietinum L.). J. Agron. Crop Sci. 2020, 206, 405–419. [CrossRef]You can also read