From the 1990s climate change has decreased cool season catchment precipitation reducing river heights in Australia's southern Murray Darling Basin
←
→
Page content transcription
If your browser does not render page correctly, please read the page content below
www.nature.com/scientificreports
OPEN From the 1990s climate change
has decreased cool season
catchment precipitation reducing
river heights in Australia’s southern
Murray‑Darling Basin
Milton S. Speer*, L. M. Leslie, S. MacNamara & J. Hartigan
The Murray-Darling Basin (MDB) is Australia’s major agricultural region. The southern MDB receives
most of its annual catchment runoff during the cool season (April–September). Focusing on the
Murrumbidgee River measurements at Wagga Wagga and further downstream at Hay, cool season
river heights are available year to year. The 27-year period April–September Hay and Wagga Wagga
river heights exhibit decreases between 1965 and 1991 and 1992–2018 not matched by declining
April-September catchment rainfall. However, permutation tests of means and variances of late
autumn (April–May) dam catchment precipitation and net inflows, produced p-values indicating a
highly significant decline since the early 1990s. Consequently, dry catchments in late autumn, even
with average cool season rainfall, have reduced dam inflows and decreased river heights downstream
from Wagga Wagga, before water extraction for irrigation. It is concluded that lower April–September
mean river heights at Wagga Wagga and decreased river height variability at Hay, since the mid-1990s,
are due to combined lower April–May catchment precipitation and increased mean temperatures.
Machine learning attribute detection revealed the southern MDB drivers as the southern annular
mode (SAM), inter-decadal Pacific oscillation (IPO), Indian Ocean dipole (IOD) and global sea-surface
temperature (GlobalSST). Continued catchment drying and warming will drastically reduce future
water availability.
The Murray-Darling River basin (MDB), located in southeastern Australia, is Australia’s most important agricul-
tural area, producing almost 40% of the national food s upply1. In comparison, the agricultural area of the central
valley of California provides approximately 20% of the total US food p roduction2. The extended drought condi-
tions since the mid-1990s in the MDB, comprising the Millennium Drought (1997–2009)3,4; and the 2017–2019
drought, have resulted in rivers running dry and low water storages, affecting communities, businesses, animals,
and the environment. The southern MDB, in which the Murrumbidgee River catchment is located (Fig. 1),
occupies a large geographical area of southeast Australia where the main growing season is in the cooler half of
the year (April-September)5. Most of the southern MDB in Victoria close to the Murrumbidgee River catchment
(Fig. 1) continues to suffer hydrological drought despite the easing of the meteorological Millennium Drought
in 20106.
Murrumbidgee river heights
To ensure the supply of precipitation-driven inflows, it is crucial to receive average or close to average rainfall
during the global warming period. In and around the Murrumbidgee catchment Burrinjuck Dam and Blowering
Dam receive 57%, Tumut 56%, Wagga Wagga 52% and Hay 52% of their annual average rainfall in this period.
Notably, stream flows have been declining across the MDB since the 1990s (Figs.2a,b).
School of Mathematical and Physical Sciences, University of Technology, Broadway, PO Box 123, Sydney, NSW 2007,
Australia. *email: Milton.Speer@uts.edu.au
Scientific Reports | (2021) 11:16136 | https://doi.org/10.1038/s41598-021-95531-4 1
Vol.:(0123456789)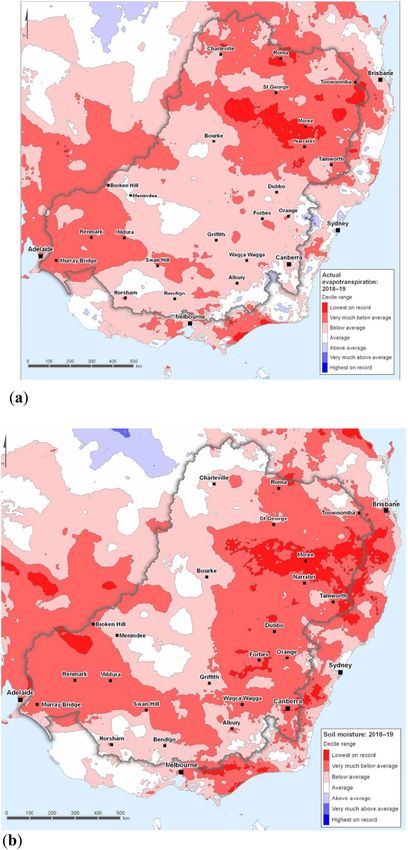
www.nature.com/scientificreports/
Figure 1. The Murrumbidgee River and catchment area. M Murrumbidgee irrigation area (hatched black),
C Colleambally irrigation area (hatched black). Snowy mountains hydroelectric scheme (hatched blue). The inset
identifies the catchment location in southeast Australia. Catchment area stations are Blowering Dam, Burrinjuck
Dam and Tumut (Created in Corel Paintshop Pro, Version 23.1.0.27).
Drying trends in the Murray‑Darling Basin
Aside from the 2017–2019 drought, the MDB previously experienced major multi-year droughts in 1997–2009
(Millennium Drought), 1938–1946 (World War II Drought) and 1895–1903 (Federation Drought). There are
downward trends in rainfall since the 1990s in southern parts of eastern Australia, and in the higher rainfall areas
of the MDB catchments that generally are located in the highlands of the Great Dividing R ange5. These trends
are concentrated in the cooler half of the year, from April to S eptember3. A major influence on this drying trend
has been the strengthening and extension of the subtropical high pressure ridge during winter, which shifts rain-
bearing weather systems southward5,6. Specifically, the lack of negative-phase Indian Ocean Dipole (IOD) events
has been identified as a contributing factor to the drying and resulting droughts in southeast Australia since the
1990s7, where the influence of the IOD is greatest in June–October8. Other important climate drivers of cool
season precipitation are the atmospheric-based southern annular mode (SAM), which in its positive phase is
also a major influence on the drying trend, by its association with rain-bearing systems shifting southward, away
from southern Australia3,4, and the basin-wide Pacific Ocean phenomenon, the inter-decadal Pacific oscillation
(IPO). These and other possible climate drivers are assessed in the Results Section, using Machine Learning
(ML) techniques to attribute identification.
Effect of regulation on river heights
Prior to the 1990s, the main regulation of the Murrumbidgee River upstream of Hay occurred over two periods
during which large storages were built. These are the Burrinjuck Dam in 1910–1927, which started filling dur-
ing the construction phase and Blowering Dam 1956–1961 (Figs. 1, 2c,d). Before the Burrinjuck Dam was built,
annual river flows at Hay followed a pattern of variability and quantity similar to annual river flows measured at
Wagga Wagga (Fig. 1). After the Burrinjuck Dam was built (1928), the water flows diverged in quantity although
their annual variability patterns c oincided9. After the Blowering Dam construction was completed in the 1960s,
the relationship between river flows at Wagga Wagga and Hay were affected. There were similar patterns of vari-
ability but there was a substantial difference in the quantity of water reaching Hay from Wagga Wagga, compared
with that before river r egulation9,10. It was concluded that there was a 56% reduction in the lower Murrumbidgee
River at H ay11, which occurred mostly after 1957 when there was a change point between low regulated flow
and highly regulated flow. Even after the 1957 change point, river flows were seasonal, driven by reliable winter
and spring rainfall, together with headwater ice and snow melt, and much of the flow reached the floodplain
below Hay11. However, there has been a sharp drop to zero in JJAS Murrumbidgee River flooding events at Hay
since 1991 (Fig. 2a), with just one minor flood in 1995 at Wagga Wagga and one major flood in 2016 (Fig. 2b),
in addition to much reduced dam inflows since the mid-1990s (Fig. 2c,d).
In Fig. 2a there is a data overlap of approximately 13 years at Hay town gauge and Hay Private Irrigation Dis-
trict (PID) gauge for which the coefficient of determination (R2 = 0.9235), obtained from linear regression of the
weekly river height values (N = 668), explains 92% of the variance in the river heights between the two locations.
The data quality is high as it takes into account missing values, outliers, continuity between the two gauge loca-
tions, and measurement p ractice12. The flooding level of 6.7 m at Hay is defined as the level above which water
starts to spill over the riverbanks at H ay12 and the minor flood level at the river gauge at Wagga Wagga is 7.3 m.
It is hypothesized here that from the early 1990s the main influence on decreased downstream river water
availability is due to the reduction in dam net inflows from decreased precipitation. It is well-known that rainfall
in southeast Australia, where the Murrumbidgee River catchment is located, usually is highest in winter and
Scientific Reports | (2021) 11:16136 | https://doi.org/10.1038/s41598-021-95531-4 2
Vol:.(1234567890)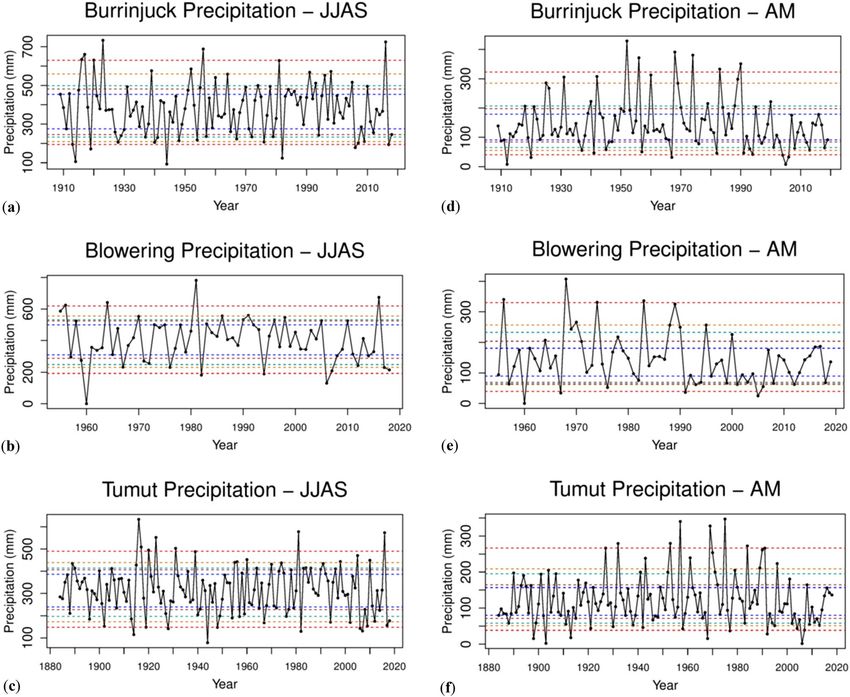
www.nature.com/scientificreports/
has a minimum through summer into early autumn5. Hence the so-called ‘winter cropping season’ starts with
planting in autumn and harvesting in spring–summer.
Monthly‑seasonal maximum river flood heights at Hay 1874–2019
Most river height exceedances above 6.7 m at Hay in JJAS occur in late winter (July, August) and September
(Table 1) after sufficient catchment wetting. Spring (SON) floods are the most common (Table 2) as river and
dam inflows are a result of both rainfall and snowmelt. However, since 1991 there has been just one April to
September flood at both Hay and Wagga Wagga resulting from Burrinjuck Dam overspill which was in September
ustralia13. In terms of
2016 (Table 2). Extreme SON precipitation totals are associated with La Niña over eastern A
river flood events at Hay and Wagga Wagga, and net inflows at the catchment dams of Burrinjuck and Blowering
in southeast Australia, this relationship broke down, as shown by the presence only of neutral phases of ENSO
in SON after the 1970s (Table 2) and in agreement with eastern Australian rainfall in general13. However, there
was a strong relationship with ENSO for the 2010 flood in summer (DJF).
In autumn (MAM) there are very few flood events (Table 3) because the catchment typically dries out suf-
ficiently through summer to reduce river flow.
Precipitation time series in the Murrumbidgee river catchment area
Representing major dam storages, Burrinjuck Dam and Blowering Dam Figs. 3(a,b) each receives a mean JJAS
precipitation of about 300 mm, whereas Tumut receives approximately 350 mm (Fig. 3c). There are fewer percen-
tiles near the extremes from the 1990s, with no years above the 95th percentile apart from 2016 and a reduction
in years below the 5th percentile. Statistical significance is discussed in the next section. Similarly, for April–May
precipitation there are no years above the 90th percentile from the late 1990s for the three locations (Fig. 3d–f).
All three locations, particularly Burrinjuck Dam and Blowering Dam, are exposed to topographically influ-
enced precipitation from mid-latitude wet season (JJAS) cold frontal weather systems.
Monthly to seasonal precipitation typically exhibits large ranges due to its episodic nature, whereas seasonal
means show little change. Therefore, an important part of this study is to analyse trends in both the means and
variances of catchment rainfall and inflows, in addition to JJAS river heights at both Hay and Wagga Wagga.
The focus is on the period after the 1960s, since there has been no new regulatory infrastructure upstream of
Hay. The main focus is from the early to mid-1990s corresponding to the accelerated global warming s ignal14.
Considering changes in regulation of the Murrumbidgee River, box and whisker plots and permutation testing
are used to analyse changes in both JJAS and April–May inflows at Burrinjuck/Blowering Dams, and precipita-
tion at key rainfall catchment locations including Burrinjuck Dam, Blowering Dam and Tumut, in addition to
river heights at both Hay and Wagga Wagga. The 27-year period chosen for the time series analysis is justified
in the Methods Section. For the April–May and JJAS Burrinjuck Dam, Blowering Dam and Tumut combined
precipitation, ML techniques are used to identify possible key climate drivers of Murrumbidgee River catchment
precipitation. Wavelets then are used to provide some further understanding of possible climate drivers affecting
precipitation and net inflows at those locations, and how their influence has changed over time.
Results
For each of the Burrinjuck Dam, Blowering Dam and Tumut time series there has been no statistically significant
trend after bootstrapping and box plotting the precipitation into 27-year intervals, for 1965–1991 and 1992–2018.
While their JJAS means appear to have decreased slightly (not shown), no locations have observed statistically
significant changes (Table 4). For the Tumut JJAS data, precipitation was significantly more variable prior to
1965 (p-values = 0.045 and 0.0984; Table 4). However, for all three locations, their mean late autumn (April–May)
precipitation shows a decline in both the mean and variance in the 27-year boxplots between 1965 and 1991 and
1992–2018 (Fig. 4a–c). Statistically, there is a highly significant decrease in both their means (p-values < 0.01;
Table 4), and their variances (p-values ~ 0.05; Table 4). It is noteworthy that while neither the mean nor vari-
ance of Tumut April–May precipitation between 1884 and 1910 and 1992–2018 is significant, their variances
are similarly very low (Fig. 4c-right panel), owing to the very low rainfall that occurred during the Federation
Drought (1895–1903).
There is an apparent decrease in the mean and variance of JJAS Murrumbidgee River heights at Hay between
the bootstrapped intervals 1938–1964 to 1965–1991 highlighted by their low p-values (Table 4; figure not shown),
which corresponded to a change from low to highly regulated river fl ow11. However, the apparent mean and
variance decrease is not statistically significant, whereas the variance between the 27-year bootstrapped intervals
1965–1991 to 1992–2018 is highly significant (p-value ~ 0.005; Table 4). The mean river height in this period
for Hay (p = 0.236; Table 4) is not statistically significant most likely due to snow melt starting to reach Hay in
September. Both Hay and Wagga Wagga river heights are significantly lower in both mean and variance from
1911 to 1937 to 1992–2018 owing to a high rainfall period 1911–1937 compared to the period 1992–2018 (p-val-
ues = 0.0068, 0.001, respectively for Hay; 0.0002, 0.013, respectively for Wagga Wagga). For Wagga Wagga the
decrease in both the mean and variance from 1965 to 1991 to 1992–2018 is highly significant (p-values ~ 0.0068
and 0.001, respectively; Table 4). Importantly, the significant mean decrease at Wagga Wagga suggests that the
cause is climate related with river water used for irrigation not a major contributor since almost all irrigation
occurs downstream between Wagga Wagga and Hay. There is no significant change in October–March precipi-
tation mean or variance from 1965 to 1991 to 1992–2018 for the three catchment rainfall locations (p-values
not shown).
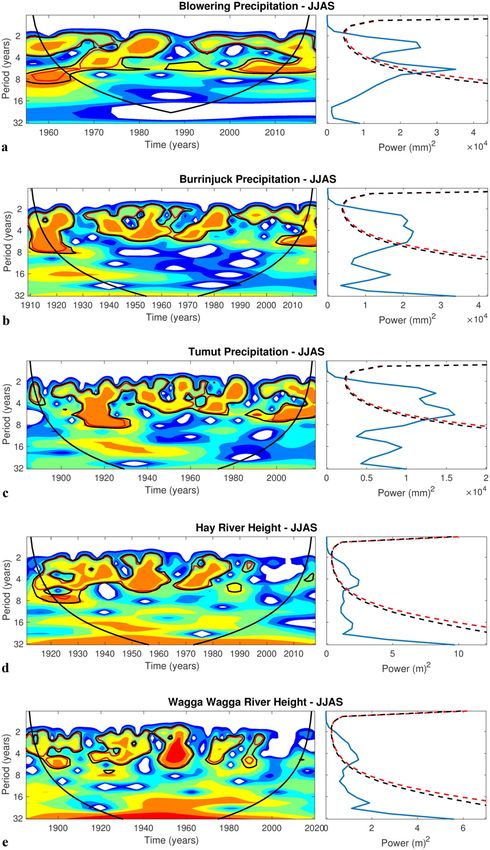
The mean JJAS precipitation wavelets for Burrinjuck Dam, Blowering Dam, Tumut and the mean JJAS weekly
Murrumbidgee River heights at Hay (Fig. 5a–d), respectively, exhibit a significant ENSO-like periodicity of
approximately 2–7 years, which mostly weakens in the three precipitation locations from the 1990s, and, in
Scientific Reports | (2021) 11:16136 | https://doi.org/10.1038/s41598-021-95531-4 3
Vol.:(0123456789)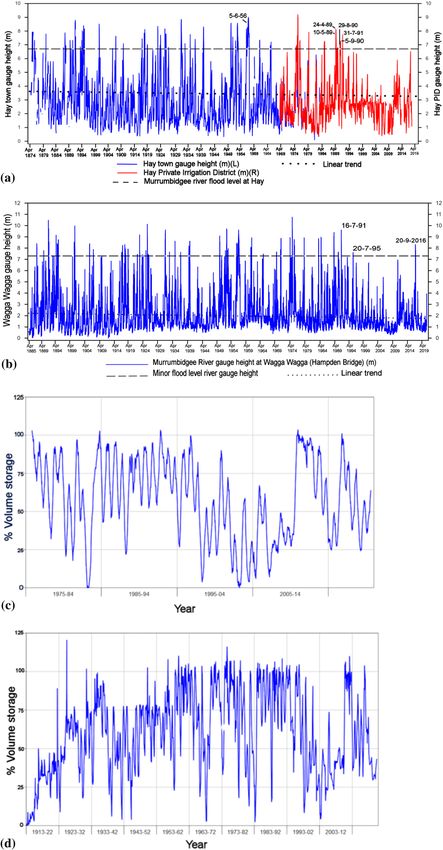
www.nature.com/scientificreports/
Figure 2. Murrumbidgee river heights at Hay and Wagga Wagga; annual inflows at Blowering Dam and ▸
Burrinjuck Dam. (a) Murrumbidgee river heights (m) at the Hay town gauge and Hay PID for (April–
September) 1874 to 2019. There are concurrent readings at the two locations from 1968 to 1982. The first April
height every 5 years is indicated. The river flood level is marked (dashed black line) at 6.7 m. Of the six months
April-September the most recent maximum weekly river height value for each individual month exceeding
the flood level of 6.7 m, are designated. Note that since 1991 there have no April–September flood height
exceedance peaks and the most recent June flood height exceedance was 5 June 1956, (b) Murrumbidgee river
heights at Wagga Wagga (April to September) 1885–2019. The minor flood level is marked (dashed black line)
at 7.3 m. Note that since 1991 there has been only one minor flood level reached in 1995 and one major in 2016,
(c) annual volume storage (%) for Blowering Dam indicating precipitation inflows from 1975 to 2019. Note that
there is a rapid increase followed by a long decline as a result of the 2010–2012 La Niña and in 2016 as a result
of a strong IOD influence, (d) annual volume storage (%) for Burrinjuck Dam indicating precipitation inflows
from 1913 to 2019. Note the similar rapid increase in 2010 followed by a long decline from 2012 and in 2016, as
in (c).
the case of the river heights at Hay, disappears after the 1990s. A possible reason for the weakening ENSO-like
periodicity is that the nonlinear ENSO amplitude has weakened (less strong El Niños) in response to global
warming15,16.
There is a clear periodicity of 2–7 years, suggestive of the ENSO time scale, at the three catchment precipita-
tion locations (Fig. 5a–c). However, the ENSO signal disappears from the late 1990s for the downstream river
heights at Wagga Wagga and Hay (Fig. 5d,e). This period corresponds to a lack of major precipitation-driven
net inflows except for 2010–2012 and 2016.
Apart from ENSO there are many potential climate drivers that could influence precipitation in the Murrum-
bidgee catchment, and therefore river heights along the Murrumbidgee River. Potential attributes considered in
this study include the IOD, global sea surface temperature anomalies (GlobalSSTA), global temperature anoma-
lies (GlobalT), Niño3.4, the IPO, the SAM, the Southern Oscillation Index (SOI), and Tasman Sea sea surface
temperature anomalies (TSSST). Additionally, two-way interaction terms between these predictors were consid-
ered as potential attributes, obtained through multiplication of two variables with each other (e.g., SAM*IPO).
For April–May precipitation, the important attributes were assessed as GlobalT, SAM, SOI, GlobalT*SAM and
GlobalT*IPO. For JJAS precipitation, the key attributes were IOD, SAM, SOI, IPO and GlobalT*GlobalSSTA.
There is a clear increasing trend in JJAS mean TMax and TMin at both Burrinjuck Dam and Cabramurra
(located close to Blowering Dam), revealed by their 27-year interval boxplots (Fig. 6a–d), and consistent with the
known global warming signal since 195017 which has accelerated in the last 50 years18,19 and particularly since
the mid-1990s in A ustralia13. This is confirmed by the very high levels of significance (all p-values are < 0.05) for
the difference in TMax and TMin means between the intervals 1965–1991 to 1992–2018 (Table 5).
Cabramurra (altitude 1482 m) shows a highly significant increase in TMin between the two bootstrapped
intervals in contrast to a non-significant increase at Burrinjuck Dam (altitude 390 m). With such a large difference
in altitude between the two locations, it is possible that other factors may be involved, including local differences
in meteorological variables such as wind speed/wind direction and/or cloud cover.
Discussion
The JJAS river heights at Hay (Fig. 2a) have clearly reduced variability over the 27-year period 1965–1991 com-
pared with 1992–2018 (p-value = 0.005, Table 4). Despite the apparent decrease in the mean and variance of JJAS
Murrumbidgee River heights at Hay from the 1960s, as shown by the low p-values (0.309, 0.332), respectively, for
the 27-year intervals 1938–1964 to 1965–1991 (Table 4), the decrease is not statistically significant. However, the
decrease is consistent with the suggestion that a change point occurred from the late 1950s between unregulated
to regulated flow at H ay11.
While the mean JJAS precipitation of the three catchment locations of Burrinjuck Dam, Blowering Dam and
Tumut indicate a slight decrease in percentile extremes from the 1990s, with 2016 (due to September) only above
the 95th percentile (Fig. 3), they exhibit no significant change in mean or variance based on the bootstrapped
intervals JJAS 1964–1991 to 1992–2018. Consequently, the question arises of why the significant decrease in
mean and variance of the JJAS Murrumbidgee River height at Wagga Wagga and in variance at Hay does not
match a similar significant decrease in mean or variance of JJAS catchment rainfall. A rainfall decline in recent
decades was found to be most pronounced in late a utumn20,21 and that without sufficient autumn rainfall to
moisten catchments in southern Australia, follow-up rainfall in winter cannot be efficiently converted to run-
off and catchment inflows22. There have been statistically significant decreases in April–May mean precipitation
at the catchment locations of Blowering Dam, Burrinjuck Dam and Tumut from 1964 to 1991 to 1992–2018
and also for the mean inflows to the two Dams (Table 4). Furthermore, as a result of the Millennium Drought
(1997–2009), modelling experiments indicate that, starting from very dry conditions, the run-off response
to rainfall only will return to the normal pre-drought conditions after about 10–20 years of average r ainfall23.
Therefore, the significant decrease in variance of Murrumbidgee River heights at Hay and in mean and vari-
ance at Wagga Wagga, is most likely due to the April–May reduced dam inflows and precipitation, and from
average JJAS catchment precipitation since 1991. Any role played by water extraction for irrigation between
Wagga Wagga and Hay, where irrigation is concentrated, is likely to be small owing to the highly significant
mean river height reduction at Wagga Wagga which is upstream from Hay. However, irrigation, and other water
usage, is sourced from the dams, so there is a long-term impact of irrigation over the months preceding JJAS
on flows at Wagga Wagga, due to the reduction in water stored in the upstream dams. The dams integrate the
Scientific Reports | (2021) 11:16136 | https://doi.org/10.1038/s41598-021-95531-4 4
Vol:.(1234567890)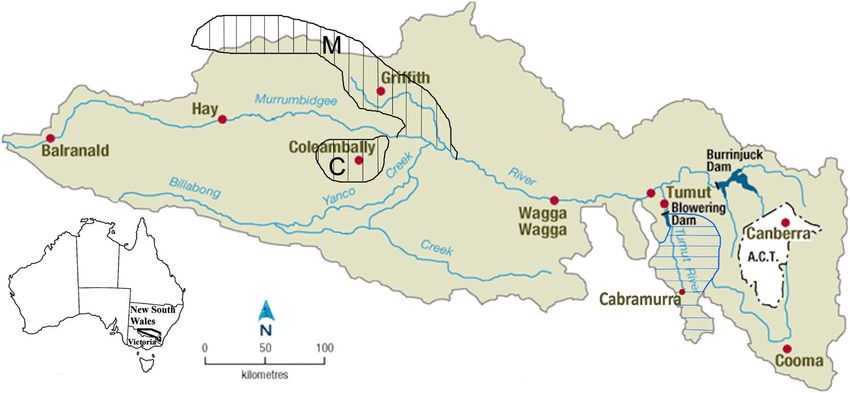
www.nature.com/scientificreports/

Scientific Reports |   (2021) 11:16136 |   https://doi.org/10.1038/s41598-021-95531-4        5

                                                                                        Vol.:(0123456789)
www.nature.com/scientificreports/
Year Jun Jul Aug Sept JJAS count
1874 7.92 7.92 7.92 3
1875 7.25 7.32 2
1876 8.0 1
1887 7.86 7.22 2
1889 7.32 7.31 2
1890
1891 8.78 7.62 6.9 2
1893 6.86 8.3 2
1894 6.71 8.38 8.3 3
1905 6.74 1
1906 7.62 1
1909 7.08 1
1916 7.43 1
1917 7.85 8.1 2
1918 6.89 8.1 2
1922 8.33
1923 6.94 7.69 6.7 3
1925 8.15 7.77 7.77 3
1926 6.81 1
1931 8.33 8.83 6.7 3
1932 7.08 1
1934 7.74 1
1936 7.39 1
1939 8.2 1
1949 7.56 1
1950 7.55 1
1951 6.85 1
1952 8.22 8.56 7.62 3
1955 8.15 1
1956 8.31 8.99 8.78 7.84 4
1960 7.35 6.82 2
1964 6.93 7.19 2
1974 7.24 7.35 8.99 3
1984 7.2 7.26 2
1989 6.72 6.8 2
1990 6.96 7 7.27 3
1991 7.73 1
Table 1. Table showing wet season (JJAS) monthly maximum weekly Murrumbidgee River heights at Hay
(southern MDB) that exceed/equal flood level (6.7 m), and seasonal count, in the 125 years 1874–2018. Note
the absence of flood height exceedance values since 1991.
water extracted for irrigation and all other usage since the last spill event, and therefore the extractions over an
extended period can have an impact on when the dam will fill, and hence on the flows downstream, including
Wagga Wagga. The minimum water level in the dams, which typically occurs near the end of Autumn, is due to
the reduction in inflows (impacted by climate change), and extractions from the dam. Coupled with the tendency
for a slower fill rate due to reduced inflows, this results in fewer spill events. As a consequence, there is a change
in the distribution between spill events and irrigation releases, changing the frequency distribution of flows.
This will be particularly the case for the JJAS period, as a delayed dam filling will have a major impact in dam
levels in that period. Before the 1990s the river at Wagga Wagga and Hay reached flood level height or close to
flood level height regularly in JJAS from precipitation-driven inflows regardless of the amount of water that was
extracted (see Fig. 2a,b). Since the mid-1990s less water reaching Wagga Wagga has significantly reduced the
river height owing to significantly decreased April–May and JJAS precipitation-driven inflows at the upstream
catchment dams of Burrinjuck and Blowering Dams and significantly decreased mean precipitation at Tumut,
which also represents the catchment area of Blowering Dam (Fig. 2c,d; Table 4). Moreover, there has been no
overallocation or hoarding of water found in the southern M DB24. In a different southern MDB catchment
study of the Millennium Drought 1997–2008, factors for a disproportionate reduction in rainfall run-off were
reduced mean annual rainfall, less interannual variability of rainfall, changed seasonality of rainfall and lastly
increased potential e vaporation25. However, the last two factors mentioned have since become well established
Scientific Reports | (2021) 11:16136 | https://doi.org/10.1038/s41598-021-95531-4 6
Vol:.(1234567890)www.nature.com/scientificreports/
Year Sep. Oct. Nov. SON total count ENSO strength & sign
1874 7.92 7.77 2 N/A
1877 8.17 1 Mod. −
1878 8.99 7.92 2 Mod-strong +
1879 8.0 1 Very strong +
1886 6.95 1 Mod +
1887 7.22 1 Very strong +
1888 7.65 1 Mod. −
1889 7.31 1 Mod. +
1890 6.7 1 Strong +
1891 6.9 7.16 7.01 3 Weak −
1893 7.25 1 Mod-strong +
1894 8.3 1 Very strong +
1905 8.08 1 Mod. −
1906 7.62 8.08 2 Mod. +
1909 7.08 1 Weak −
1916 7.43 8.2 2 Mod. +
1917 8.11 8.31 8.31 3 Very strong +
1918 7.01 1 Weak −
1923 6.7 6.93 2 Mod. −
1925 7.77 1 Mod −
1932 7.08 1 Weak −
1934 7.74 8.29 2 Neutral
1939 8.29 1 Weak −
1950 8.31 1 Mod-strong +
1951 6.85 7.54 2 Neutral
1952 7.8 7.8 2 Neutral
1955 8.15 7.13 2 Mod. +
1956 7.84 7.96 8.23 3 Weak +
1959 7.07 1 Neutral
1960 6.82 8.41 2 Weak +
1964 7.19 8 7.35 3 Weak +
1970 8.56 1 Weak +
1974 8.99 8.63 8.64 3 Weak +
1975 8.62 1 Mod-strong +
1976 7.71 1 Neutral
1978 7.6 1 Neutral
1984 7.26 6.76 2 Neutral
1990 7.27 1 Neutral
2016 8.45 1 Neutral
Table 2. Table showing spring (SON) weekly maximum Murrumbidgee river heights at Hay (southern MDB)
that exceed flood level (6.7 m), and seasonal count, in the 125 years 1874–2018. Also included is the strength
of the ENSO signal as determined by the Australian Bureau of Meteorology (http://www.bom.gov.au/climate/
enso/lnlist/index.shtml). Note the neutral ENSO association with flood heights since the mid-1970s and only
one event since 1990.
in the last decade with reference to the work in this study. It was suggested that a rainfall reduction alone does
not explain the observed inflow reduction t rend26. Even after a major rain event, the soils are so dry that they
absorb more water than before the rain event, and less reaches the dams and rivers than on a wet catchment. In
the last three decades it is unknown what the effect on run-off into dams and the Murrumbidgee river has been
in JJAS from major rain events because, apart from August–September 2016, there have been no major catch-
ment net inflows since 1991 (Fig. 2c,d). There were significant precipitation-driven inflows during SON 2010
which led to flood level exceedances at Wagga Wagga and Hay in December 2010. In June and July 1991 there
was a series of rain-producing cut-off low pressure systems over inland NSW and the adjacent coast influencing
the catchment, interspersed with persistent, precipitation-producing frontal systems embedded in the westerly
airflow during July and August. Rain producing inland cut-off low pressure systems over southeast Australia are
the main influence on enhancing JJAS rainfall t otals8.
Scientific Reports | (2021) 11:16136 | https://doi.org/10.1038/s41598-021-95531-4 7
Vol.:(0123456789)www.nature.com/scientificreports/
Year Mar Apr May MAM count
1888 6.8 1
1894 7.32 8.02 2
1950 8.5 7.04 2
1956 6.89 8.23 2
1974 6.85 1
1989 8.41 7.93 2
2012 8.6 1
Table 3. Table showing autumn (MAM) monthly maximum weekly Murrumbidgee River heights at Hay
(southern MDB) that exceed flood level (6.7 m), and seasonal count in the 126 years 1874–2019. Note the last
April–May flood exceedance height in 1989 and one in March.
Figure 3. Precipitation time series in the Murrumbidgee River catchment area. JJAS precipitation at, (a)
Burrinjuck Dam from 1910 to 2019, (b) Blowering Dam from 1955 to 2019 and (c) Tumut from 1883 to 2019;
April–May precipitation at, (d) Burrinjuck Dam from 1910 to 2019, (e) Blowering Dam from 1955 to 2019 and,
(f) Tumut from 1883 to 2019. Dashed lines indicate percentiles 5th and 95th (red); 10th and 90th (orange); 15th
and 85th (light blue); 20th and 80th (brown); and 25th and 75th (dark blue). Note the decreasing April–May
precipitation at the three stations since the early 1990s.
Scientific Reports | (2021) 11:16136 | https://doi.org/10.1038/s41598-021-95531-4 8
Vol:.(1234567890)www.nature.com/scientificreports/
Precipitation Net Inflows (% Volume) Murrumbidgee River level
Apr–May JJAS Apr–May JJAS Apr–May JJAS
Catchment location Mean Var Mean Var Mean Var Mean Var Mean Var Mean Var
Blowering Dam
1965–1991 vs 1992–2018 0.007* 0.012* 0.202 0.978 – – – – – – – –
1976–1997 vs 1998–2019 – – – – 0.0348* 0.301 0.0018* 0.0714* 0.0346* 0.426 0.0024* 0.087*
Burrinjuck Dam
1911–1937 vs 1992–2018 0.102 0.237 0.918 0.422 – – – – – – – –
1938–1964 vs 1965–1991 0.772 0.644 0.846 0.424 0.145 0.093* 0.058* 0.352 0.357 0.268 0.094 0.605
1938–1964 vs 1992–2018 0.0034* 0.0486* 0.905 0.818 0.566 0.391 0.104 0.0708* 0.476 0.544 0.0706* 0.051*
1965–1991 vs 1992–2018 0.0024* 0.002* 0.761 0.635 0.0676* 0.517 0.003 0.328 0.148 0.606 0.0026* 0.115
Tumut
1884–1910 vs 1938–1964 0.149 0.289 0.463 0.045* – – – – – – – –
1938–1964 vs 1965–1991 0.528 0.278 0.308 0.984 – – – – – – – –
1884–1910 vs 1992–2018 0.285 0.46 0.353 0.008* – – – – – – – –
1965–1991 vs 1992–2018 0.0062* 0.0026* 0.227 0.505 – – – – – – – –
Wagga Wagga
1911–1937 vs 1938–1964 – – – – – – – – – – 0.399 0.55
1911–1937 vs 1992–2018 – – – – – – – – – – 0.0002* 0.013*
1938–1964 vs 1965–1991 – – – – – – – – – – 0.374 0.275
1965–1991 vs 1992–2018 – – – – – – – – – – 0.0044* 0.095*
Hay
1911–1937 vs 1965–1991 – – – – – – – – – – 0.19 0.683
1911–1937 vs 1992–2018 – – – – – – – – – – 0.0068* 0.001*
1938–1964 vs 1965–1991 – – – – – – – – – – 0.309 0.332
1965–1991 vs 1992–2018 – – – – – – – – – – 0.236 0.005*
Table 4. P-values from permutation testing differences in interval means and variances for, April–May
and JJAS precipitation for Blowering Dam, Burrinjuck Dam, and Tumut; inflows into Blowering Dam and
Burrinjuck Dam; Murrumbidgee River heights at Blowering Dam, Burrinjuck Dam, Wagga Wagga and Hay.
Significant values (p < 0.10) are italicized with an asterisk. Note that the p-value for each variance test is
calculated after one sample has had bias correction in the mean. Note that the p-value for each variance test
is calculated after one sample has had bias correction in the mean. Key points to note are highly significant
April–May precipitation decreases from 1965 to 1991 to 1992–2018, highly significant recent JJAS net inflows
into Blowering and Burrinjuck Dams, and some significant recent decreases in mean or variance of JJAS river
heights at Wagga Wagga and Hay.
Decreased JJAS precipitation in continental southeast Australia has been evident for at least the last two
decades, as anticipated by climate scientists. The naturally periodic La Niña phenomenon provided spring and
summer precipitation during much of 2010 to 2012, which ended the Millennium Drought (1997–2009). The
only other recent widespread significant rainfall in southeast continental Australia was in August–September
2016 due to a negative phase of the Indian Ocean Dipole (IOD). A negative IOD phase typically is associated
with wetter than normal spring conditions for southeast Australia7,8.
Although the SAM is an atmospheric index with a time scale typically of a few weeks, an annual average
SAM reconstruction shows that since the 1970s it is in its most positive state over at least the past 1000 years27.
Prior to the 1990s soil wetness would have been in phase with the annual cycle of winter/spring peak rainfall,
dry summer/early autumn and without a long term trend in SAM. However, because SAM has trended positive
since the 1970s, the annual cycle of soil wetness of the MDB has been increasingly disrupted particularly since the
Millennium Drought23 and there is also a potential long-term impact from groundwater s ystems28. This is sup-
ported by the most recent available annual area-averaged actual evapotranspiration and soil moisture deciles in
Fig. 7a,b. These figures show the anomalously dry MDB catchment area in the period 2018–2019. In the southeast
corner of the MDB, actual evapotranspiration is below average and soil moisture is very much below average.
Two Supplementary Tables showing historical April–May (S1) and JJAS (S2) maximum river heights above
flood level at Hay (6.7 m) in IPO phases indicate, as expected, more in negative IPO phases than positive phases
and importantly a dissociation with the IPO resulting from none in the most recent negative phase from 1998
and the preceding positive phase after the early 1990s. The implication is that accelerated global warming since
the 1990s has overwhelmed the influence of negative IPO on precipitation.
The MDB plan, introduced from 2 01329 provided, for the first time, regulated allocations to environmental
flows for ecosystem sustainability of rivers in southeast Australia such as the Murrumbidgee. However, the plan
requires that each year on 1 July a fixed amount of water is locked in for future consumption, split three ways
with the highest priority for human consumption and irrigation for permanent crops (e.g., fruit trees and nuts).
The remaining allocations are split between non-permanent crops (e.g., cotton, rice) and environmental flow. A
Scientific Reports | (2021) 11:16136 | https://doi.org/10.1038/s41598-021-95531-4 9
Vol.:(0123456789)www.nature.com/scientificreports/
Figure 4. Boxwhisker plots representing mean and variance of April–May Murrumbidgee catchment
precipitation. Bootstrapped 27-year intervals of mean (left panel) and variance (right panel) of April–May
precipitation for, (a) Blowering Dam, (b) Burrinjuck Dam, (c) Tumut.
major issue is that the forecast net inflows upon which the allocations are based are the minimum inflows expe-
rienced in the 120 years up to the end of the twentieth century. However, as shown, even lower inflows have been
experienced in the past two decades. It is not surprising that there is a significant decrease in the JJAS variance of
the Murrumbidgee River height at Hay (p-value = 0.005) and both the JJAS mean and variance at Wagga Wagga
from the periods 1965–1991 to 1992–2018 (mean p-value = 0.0044, variance p-value = 0.095; Table 4) since this
period corresponds with the significantly reduced mean April–May catchment precipitation and mean April–May
dam net inflows. The fact that there has been no significant change in the mean Murrumbidgee River height
since 1991 is an indication that there has been a lack of major April-September rain events. The lack of significant
catchment rainfall events from April to September is the reason for the reduction in the mean and variance of
river heights at Wagga Wagga. Floods in April–May are rare along the Murrumbidgee River and the six years
since 1874 in which April–May floods occurred at Hay prior to 1991 (Table 3), were dominated by precipitation
that occurred as a result of mid-latitude interaction with either tropical or subtropical moisture, whereas the last
flood that occurred in March 2012, was the result of a rain-producing tropical low pressure trough in the easterly
wind regime that extended from northwest Australia to a low pressure centre in southern New South Wales near
the Murrumbidgee catchment. Moreover, given the significant decline in April–May, Murrumbidgee catchment
rainfall, JJAS run-off into the dams and Murrumbidgee River height at Wagga Wagga since 1991, the implication
for water allocations of irrigated agriculture downstream from Wagga Wagga and for flood plain environmental
flows required for sustainable wetlands downstream from Hay, will continue to be a problem.
Scientific Reports | (2021) 11:16136 | https://doi.org/10.1038/s41598-021-95531-4 10
Vol:.(1234567890)www.nature.com/scientificreports/
Figure 5. Wavelets of JJAS precipitation and river height. JJAS wavelets and global power spectra of
precipitation for, (a) Burrinjuck Dam, (b) Blowering Dam, (c) Tumut; and (d) JJAS mean weekly Murrumbidgee
river heights at Hay. Power significance is indicated by areas within thick black or red contours the 5% or 10%
confidence levels, respectively.
Scientific Reports | (2021) 11:16136 | https://doi.org/10.1038/s41598-021-95531-4 11
Vol.:(0123456789)www.nature.com/scientificreports/
Figure 6. Box plots of mean temperature in the Murrumbidgee River catchment. (a) Bootstrapped 27-year
interval Burrinjuck JJA mean TMax (C), (b) bootstrapped 27-year interval Cabramurra JJA mean TMax (C),
(c) bootstrapped 27-year interval Burrinjuck Dam JJA mean TMin (C), and (d) bootstrapped 27-year interval
Cabramurra JJA mean TMin (C). Note the highly significant increase in JJAS mean maximum temperatures
at both Burrinjuck Dam and Cabramurra from 1965 to 1991 to 1992–2018 and the increasing trend in mean
minimum temperatures.
JJAS Cabramurra
JJAS Burrinjuck Dam P-values P-values
27-year bootstrapped interval Statistic TMax TMin TMax TMin
Mean 0* 0.0452* 0* 0.002*
1965–1991 vs 1992–2018
Variance 0.849 0.926 0.613 0.647
Table 5. P-values from permutation testing differences in JJAS mean maximum. (TMax) and mean minimum
(TMin) temperature (C) relative to 27-year bootstrapped intervals for Burrinjuck Dam and Cabramurra
(nearby surrogate for Blowering Dam). Significant values (p < 0.05) are italicized with an asterisk.
Conclusions
Both the mean and variability of JJAS river height data at Wagga Wagga and the variability of JJAS river height
data at Hay on the Murrumbidgee River in the MDB have decreased significantly since the early 1990s, owing
to one only July minor flood level exceedance at Wagga since 1995 and one only September flood level exceed-
ance in 2016. In sharp contrast, the flood level at both Hay and Wagga Wagga was exceeded every few years in
JJAS from 1874 to the early 1990s. There has been no new regulatory infrastructure built upstream from Hay
since the 1960s. Bootstrapped data box plots for 27-year periods covering JJAS months exhibit no statistically
significant decline in the mean catchment precipitation at locations including Burrinjuck Dam, Blowering Dam
and Tumut for the period 1992–2018, to match the statistically significant lower mean and variability in river
heights at Wagga Wagga or the variability further downstream at Hay. Water extraction for irrigation is unlikely
to be a major cause between Wagga Wagga and Hay because the river height had already decreased significantly
at Wagga Wagga. However, there is a highly significant decline in late autumn (April–May) mean and variance
of catchment precipitation between the periods 1965–1991 and 1992–2018. Insufficient late autumn moisten-
ing of the dams’ catchment areas reduces run-off during JJAS months even when the mean JJAS rainfall has
not declined significantly. A further contributing factor is likely to be the observed mean temperature increase
during April-September, thereby increasing evapotranspiration, and reducing run-off into rivers and dams.
Total evaporation has increased by up to 2.5 mm per decade since the 1970s. The contributions of decreased
Scientific Reports | (2021) 11:16136 | https://doi.org/10.1038/s41598-021-95531-4 12
Vol:.(1234567890)www.nature.com/scientificreports/
Figure 7. Annual deciles of actual evapotranspiration and soil moisture 2018–2019. Map of southeast
Australia showing for the MDB region deciles during the 2018–2019 year for, (a) annual area-averaged
actual evapotranspiration. Note the below average decile in the southeast corner of the MDB, and (b) annual
area-averaged soil moisture. Note the very much below average decile in the southeast corner of the MDB.
(Reproduced with permission under Creative Commons Attribution Licence 3.0 from the Australian Bureau
of Meteorology. Available at: http://www.bom.gov.au/water/nwa/2019/mdb/climateandwater/climateandwater.
shtml.
Scientific Reports | (2021) 11:16136 | https://doi.org/10.1038/s41598-021-95531-4 13
Vol.:(0123456789)www.nature.com/scientificreports/
April–May precipitation, decreased April–May and JJAS dam net inflows, and increased mean temperatures,
which represents the accelerated global warming signal since the 1990s, all reduced catchment area run-off.
Future work therefore is planned to address the high priority of searching for attributes, to assist in identifying
and understanding the role of the key meteorological drivers, especially those related to the April–May decrease
in catchment rainfall.
Regardless of the mandated environmental flows in the last decade and the annually determined sustain-
able extraction limits on irrigation, water availability from the Murrumbidgee River at Wagga Wagga and Hay
over recent decades continues to be affected by changes in catchment precipitation and run-off. In this study
the decreased river heights at Wagga Wagga and Hay in the 27-year period, 1992–2018, occurred as a result of a
change in seasonality of rainfall and increase in potential evaporation during the current accelerated period of
global warming as described above, suggesting the need for a new review of water availability and sustainability
in the Murrumbidgee River system and also of other river systems in the southern MDB.
Methods
The available data sets were Murrumbidgee River heights at Hay in the southern MDB, monthly precipitation,
and maximum and minimum screen temperatures at four stations at Blowering Dam, Burrinjuck Dam, Tumut
and Cabramurra. The aims of the methodology were to identify trends in the data sets and to use wavelet analysis
to identify possible climate drivers of the trends. In addition, ML techniques used to assess the importance of a
wide range of climate drivers related to catchment precipitation, are described briefly.
Trend analysis. The time series data were first plotted with their percentiles to obtain an overview of any
trends which might be present in the data. Each data set was grouped into two equal 27-year periods, by taking
account of the accelerated global warming signal from the mid-1990s and the archived length of each variable.
Hence, the ending period was 1992–2018, and bootstrap resampling was applied with 5000 resamples. Box plots
of the mean and variance of the bootstrapped intervals were created which provide a deeper understanding of
any trends that might be present in the data. Permutation testing was applied with replacement to test for statisti-
cal significance in any apparent changes between two 27-year periods.
Wavelet analysis. Wavelet analysis30,31 was applied to each time series to detect potential climate drivers
such as the El-Niño Southern Oscillation. This approach provides both the local wavelet power spectrum (e.g.,
Fig. 6a, left panel) and the global power spectrum (e.g., Fig. 6a, right panel). The local wavelet power spectrum
shows how the influence of climate drivers changes over time, while the global power spectrum provides an
overview of which drivers are dominant in the time series. In this study, we used the Morlet wavelet as the
mother wavelet.
Machine learning techniques. Multiple linear regression, support vector regression (with both radial
basis function and polynomial kernels), and random forests were used with either forward or backward selection
through the space of potential attributes to determine the key attributes of precipitation in the Murrumbidgee
catchment. These techniques were employed in a detailed study of the Sydney c atchment32. By applying tenfold
cross-validation on the data set, which covers the years 1965–2018, those attributes that appear in at least 50% of
the folds across the eight training methods are considered key attributes of precipitation.
Data availability
The rainfall and temperature station datasets in this study are available online at the Australian Bureau of Mete-
orology at: http://w
ww.b
om.g ov.a u/c limat e/c hange/i ndex.s html#t abs=D
atase ts. The digitized weekly river height
data at Hay are available at:—https://doi.org/10.5281/zenodo.3779490. Data sets for the SAM, IOD, IPO, ENSO
and Global SST time series data were obtained from the NOAA-ESRL Physical Sciences Laboratory, Boulder
Colorado from their Web site at: http://www.esrl.noaa.gov/psd/gcos_wgsp/Timeseries/.
Received: 5 February 2021; Accepted: 27 July 2021
References
1. Holland, J. E., Luck, G. W. & Finlayson, C. M. Threats to food production and water quality in the Murray-Darling Basin of Aus-
tralia. Ecosyst. Serv. 12, 55–70. https://doi.org/10.1016/j.ecoser.2015.02.008 (2015).
2. United States Geological Survey. California’s Central Valley Facts. https://ca.water.usgs.gov/projects/central-valley/about-centr
al-valley.html.
3. Bureau of Meteorology. 2019. Special Climate Statement 70: Drought Conditions in Eastern Australia and Impact on Water Resources
in the Murray–Darling Basin. Australian Bureau of Meteorology. http://www.bom.gov.au/climate/current/statements/scs70.pdf.
Accessed 9 Apr 2019.
4. Post, D. A. et al. Decrease in southeastern Australian water availability linked to ongoing Hadley cell expansion. Earth’s Future 2,
231–238. https://doi.org/10.1002/2013EF000194 (2014).
5. Murphy, B. F. & Timbal, B. A review of recent climate variability and climate change in southeastern Australia. Int J. Climatol. 28,
859–879. https://doi.org/10.1002/joc.1627 (2008).
6. Peterson, T. J., Saft, M., Peel, M. C. & John, A. Watersheds may not recover from drought. Science 372(6543), 745–749. https://doi.
org/10.1126/science.abd5085 (2021).
7. Ummenhofer, C. C. et al. What causes southeast Australia’s worst droughts?. Geophys. Res. Lett. 36(4), 1–5. https://doi.org/10.
1029/2008GL036801 (2009).
8. Risbey, J. S., Pook, M. J., McIntosh, P. C., Wheeler, M. C. & Hendon, H. H. On the remote drivers of rainfall variability in Australia.
Mon. Weather Rev. 137, 3233–3253. https://doi.org/10.1175/2009MWR2861.1 (2009).
Scientific Reports | (2021) 11:16136 | https://doi.org/10.1038/s41598-021-95531-4 14
Vol:.(1234567890)www.nature.com/scientificreports/
9. Kingsford, R. T. & Thomas, R. F. Destruction of wetlands and waterbird populations by dams and irrigation on the Murrumbidgee
River in arid Australia. Environ. Manag. 34, 383–396. https://doi.org/10.1007/s00267-004-0250-3 (2004).
10. Page, K., Reid, A., Frazier, P. & Mount, N. The effect of altered flow regime on the frequency and duration of bankfull discharge:
Murrumbidgee River, Australia. River Res. Appl. 21, 567–578. https://doi.org/10.1002/rra.828 (2005).
11. Ren, S. & Kingsford, R. T. Modelling impacts of regulation on flows to the Lowbidgee floodplain of the Murrumbidgee River,
Australia. J. Hydrol. 519, 1660–1667. https://doi.org/10.1016/j.jhydrol.2014.09.003 (2014).
12. Speer, M. S. Digitisation of weekly Murrumbidgee River heights at Hay southeastern Australia 1873–2017. Geosci. Data J. 5, 9–13.
https://doi.org/10.1002/gdj3.54 (2018).
13. McBride, J. L. & Nicholls, N. Seasonal relationships between Australian rainfall and the southern oscillation. Mon. Weather Rev.
111, 1998–2004. https://doi.org/10.1175/1520-0493 (1983).
14. Australian Bureau of Meteorology and CSIRO. State of the Climate 2020. https://bom.gov.au/state-of-the-climate/ (2020).
15. Ham, Y.-G. A reduction in the asymmetry of ENSO amplitude due to global warming: The role of atmospheric feedback. Geophys.
Res. Lett. 44, 8576–8584. https://doi.org/10.1002/2017GL074842 (2017).
16. Kohyama, T., Hartmann, D. L. & Battisti, D. S. Weakening of nonlinear ENSO under global warming. Geophys. Res. Lett. 45, 8557.
https://doi.org/10.1029/2018GL079085 (2018).
17. Climate Change 2014: Synthesis Report. Contribution of Working Groups I, II and III to the Fifth Assessment Report of the Intergov-
ernmental Panel on Climate Change. Pachauri et al. https://epic.awi.de/id/eprint/37530/.
18. Morice, C. P., Kennedy, J. J., Rayner, N. A. & Jones, P. D. Quantifying uncertainties in global and regional temperature change
using an ensemble of observational estimates: The HadCRUT4 dataset. J. Geophys. Res. 117, D08101. https://d oi.o
rg/1 0.1 029/2 011J
D017187 (2012).
19. NOAA. National Centers for Environmental Information, State of the Climate: Global Climate Report for 2019. https://www.ncdc.
noaa.gov/sotc/global/201913/supplemental/page-3. Published Online January 2020. Accessed 3 Feb 2021.
20. Cai, W. & Cowan, T. Southeast Australia autumn rainfall reduction: A climate-change-induced poleward shift of ocean-atmosphere
circulation. J. Clim. 26, 189–205. https://doi.org/10.1175/JCLI-D-12-00035.1 (2013).
21. Lin, Z., Li, Y., Liu, Y. & Hu, A. The decadal reduction of Southeastern Australian rainfall since the early 1990s: A response to sea
surface temperature warming in the subtropical South Pacific. J. Clim. 33, 2249–2261. https://doi.org/10.1175/JCLI-D-19-0686-1
(2020).
22. Cai, W. & Cowan, T. Dynamics of late autumn rainfall reduction over southeastern Australia. Geophys. Res. Lett. 35(L09708), 5.
https://doi.org/10.1029/2008GL033727 (2008).
23. Chiew, F. H. S. et al. Observed hydrologic non-stationarity in far south-eastern Australia: Implications for modelling and predic-
tion. Stoch. Environ. Res. Risk Assess. 28, 3–15. https://doi.org/10.1007/s00477-013-0755-5 (2014).
24. Loch, A., Auricht, C., Adamson, D. & Mateo, L. Markets, mis-direction and motives: A factual analysis of hoarding and speculation
in southern Murray-Darling Basin water markets. AJARE 65, 291–317. https://doi.org/10.1111/1467-8489.12419 (2021).
25. Potter, N. J. & Chiew, F. H. S. An investigation into changes in climate characteristics causing the recent very low runoff in the
southern Murray-Darling Basin using rainfall-runoff models. J. Hydrol. 381, 52–64. https://d oi.o
rg/1 0.1 029/2 010WR 01033 3 (2010).
26. Sharma, A., Wasko, C. & Lettenmaier, D. P. If precipitation extremes are increasing, why aren’t floods?. Water Res. Res. 54, 8545–
8551. https://doi.org/10.1029/2018WR023749 (2018).
27. Abram, N. J. et al. Evolution of the southern annular mode during the past millennium. Nat. Clim. Change 4, 564–569. https://doi.
org/10.1038/NCLIMATE2235 (2014).
28. Fowler, K. et al. Many commonly used rainfall-runoff models lack long, slow dynamics: Implications for runoff projections. Water
Res. Res. 56, e2019WR025286. https://doi.org/10.1029/2019WR025286 (2020).
29. MDBA. Water Act 2007—Basin Plan 2012. Prepared By the Murray-Darling Basin Authority. http://www.comlaw.gov.au/Details/
F2012L02240 (2012).
30. Lau, K. M. & Weng, H. Climate signal detection using wavelet transform: How to make a time series sing. Bull. Am. Meteorol. Soc.
76, 2391–2402. https://doi.org/10.1175/1520-0477(1995)076%3c2391:CSDUWT%3e2.0.CO;2 (1995).
31. Torrence, C. & Compo, G. P. A practical guide to wavelet analysis. Bull. Am. Meteorol. Soc. 79, 61–78. https://doi.org/10.1175/
1520-0477(1998)079%3c0061:APGTWA%3e2.0.CO;2 (1998).
32. Hartigan, J., MacNamara, S., Leslie, L. M. & Speer, M. Attribution and prediction of precipitation and temperature trends within
the Sydney catchment using machine learning. Climate 8, 120. https://doi.org/10.3390/cli8100120 (2020).
Acknowledgements
The authors acknowledge the University of Technology Sydney for supporting this research. JH acknowledges
support from the Australian Government Research Training Program Scholarship.
Author contributions
M.S. conceived much of the study, wrote the first draft and provided 3 figures; L.L. conceived some of the study
and assisted in the writing of the manuscript; S.M. assisted in reviewing the manuscript; J.H. provided many of
the figures and assisted in reviewing the manuscript.
Competing interests
The authors declare no competing interests.
Additional information
Supplementary Information The online version contains supplementary material available at https://doi.org/
10.1038/s41598-021-95531-4.
Correspondence and requests for materials should be addressed to M.S.S.
Reprints and permissions information is available at www.nature.com/reprints.
Publisher’s note Springer Nature remains neutral with regard to jurisdictional claims in published maps and
institutional affiliations.
Scientific Reports | (2021) 11:16136 | https://doi.org/10.1038/s41598-021-95531-4 15
Vol.:(0123456789)www.nature.com/scientificreports/
Open Access This article is licensed under a Creative Commons Attribution 4.0 International
License, which permits use, sharing, adaptation, distribution and reproduction in any medium or
format, as long as you give appropriate credit to the original author(s) and the source, provide a link to the
Creative Commons licence, and indicate if changes were made. The images or other third party material in this
article are included in the article’s Creative Commons licence, unless indicated otherwise in a credit line to the
material. If material is not included in the article’s Creative Commons licence and your intended use is not
permitted by statutory regulation or exceeds the permitted use, you will need to obtain permission directly from
the copyright holder. To view a copy of this licence, visit http://creativecommons.org/licenses/by/4.0/.
© The Author(s) 2021
Scientific Reports | (2021) 11:16136 | https://doi.org/10.1038/s41598-021-95531-4 16
Vol:.(1234567890)You can also read