IMPACT OF REPEATED NASAL SAMPLING ON DETECTION AND QUANTIFICATION OF SARS COV 2 - NATURE
←
→
Page content transcription
If your browser does not render page correctly, please read the page content below
www.nature.com/scientificreports
OPEN Impact of repeated nasal sampling
on detection and quantification
of SARS‑CoV‑2
Joshua M. Levy1,2,12, Jennifer K. Frediani2,3,12, Erika A. Tyburski1,4, Anna Wood7,
Janet Figueroa7, Russell R. Kempker1,5, Paulina A. Rebolledo1,5,6, Mark D. Gonzalez1,8,9,
Julie Sullivan1,7, Miriam B. Vos1,7,8, Jared O’Neal1, Greg S. Martin1,5, Wilbur A. Lam1,9,10,11* &
Jesse J. Waggoner1,5,6*
The impact of repeated sample collection on COVID-19 test performance is unknown. The FDA and
CDC currently recommend the primary collection of diagnostic samples to minimize the perceived risk
of false-negative findings. We therefore evaluated the association between repeated sample collection
and test performance among 325 symptomatic patients undergoing COVID-19 testing in Atlanta,
GA. High concordance was found between consecutively collected mid-turbinate samples with both
molecular (n = 74, 100% concordance) and antigen-based (n = 147, 97% concordance, kappa = 0.95,
CI = 0.88–1.00) diagnostic assays. Repeated sample collection does not decrease COVID-19 test
performance, demonstrating that multiple samples can be collected for assay validation and clinical
diagnosis.
Diagnostic testing for SARS-CoV-2 is essential for guiding acute-phase clinical management, initiation or con-
tinuation of patient isolation, and the need for epidemiologic surveillance and community response. Ensuring
accurate test results is of utmost importance to combat the COVID-19 pandemic. Standard of care (SOC)
COVID-19 testing in the acute-phase relies on real-time reverse transcription polymerase chain reaction (rRT-
PCR) or antigen detection. Per Centers for Disease Control and Prevention (CDC) guidance, such tests can be
performed on a variety of samples, including nasopharyngeal (NP), nasal [mid-turbinate (MT) and anterior
nares], and oropharyngeal swabs. SARS-CoV-2 detection is highly dependent on the type and quality of speci-
men obtained1. In all cases, specimen collection involves removing potentially limited diagnostic material from
the patient2. If multiple samples are required for testing, there is concern that viral detection will be significantly
reduced in the second sample, leading to false-negative results for certain methods or different pathogens.
The issue of repeat testing comes to the fore in two important scenarios: device evaluation and clinical test-
ing. New SARS-CoV-2 diagnostics under evaluation are frequently designed for near-care, point-of-care, or
in-home use. As a result, these come as test kits with engineered swabs and reaction vessels that may not be
compatible with routine swabs collected for SOC methods. Because of the possibility of “taking away the virus/
sample”, the Federal Drug Administration (FDA) and CDC recommended that SOC NP swabs be collected first
during a clinical comparison study between a new device and the SOC. Clinically, the etiology of respiratory
tract infections are often indistinguishable, and testing may require multiple tests from separate specimens of
the same anatomical site. The FDA/CDC recommendation for the order of sample collection raises the dilemma
for clinicians regarding which sample, for which pathogen, to collect first and if diagnostic yield in the second
sample will be affected. This will be a consideration whenever multiple swabs are necessary for SOC testing.
The current study sought to address concerns regarding the reproducibility of both SARS-CoV-2 rRT-PCR
and antigen testing on paired MT swabs obtained during a single encounter for both clinical care and as a center
1
The Atlanta Center for Microsystems-Engineered Point-of-Care Technologies, Atlanta, GA, USA. 2Department of
Otolaryngology‑Head and Neck Surgery, Emory University School of Medicine, Atlanta, GA, USA. 3Nell Hodgson
Woodruff School of Nursing, Emory University, Atlanta, GA, USA. 4Georgia Institute of Technology, Atlanta, GA,
USA. 5Department of Medicine, Emory University School of Medicine, Atlanta, GA, USA. 6Rollins School of Public
Health, Emory University, Atlanta, GA, USA. 7Department of Pediatrics, Emory University School of Medicine,
Atlanta, GA, USA. 8Children’s Healthcare of Atlanta, Atlanta, GA, USA. 9Department of Pathology and Laboratory
Medicine, Emory University School of Medicine, Atlanta, GA, USA. 10Aflac Cancer & Blood Disorders Center at
Children’s Healthcare of Atlanta, Atlanta, GA, USA. 11Wallace H. Coulter Department of Biomedical Engineering,
Emory University and Georgia Institute of Technology, Atlanta, GA, USA. 12These authors contributed equally:
Joshua M. Levy and Jennifer K. Frediani *email: Wilbur.lam@emory.edu; jjwaggo@emory.edu
Scientific Reports | (2021) 11:14903 | https://doi.org/10.1038/s41598-021-94547-0 1
Vol.:(0123456789)www.nature.com/scientificreports/
Categories Overall (N = 325) MT rRT-PCR (N = 178) MT antigen (N = 147)
Total, n (%)
Adult 196 (60.3%) 100 (56.2%) 96 (65.3%)
Pediatric 129 (39.7%) 78 (43.8%) 51 (34.7%)
Age, years
Mean (min–max) 33.1 (0.1–82.6) 32.1 (0.1–82.6) 34.3 (0.4–78.3)
Median (25th–75th) 33.6 (9.3–54.8) 28.8 (9.5–55.2) 36.8 (9.0–54.2)
Gender, n (%)
Male 164 (50.5%) 91 (51.1%) 73 (49.7%)
Female 161 (49.5%) 87 (48.9%) 74 (50.3%)
Race, n (%)
White 110 (33.8%) 69 (38.8%) 41 (27.9%)
Black/African American 164 (50.5%) 81 (45.5%) 83 (56.5%)
Asian 17 (5.2%) 12 (6.7%) 5 (3.4%)
Other 34 (10.5%) 16 (9.0%) 18 (12.2%)
Ethnicity, n (%)
Hispanic 44 (13.5%) 24 (13.5%) 20 (13.6%)
Non-hispanic 281 (86.5%) 154 (86.5%) 127 (86.4%)
Days post-symptom onset
Mean (min–max) 3.5 (0.0–7.0) 3.4 (0.0–7.0) 3.6 (0.0–7.0)
Median (25th–75th) 3.0 (2.0–5.0) 3.0 (2.0–5.0) 3.0 (2.0–5.0)
NP result, n (%)
Positive 128 (39.4%) 74 (41.6%) 54 (36.7%)
Negative 197 (60.6%) 104 (58.4%) 93 (63.3%)
Table 1. Overall, MT rRT-PCR group and MT antigen group participant demographics. Missing: n = 1 for
race/ethnicity (refused to answer).
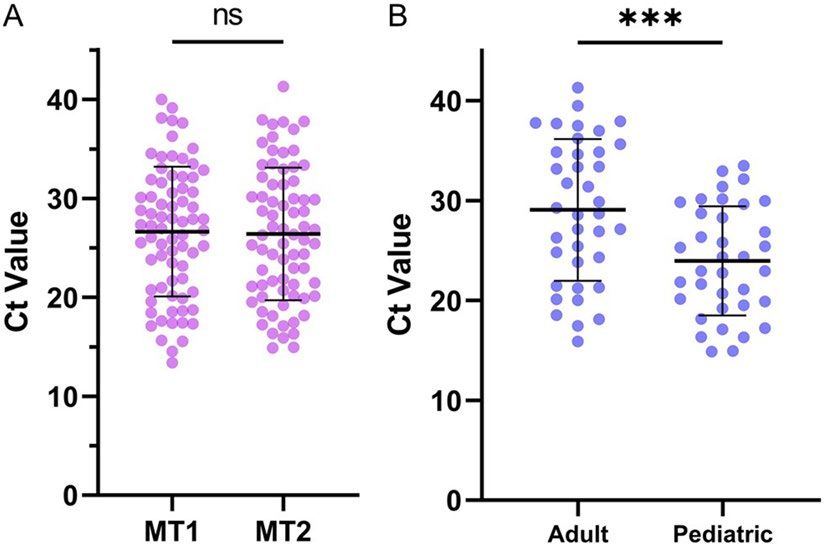
Figure 1. Repeated mid-turbinate sampling does not impact test performance. (A) MT1 vs. MT2 mean Ct
values did not differ significantly (p = 0.21). (B) MT1 Ct values for adult and pediatric participants; pediatric Ct
values were significantly lower than adult Ct values (p < 0.01, adjusted for days post-symptom onset).
in the NIH Rapid Acceleration of Diagnostics program tasked with evaluating new rapid tests. We hypothesized
that repeated collection of consecutive MT samples does not impact test sensitivity for either amplification or
antigen-based assays.
Results
Patient population. There were 325 participants. Demographics including participant age, sex, race and
number of days since symptom onset are in Table 1.
Molecular. There was 100% concordance of rRT-PCR results among 74 NP positive patients between MT1
and MT2 tests (72 positive and 2 negative pairs). Additionally, the average Ct value did not differ significantly
between MT1 and MT2 samples [median (IQR): MT1 27.09 (20.87–31.30), MT2 26.03 (20.89–31.57), p = 0.21;
Fig. 1A]. Ct values among pediatric participants were, on average, lower than Cts for adults even after adjusting
for days post-symptom onset [median (IQR): pediatric 22.96 (19.53–29.64), adult 28.69 (23.84–34.84), p < 0.01;
Scientific Reports | (2021) 11:14903 | https://doi.org/10.1038/s41598-021-94547-0 2
Vol:.(1234567890)www.nature.com/scientificreports/
MT2 positive MT2 negative MT2 indeterminate Total
a. Concordance between paired MT rRT-PCR samples (N = 74)
MT1 positive 72 0 0 72
MT1 negative 0 2 0 2
MT1 indeterminate 0 0 0 0
Total 72 2 0 74
b. Concordance between paired MT antigen samples (N = 147)
MT1 positive 39 2 0 41
MT1 negative 1 104 0 105
MT1 indeterminate 1 0 0 1
Total 41 106 0 147
NP rRT-PCR positive NP rRT-PCR negative Total
c. Concordance between paired MT antigen samples and NP rRT-PCR (N = 143a)
MT1 + MT2 antigen positive 37 2 39
MT1 + MT2 antigen negative 14 90 104
Total 51 92 143
Table 2. Impact of repeated sample collection on test performance. a: McNemar’s test for agreement of
positive/negative results: N/A No discordant pairs. a: Kappa coefficient (exact 95% CI): 1.00 (N/A). a: Overall
agreement (exact 95% CI): 100% (N/A). b: McNemar’s test for agreement of positive/negative results: p = 0.56.
b: Kappa coefficient (exact 95% CI): 0.95 (0.88–1.00). b: Overall agreement (exact 95% CI): 97% (0.93–0.99).
c: Sensitivity (exact 95% CI): 0.73 (0.58–0.84); Specificity (exact 95% CI): 0.98 (0.92–1.00). c: McNemar’s test
for agreement of positive/negative results: p = 0.003. c: Kappa coefficient (exact 95% CI): 0.74 (0.63–0.86). c:
Overall agreement (exact 95% CI): 88.8% (0.82–0.93). a Discordant MT1 and MT2 antigen results excluded
(n = 4).
Fig. 1B]. This did not impact concordance between MT1 and MT2 rRT-PCR results. 97.3% (72/74) concordance
was demonstrated between the results of molecular tests at MT and NP sites.
Antigen. There was 97% concordance among 147 patients with MT1 and MT2 antigen tests, including 39
positive and 104 negative pairs (95% positive concordance, 98% negative concordance; Table 2). The sequence
of results among the four discordant pairs were as follows: two MT1 positive/MT2 negative, one MT1 negative/
MT2 positive and one MT1 indeterminate/MT2 positive. Among discordant MT antigen pairs, the mean associ-
ated RT-PCR Ct value was 25.61 (range 19.04–31.4). After excluding samples with discordant MT1 and MT2
antigen results (n = 4), 97.3% correlation was found between test results from from MT and NP sources.
Discussion
Both the FDA and CDC have expressed concern that the sensitivity of SARS-CoV-2 detection may decline in
sequentially collected samples. Previous device evaluations employed a number of study designs to address
this issue, including the use of different n ares3, distinct anatomical s ites4,5, or alternating the order of sample
6
collection . However, in clinical practice, such measures are not possible and may introduce different biases, such
as diagnostic yield between different nares or specimen t ypes7. The current study demonstrates high concordance
between sequential MT samples collected during a single clinical encounter, including complete concordance
of results among 74 paired samples tested by rRT-PCR and 97% concordance among paired samples tested for
SARS-CoV-2 antigen. These data demonstrate there is ample SARS-CoV-2 virus across a range of viral loads
(based on Ct values) to allow for repeated MT sampling if required for multiple tests. In addition, these data
support the use of MT sampling as a less invasive collection method for point-of-care and potentially at home
testing, with 88.8% concordance (exact CI = 0.82–0.93) between MT antigen test and NP rRT-PCR results.
The current study focused on MT samples, which are being increasingly used for SARS-CoV-2 diagnostic
testing3. These results cannot necessarily be generalized to the collection of other nasal or oral specimens.
Additionally, we did not vary the order of the nasal sampling with SOC NP sampling. In pediatric patients,
NP samples were always last and in adults they were always first. Despite these limitations, this study provides
proof that SARS-CoV-2 diagnostic test performance is maintained among multiple MT samples when taken at
the same encounter. These data have implications for clinical testing algorithms and the design of future device
evaluation studies.
Methods
Clinical samples. Paired, sequential MT swabs were obtained from 325 participants from COVID-19 testing
centers utilized by the Atlanta Center for Microsystems Engineered Point-of-Care Technologies (ACME-POCT)
network and affiliated with Emory University, Grady Memorial Hospital and Children’s Healthcare of Atlanta.
Inclusion criteria were symptomatic respiratory illness for ≤ 7 days and a documented SARS-CoV-2 molecular
test obtained within 24 h of study enrollment. SOC molecular tests differed by site and included the Roche Cobas
6800, Abbott Alinity, and Panther Fusion. NP swabs obtained for SOC testing were collected prior to MT swabs
Scientific Reports | (2021) 11:14903 | https://doi.org/10.1038/s41598-021-94547-0 3
Vol.:(0123456789)www.nature.com/scientificreports/
in adults and after in children. Exclusion criteria included inability to tolerate MT swabs or provide informed
consent. Clinical and demographic variables were collected in web-based databases (REDCap, Nashville, TN).
The study protocol was approved by the Emory University Institutional Review Board, Children’s Healthcare
of Atlanta and the Grady Research Oversight Committee. All experiments were performed in accordance with
relevant guidelines and regulations. Informed consent was obtained from all participating subjects, including
from a parent and/or legal guardian if the patient was under the age of 18 years.
SARS‑CoV‑2 testing. Each participant gave two MT samples plus a NP. Of the first 178 participants, 74
tested positive by NP rRT-PCR and had MT pairs tested by rRT-PCR for the current study. MT pairs from the
remaining 147 participants were tested for antigen (Supplementary Figure 1). MT swabs for rRT-PCR testing
were collected using flocked tapered swabs (Copan FLOQSwab, Ref # 520CS01)8. Swabs were placed in 1 mL of
saline in a sterile tube. Samples were stored at 4 °C for up to 72 h or − 80 °C if longer delays were expected. Sam-
ples were extracted from 500 µL of saline on an eMAG instrument (bioMeriéux) and eluted in 50 µL of buffer.
Eluates were tested in an internally controlled, duplex rRT-PCR for the SARS-CoV-2 N2 target and RNase P.
Oligonucleotide concentrations, master mix preparation, and cycling conditions were maintained from a previ-
ously published, triplex assay that included these two targets9. Paired MT swabs were tested side-by-side on a
single run.
Sample collection was the same for antigen tests and were completed using the Abbott BinaxNOW™ COVID-
19 Ag Card Home Test (Abbott Laboratories, Abbott Park, IL). Results were recorded for both completed tests.
Statistical analysis. Statistical analyses were performed using SAS 9.4 (Cary, NC). Agreement between
the first (MT1) and second MT (MT2) antigen results was assessed using Cohen’s Kappa coefficient with exact
95% confidence intervals. McNemar’s test evaluated overall differences in MT1 vs. MT2 antigen results. Paired
t-tests were used for MT1 vs. MT2 Ct comparisons and Wilcoxon signed-rank tests were used for overall adult
vs. pediatric Ct comparisons.
Received: 16 March 2021; Accepted: 7 July 2021
References
1. Binnicker, M. J. Challenges and controversies to testing for Covid-19. J. Clin. Microbiol. https://doi.org/10.1128/Jcm.01695-20
(2020).
2. Zou, L. et al. Sars-Cov-2 viral load in upper respiratory specimens of infected patients. N. Engl. J. Med. 382, 1177–1179. https://
doi.org/10.1056/Nejmc2001737 (2020).
3. Lindner, A. K. et al. Head-to-head comparison of Sars-Cov-2 antigen-detecting rapid test with self-collected anterior nasal swab
versus professional-collected nasopharyngeal swab. Eur. Respir. J. https://doi.org/10.1183/13993003.03961-2020 (2020).
4. Prince-Guerra, J. L. et al. Evaluation of Abbott Binaxnow rapid antigen test for Sars-Cov-2 infection at two community-based
testing sites—Pima County, Arizona, November 3–17, 2020. MMWR Morb. Mortal. Wkly. Rep. 70, 100–105. https://doi.org/10.
15585/Mmwr.Mm7003e3 (2021).
5. Callahan, C. J. et al. Open development and clinical validation of multiple 3d-printed nasopharyngeal collection swabs: Rapid
resolution of a critical Covid-19 testing bottleneck. J. Clin. Microbiol. https://doi.org/10.1128/Jcm.00876-20 (2020).
6. James, A. E. et al. Performance of the Binaxnow Coronavirus Disease 2019 (Covid-19) antigen card test relative to the severe acute
respiratory coronavirus virus 2 (Sars-Cov-2) real-time reverse transcriptase polymerase chain reaction (Rrt-Pcr) assay among
symptomatic and asymptomatic healthcare employees. Infect. Control Hosp. Epidemiol. https://d oi.o
rg/1 0.1 017/I ce.2 021.2 0 (2021).
7. Wang, W. et al. Detection of Sars-Cov-2 in different types of clinical specimens. JAMA 323, 1843–1844. https://doi.org/10.1001/
Jama.2020.3786 (2020).
8. Centers for Disease Control and Prevention, Interim Guidelines for Collecting and Handling of Clinical Specimensfor COVID-19
Testing. https://www.cdc.gov/coronavirus/2019-ncov/lab/guidelines-clinical-specimens.html (2021)
9. Waggoner, J. J. et al. Triplex real-time Rt-Pcr for severe acute respiratory syndrome coronavirus 2. Emerg. Infect. Dis. 26, 1633–1635.
https://doi.org/10.3201/Eid2607.201285 (2020).
Author contributions
J.M.L.—Trial oversight, coordination, analysis, drafting of manuscript. J.F.K.—Trial oversight, coordination,
analysis, drafting of manuscript. E.A.T.—Coordination, drafting of manuscript. A.W.—Data analysis and inter-
pretation, drafting of manuscript. J.F.—Data analysis and interpretation, drafting of manuscript. R.R.K.—Patient
enrollment, oversight and manuscript review. P.A.R.—Patient enrollment, oversight and manuscript review.
M.D.G.—Data analysis, interpretation and manuscript review. J.S.—Patient enrollment, oversight and manu-
script review. M.B.V.—Data analysis, interpretation and manuscript review. J.O.—Patient enrollment, oversight
and manuscript review. G.S.M.—Trial oversight, coordination, data analysis, manuscript review. W.A.L.—Trial
oversight, coordination, data analysis, manuscript review. J.J.W.—Trial oversight, coordination, data analysis,
manuscript review.
Funding
RADx, Grant/Award Number: U54 EB027690 02S1, UL1 TR002378.
Competing interests
The authors declare no competing interests.
Scientific Reports | (2021) 11:14903 | https://doi.org/10.1038/s41598-021-94547-0 4
Vol:.(1234567890)www.nature.com/scientificreports/
Additional information
Supplementary Information The online version contains supplementary material available at https://doi.org/
10.1038/s41598-021-94547-0.
Correspondence and requests for materials should be addressed to W.A.L. or J.J.W.
Reprints and permissions information is available at www.nature.com/reprints.
Publisher’s note Springer Nature remains neutral with regard to jurisdictional claims in published maps and
institutional affiliations.
Open Access This article is licensed under a Creative Commons Attribution 4.0 International
License, which permits use, sharing, adaptation, distribution and reproduction in any medium or
format, as long as you give appropriate credit to the original author(s) and the source, provide a link to the
Creative Commons licence, and indicate if changes were made. The images or other third party material in this
article are included in the article’s Creative Commons licence, unless indicated otherwise in a credit line to the
material. If material is not included in the article’s Creative Commons licence and your intended use is not
permitted by statutory regulation or exceeds the permitted use, you will need to obtain permission directly from
the copyright holder. To view a copy of this licence, visit http://creativecommons.org/licenses/by/4.0/.
© The Author(s) 2021
Scientific Reports | (2021) 11:14903 | https://doi.org/10.1038/s41598-021-94547-0 5
Vol.:(0123456789)You can also read