Different Approaches to Incorporate the Aspect of Practical Relevance in the Statistical Inferential Process
←
→
Page content transcription
If your browser does not render page correctly, please read the page content below
methods, data, analyses | 2022, pp. 1-9                                 DOI: 10.12758/mda.2022.07

Different Approaches to Incorporate the
Aspect of Practical Relevance in the
Statistical Inferential Process

Andreas Quatember
Johannes Kepler University Linz, Austria

Abstract
In different scientific areas, empirical studies are typically carried out by statistical null
hypothesis tests. Despite the long tradition of applications, misinterpretations and misuses
of the concept have led to a substantial confidence crisis in its inferential quality. One of
the discussed issues is the significance-relevance discrepancy of the results of standardly
applied zero-effect null hypothesis tests. This means that statistically significant test results
do not automatically also have to be of scientific relevance in the specific research context.
Therefore, this article is aimed at practitioners of empirical research who might want to in-
clude the aspect of practical relevance in their statistical conclusions. Different approaches
to include this aspect in the inferential process are discussed with an example from the field
of educational research.

Keywords: Null hypothesis significance test; effect size; significance thresholds; relevance
          thresholds; statistical literacy

                    © The Author(s) 2022. This is an Open Access article distributed under the terms of the
                    Creative Commons Attribution 3.0 License. Any further distribution of this work must
                    maintain attribution to the author(s) and the title of the work, journal citation and DOI.
2 methods, data, analyses | 2022, pp. 1-9
In areas such as the social, behavioral, or educational sciences; in economics; or in
medicine, empirical studies are commonly carried out with the application of sta-
tistical null hypothesis significance tests. For many of these methods, R. A. Fisher
provided the theory in his book, Statistical Methods for Research Workers, first
published in 1925 (Fisher, [1925] 1990) and he described the general theoretical
framework by a famous experimental setup, “The Lady Tasting Tea”, which was
published in his book, The Design of Experiments, in 1935 (Fisher, [1935] 1990).
Despite this long history of applications of this technique from the field of infer-
ential statistics, misinterpretations of its results and misuses of the procedure have
led to a veritable confidence crisis with regard to its inferential quality (for instance,
Greenland et al., 2016: 341; Wasserstein & Lazar, 2016: 129). Under these circum-
stances, the American Statistical Association (ASA) decided to publish a statement
on statistical significance and p-values containing several broadly agreed upon
principles underlying the proper use of this method of inferential statistics (Was-
serstein & Lazar, 2016). Furthermore, the editors of The American Statistician, a
journal published by the ASA, decided to dedicate a special issue of the journal to
the topic. The contributions contained many ideas that were published to enable
wider consideration and debate (Wasserstein, Schirm & Lazar, 2019).
One of the issues under discussion is the significance-relevance discrepancy
(for an example, see Nuzzo, 2014: 151f). By this term, it is meant that so-called
statistically significant test results do not automatically also have to be of practical
(or scientific) relevance in the specific research context. But, empirical researchers
“rarely distinguish between the statistical and the practical significance of their
results. Or worse, results that are found to be statistically significant are interpreted
as if they were practically meaningful” (Ellis, 2010: 4).
In this article, which is mainly intended to practitioners of empirical research,
the approaches that incorporate the aspect of practical importance of survey results
in the statistical inferential process are described as a contribution to this debate.
For this purpose, a research question from the field of educational sciences will
serve as an explanatory example. Section 2 addresses the difficulty of the specifi-
cation of the thresholds, which have the task to separate the practically important
from the nonimportant test results. Section 3 discusses different concepts of the
consideration of their practical importance. The concluding fourth section summa-
rizes the aspects of the significance-relevance discrepancy.
Direct correspondence to
Andreas Quatember, Institute of Applied Statistics, Johannes Kepler University JKU
Linz, Science Park 2, Altenberger Str. 69, A-4020 Linz, Austria, www.jku.at/ifas
E-mail: andreas.quatember@jku.atQuatember: Different Approaches to Incorporate the Aspect of Practical ... 3
The Aspect of Practical Relevance
Throughout the article, the following research question from the field of educa-
tional sciences will serve as the explanatory example, from which similar consid-
erations can be derived for other study questions: Are the obtained test results of
the students of country A in an interesting competence area better than the results
of the students of country B? Based on this research question, the null hypothesis
H0 and the alternative hypothesis H1 for the statistical null hypothesis significance
test of the difference δ = µ A – µ B between the true mean values, µ A and µ B, of the
countries’ students are formulated as follows:
H0: δ ≤ 0 and H1: δ > 0
Only with a full survey of the students in both countries, it would have been pos-
sible to make a definitely correct decision between these two hypotheses.
However, is really each difference δ > 0 practically relevant? In other words,
is really each “effect” (of different school systems, forms of teaching, etc.) larger
than zero practically meaningful? There cannot be given a general answer to this
question because the answer completely depends on the research context. In any
case, this aspect also occurs with population surveys. But if not all effects δ > 0
are of practical importance, the next question that automatically arises is: How
big an effect δ in the specific scientific context has to be in order to be of practical
importance?
In the specific scientific context, different approaches can lead to the determi-
nation of a certain relevance threshold, which shall separate the nonrelevant from
the relevant effects. First, such a threshold may be directly derived from the given
research question (research-driven approach). In our example, the actual research
question under investigation may be that the difference δ of the mean values of the
two groups became larger compared to the difference δ 0 in a previous population
survey. Accordingly, the derived relevance-threshold δR of the difference δ should
be set at δ 0.
Second, there may be a consensus about those effect sizes that are of practical
importance (expertise-driven approach). In our example from the field of student
assessment, experts may, for instance, agree on a certain relevance-threshold δR
with regard to the difference δ.
Third, a convention might be applied with respect to the calculation of a rea-
sonable relevance threshold (convention-driven approach). In his milestone book
in the field of behavioral sciences, Cohen (1969), for instance, expresses relevant
effect sizes in units of the variability of the variable under study. For population
differences δ (with the known standard deviation σ of the variable under study
assumed to be equal in both populations), he specifies a relevance threshold4 methods, data, analyses | 2022, pp. 1-9
of δR = 0.2 · σ for the search for an at least small,
of 0.5 · σ for the search of an at least medium, and
0.8 · σ for the investigation of a large effect (Cohen, 1969: Section 2.2).
For our example, assuming that a relevant effect has at least to be a small one, one
can use the pooled estimated standard deviation from the last survey to determine
the corresponding convention-driven δR.
Of course, because such a relevance threshold is a continuous quantity, one
can object that there is no content-related reason that test statistics being only a
little bit smaller or larger, respectively, than δR shall be differently interpreted with
respect to its practical meaningfulness. However, one can argue against this that
there are countless other examples for the usefulness of such arbitrary limits in
everyday life. Just think, for instance, in medicine of the categorizations of the
total cholesterol level of adults. Values of less than 200 mg/dL are “considered
desirable”, values from 200 to 240 mg/dL are called “borderline high”, and those
more than 240 mg/dL are called “high”. Depending on the category in which a per-
son belongs, different therapeutic measures are recommended (MNT, 2021). Other
examples include the thresholds of the risk of poverty in official statistics, the legal
limit of blood alcohol for driving a car, the permissible fine dust pollution in a city,
or also the significance level α of a statistical null hypothesis test (see for its history:
Cowles & Davis, 1982). In all of these examples, there is no reasonable justification
for the strict categorizations except for one: They are all undeniably pragmatic with
regard to the objectivity of the criteria for decisions derived from them.
Clearly, the specification of such relevance thresholds is crucial when the
practical meaningfulness of test results shall be included in the inferential process.
If it is not at all possible to fix such a threshold before the investigation, then it will
also not be possible afterward to assess the practical importance of the test statistic.
Assuming that such a threshold can be determined, the next question is naturally:
How can the aspect of practical meaningfulness of a result be incorporated in the
statistical inferential strategy?
A Marriage Between Statistical Significance and
Practical Relevance
In the practice of empirical research, independently of any research context, the
null hypothesis postulates the complete absence of an effect as a rule. The impact of
the implementation of such a “zero-effect null hypothesis” H0 is that with increas-
ing sample size even for very tiny, practically irrelevant effects larger than zero, the
probability of the, then, correct rejection of H0, which is the test power, increases.Quatember: Different Approaches to Incorporate the Aspect of Practical ... 5
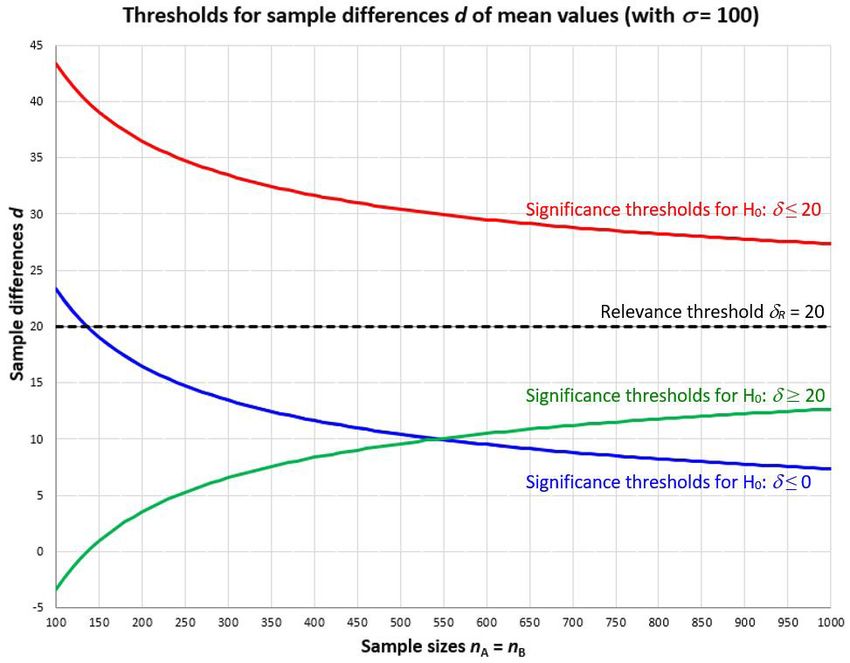
Figure 1 Thresholds for sample differences d of mean values for the different
approaches to the incorporation of the aspect of practical relevance.
This is particularly problematic in the big data context of survey statistics (Meng,
2018).
In Figure 1, for the two sample t-test from our example with the test statistic
t = d/σd (with the difference d of the two sample means and the standard deviation
σd of d) under simple random sampling with replacement, among other things, the
(upper) limits for d, which separate the weak from the strong indicators against
H0: δ ≤ 0 at the significance level α = 0.05, are exemplarily shown for an assumed
σ = 100 and varying equal sample sizes nA and nB in the range from 100 to 1,000
(blue curve). For nA = nB = 750, for example, the limit between the significant
and the non-significant test results is approximately d = 8.5. But, is, for instance,
a sample difference d = 10, which in this case does speak statistically significantly
(p < 0.05) against H0: δ ≤ 0, really of practical importance in the contextual back-
ground? Based on the convention-driven approach from the previous section, for
example, the relevance-threshold could be specified by δR = 0,2 · σ = 20 (dashed
line in Figure 1). In this case, as an estimate of the true effect δ the survey result
d = 10 would not indicate the presence of practical relevance because it is below the
dashed line. For nA = nB = 100, a result of d = 22, which is below the blue curve in6 methods, data, analyses | 2022, pp. 1-9
Figure 1, would not be statistically significant, but at the same time, it would indi-
cate a practical relevance because it is above the dashed line.
On the one hand, the standardly applied, context-unrelated formulation of a
zero-effect null hypothesis does not at all consider a context-related relevant effect-
size threshold. On the other hand, the categorization of a test statistic based solely
on such a context-related relevance threshold without testing also for statistical
significance would not at all take into account the sample fluctuation of the test
statistic.
Goodman, Spruill, and Komaroff (2019) suggested a combination of these
two approaches. In the hybrid method of “decision by minimum effect size plus
p-value” (Goodman, Spruill, & Komaroff, 2019: 171f), the zero-effect null hypoth-
esis is rejected only in cases where the test statistic’s p-value is not larger than the
significance level α, and at the same time, the test statistic itself is larger than a
minimum practically meaningful effect. In Figure 1, such results d lie above the
blue curve as well as the dashed line. Compared to the standardly applied zero-
effect null hypothesis test, this concept incorporates also the practical relevance
of the statistically significant results. However, it must be noted that it only takes
account of the sampling error with respect to the null hypothesis of the complete
absence of an effect and not with respect to the relevance threshold.
If the research aim is not to check whether there is a relevant effect, but rather
whether there is no effect at all, a certain type of statistical significance testing, the
so-called “equivalence tests”, is suggested (see, for instance, Ramert & Westphal,
2020). In the field of pharmacokinetics, for example, researchers sometimes want
to show the non-inferiority of a new cheaper drug compared to an established one
(Lakens, 2017). In the statistical inferential process, the alternative hypothesis H1
always serves as the statistical translation of the research hypothesis. Therefore, in
this case, it consists of the range of parameter values that support the equivalence-
hypothesis, whereas the null hypothesis H0 consists of the range of values that do
not. Consequently, the null hypothesis H0 comprises, for instance, all differences δ
that are equal or larger than a relevance (or non-equivalence) threshold δR:
H0: δ ≥ δ R and H1: δ < δ R
However, this approach should not be applied to research questions that are intended
to test the opposite, namely the existence of a practically relevant effect. A look at
Figure 1 illustrates the problem. The green curve marks the (lower) thresholds of
statistically significant sample differences d with respect to the equivalence test
with H0: δ ≥ 20. A sample difference d, which is above this green curve but below
the dashed line of δR = 20 (like, for example, d = 0 for nA = nB = 100), indicates
on the one hand that the null hypothesis of the existence of a relevant effect cannot
be rejected when the sample fluctuation of the test statistic under the actual nullQuatember: Different Approaches to Incorporate the Aspect of Practical ... 7
hypothesis is taken into account, but on the other hand, as an estimator of the effect
size δ, it clearly indicates that there is no relevant effect.
In Fisher’s framework, it is crucial that the statistical hypotheses of the test are
formulated in such a way that it is really tested what is wanted to be tested. In prac-
tice, far too often these hypotheses are not the correct translations of the research
questions, when zero-effect null hypothesis tests are standardly performed. If in
our example from the field of educational sciences it is to be checked whether there
is a statistically significant and at the same time practically relevant positive differ-
ence δ between the means in two countries, H0 must contain all effect sizes δ that
are considered as not practically important. Hence, the statistical hypotheses would
have to be
H0: δ ≤ δ R and H1: δ > δ R .
This approach leads from a standardly applied zero-effect significance test, which
completely ignores the research context, to a context-related statistical significance
test for a practically relevant effect. Only if δR actually equals zero because even
the tiniest effects are scientifically meaningful in the specific research context, this
strategy corresponds to a zero-effect significance test.
With these hypotheses, a p-value of a relevant test statistic, which is not larger
than the significance level α, signifies that the observed data are unlikely under the
null hypothesis of no practically relevant parameter value. Consequently, a statisti-
cally significant result is automatically interpreted as being also of practical impor-
tance. Furthermore, in the case of δR > 0, in contrast to the standardly applied zero
effect test with H0: δ ≤ 0, by an increase of the test power, the probability of the
detection of a tiny but practically meaningless effect converges to zero.
For our example, the appropriate test statistic is given by t = (d–δR)/σd. From
this test statistic, the upper limits for d, which separate the weak from the strong
indicators against H0: δ ≤ δR at the significance level α = 0.05, can be derived. In
Figure 1, these are shown for δR = 20 for different sample sizes nA = nB by the red
curve. Hence, sample differences d from the area above are considered to speak
statistically significant against this null hypothesis of no relevant effect.
For the implementation of this conceptual shift from the standardly applied
context-ignoring zero-effect null-hypothesis significance test toward a content-
driven significance test for a practically relevant effect, for the investigation of a
statistical parameter, the appropriate test statistic and its sample distribution under
the null hypothesis have to be considered. This may require that users apply a test
statistic that is unfamiliar to them.8 methods, data, analyses | 2022, pp. 1-9
Summary
Results from null hypothesis significance tests are interpreted as not enough indi-
cation or as strong indication against the null hypothesis, whatever this hypothesis
was formulated. The significance-relevance discrepancy of test results only exists
if the research hypotheses are not correctly translated into the statistical hypoth-
eses. For this purpose, relevance thresholds have to be specified with respect to
the parameters under study. This can be done in the given scientific context, based
directly on the research question, on the basis of the expertise of an experienced
researcher, or on conventions. Taking into account the relevance of test results,
besides other approaches to incorporate the aspect of scientific relevance in the
inferential process, statistical significance tests for a practically relevant effect can
be performed. These have the advantage to be applicable within the traditional
framework of statistical null hypothesis significance tests. Such tests consider the
scientific importance of the test results and, at the same time, their sample fluc-
tuation under the actual null hypothesis. For their application, possibly unfamiliar,
but known appropriate test statistics and their sample distributions are to be used.
Consequently, by making the experiment more accurate, for example, by a larger
sample size, the increased test power does not lead to practically irrelevant, statisti-
cally significant results anymore.
References
Cohen, J. (1969). Statistical Power Analysis for the Behavioral Sciences. New York: Aca-
demic Press.
Cowles, M., & Davis, C. (1982). On the Origins of the .05 Level of Statistical Significance.
American Psychologist, 5, 553-558. doi:10.1037/0003-066X.37.5.553
Ellis, P. D. (2010). The Essential Guide to Effect Sizes. Cambridge: Cambridge University
Press.
Fisher, R. A. (1990). Statistical Methods, Experimental Design, and Scientific Inference. A
Re-Issue of Statistical Methods for Research Workers, The Design of Experiments, and
Statistical Methods and Scientific Inference. Oxford: Oxford University Press.
Goodman, W. M., Spruill, S. E., & Komaroff, E. (2019). A Proposed Hybrid Effect Size Plus
p-Value Criterion: Empirical Evidence Supporting its Use. The American Statistician,
73(1), 168-185. doi: 10.1080/00031305.2018.1564697
Greenland, S., Senn, S. J., Rothman, K. J., Carlin, J. B., Poole, C., Goodman, S. N., & Alt-
man, D. G. (2016). Statistical Tests, P Values, Confidence Intervals, and Power: a Guide
to Misinterpretations. European Journal of Epidemiology, 31, 337-350.
doi: 10.1007/s10654-016-0149-3
Lakens, D. (2017). Equivalence Tests: A Practical Primer for t Tests, Correlations, and Me-
ta-Analysis. Social Psychological and Personality Science, 8(4), 355-362.
doi: 10.1177/1948550617697177Quatember: Different Approaches to Incorporate the Aspect of Practical ... 9
Meng, X. L. (2018). Statistical Paradises and Paradoxes in Big Data (I): Law of Large Po-
pulations, Big Data Paradox, and the 2016 US Presidential Election. The Annals of
Applied Statistics, 12(2), 685-726.
MNT (2021). What should my Cholesterol Level be at my Age? MedicalNewsToday News-
letter. Retrieved December 02, 2021, from the website:
https://www.medicalnewstoday.com/articles/315900#treatment-options
Nuzzo, R. (2014). Statistical Errors. Nature, 506, 150-152. doi: 10.1038/506150a
Ramert, A., & Westphal, E. (2020). Equivalence Testing. STAT Center of Excellence, STAT
COE-Report-12-2020. Retrieved December 02, 2021, from the website: https://www.
afit.edu/stat/statcoe_files/1005AFIT2020ENS09117%201005rame%202-2.pdf
Wasserstein, R. L., & Lazar, N. A. (2016). The ASA Statement on p-Values: Context, Pro-
cess, and Purpose. The American Statistician, 70(2), 129-133.
doi: 10.1080/00031305.2016.1154108
Wasserstein, R. L., Schirm, A. L., & Lazar, N. A. (2019). Moving to a World Beyond “p <
0.05”. The American Statistician, 73(1), 1-19. doi: 10.1080/00031305.2019.1583913
Date of online first publication: 2022-03-31You can also read


