Humidity changes and possible forcing mechanisms over the last millennium in arid Central Asia - CP
←
→
Page content transcription
If your browser does not render page correctly, please read the page content below
Clim. Past, 18, 975–988, 2022
https://doi.org/10.5194/cp-18-975-2022
© Author(s) 2022. This work is distributed under
the Creative Commons Attribution 4.0 License.

Humidity changes and possible forcing mechanisms over the
last millennium in arid Central Asia
Shengnan Feng1 , Xingqi Liu1 , Feng Shi2,3,4 , Xin Mao1,5 , Yun Li6 , and Jiaping Wang1
1 College  of Resource, Environment and Tourism, Capital Normal University, Beijing 100048, China
2 Key  Laboratory of Cenozoic Geology and Environment, Institute of Geology and Geophysics,
Chinese Academy of Sciences, Beijing 100029, China
3 Georges Lemaître Centre for Earth and Climate Research, Earth and Life Institute,

Université Catholique de Louvain, Louvain-la-Neuve 1348, Belgium
4 CAS Center for Excellence in Life and Paleoenvironment, Beijing 100044, China
5 Institute of Hydrogeology and Environmental Geology, Chinese Academy of Geological Sciences,

Shijiazhuang 050061, China
6 Qinghai Institute of Salt Lakes, Chinese Academy of Sciences, Xining 810008, China

Correspondence: Xingqi Liu (xqliu@cnu.edu.cn)

Received: 11 October 2021 – Discussion started: 22 October 2021
Accepted: 11 April 2022 – Published: 6 May 2022

Abstract. Hydroclimate changes have exerted a significant          be seriously evaluated for hydroclimate predictions and cli-
influence on the historical trajectory of ancient civilizations    mate simulations in arid Central Asia in the future.
in arid Central Asia where the central routes of the Silk Road
have been hosted. However, the climate changes on differ-
ent timescales and their possible forcing mechanisms over          1   Introduction
the last millennium remain unclear due to low-resolution
records. Here, we provide a continuous high-resolution hu-         Arid Central Asia (ACA), far away from the ocean, is not
midity history in arid Central Asia over the past millennium       only one of the driest and largest inland regions worldwide,
based on the ∼ 1.8-year high-resolution multiproxy records         but also the birthplace of the far-reaching ancient civiliza-
with good chronological control from Lake Dalongchi in the         tions that spread along the Silk Road (Li et al., 2016; Nar-
central Tian Shan. Generally, the climate was dry during the       isma et al., 2007). Scarce precipitation, intense evaporation,
Medieval Warm Period (MWP) and Current Warm Period                 and fragile ecosystems render this region sensitive to abrupt
(CWP) and wet during the Little Ice Age (LIA), which could         changes in effective humidity. Arid Central Asia is primar-
be attributed to the influence of the North Atlantic Oscillation   ily controlled by the prevailing westerlies (F. Chen et al.,
(NAO) and the Atlantic Multidecadal Oscillation (AMO).             2019; Aizen et al., 2001; Sorrel et al., 2021; Huang et al.,
Furthermore, we find that the humidity oscillation was dra-        2015b, 2014; Lauterbach et al., 2014). The moisture vapor
matic and unstable at multidecadal to century scales. Espe-        was predominantly transported via the westerlies and origi-
cially within the LIA, four wet episodes and three dry peri-       nated from the North Atlantic Ocean, Mediterranean, Black
ods occurred. The continuous wavelet analysis and wavelet          Sea, and Aral–Caspian Sea (Lan et al., 2018; Chen et al.,
coherence show that the humidity oscillation is modulated          2010; Huang et al., 2015b; Aizen et al., 2001; Mathis et al.,
by the Gleissberg cycle at the century scale and by the quasi-     2014). Proxy records from ACA are valuable for understand-
regular period of El Niño–Southern Oscillation (ENSO) at           ing the driving factors and processes of underlying hydrocli-
the multidecadal scale. Our findings suggest that the effect of    mate evolution in the inland region, which provides useful
the solar cycle and the quasi-regular period of ENSO should        reference for human adaptation to hydroclimate changes at
                                                                   present and into the future (Li et al., 2016). On the sub-orbital
                                                                   scale, solar radiation controlled the intensity of the westerlies

Published by Copernicus Publications on behalf of the European Geosciences Union.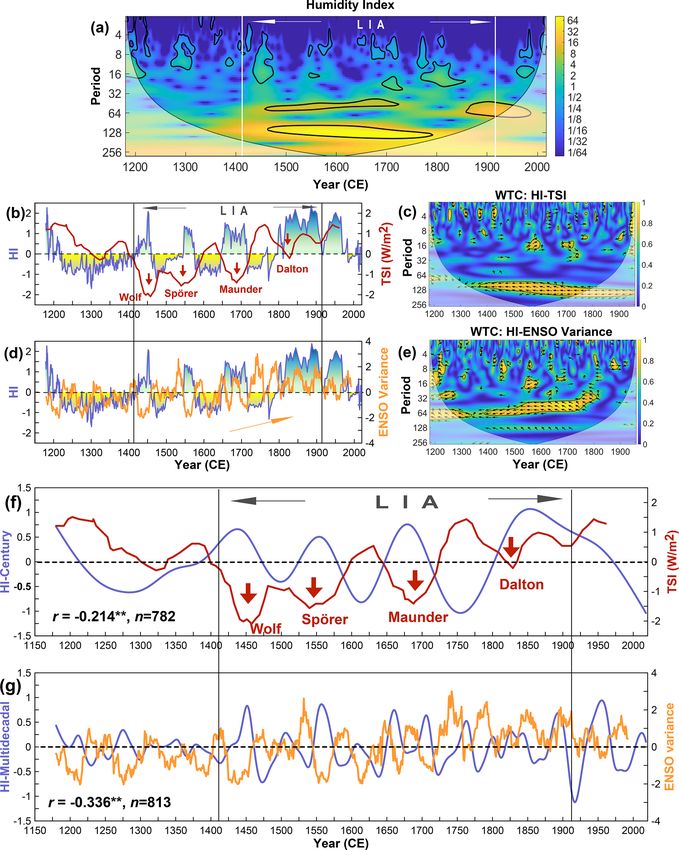
976                                                         S. Feng et al.: Humidity changes and possible forcing mechanisms

through the variation of the meridional radiation gradient be-      forcing mechanisms over the last millennium remain con-
tween high and middle latitudes, thus having the dominant           troversial. These controversies are largely attributed to low-
influence on moisture changes of ACA during the Holocene            resolution records or chronological uncertainties due to the
(F. Chen et al., 2019; Jin et al., 2011). In addition, the sub-     old carbon effect (Chen et al., 2010; Q. Zhang et al., 2021),
orbital-scale hydroclimate changes are also related to the          which limit our understanding of the hydroclimate evolution
shift of the Subtropical High, the strength and position of the     on decadal to centennial scales and of the relative role of ex-
Siberian High, North Atlantic Oscillation (NAO) mode, and           ternal and internal drivers over the past millennium. More
the changes of the Laurentide and Scandinavian Ice Sheets           well-dated, high-resolution records are needed to further in-
(Sorrel et al., 2021; F. Chen et al., 2019; Carlson and Clark,      vestigate the humidity evolution.
2012; Aichner et al., 2015; Wolff et al., 2016; Huang et al.,          Here, we present a continuous ∼ 1.8-year high-resolution
2014; Schwarz et al., 2017; Lauterbach et al., 2014).               humidity reconstruction with good chronological control
   In the past decades, a couple of proxy archives from ACA         from Lake Dalongchi in the central Tian Shan of ACA
have been recorded the hydroclimate changes during the key          over the past millennium (1180–2018 CE). Low- and high-
periods such as the Medieval Warm Period (MWP) and Little           frequency signals recovered from our reconstruction offer the
Ice Age (LIA) over the past millennium (Ling et al., 2018;          potential to detect climate fluctuations at decadal to centen-
He et al., 2013; Lan et al., 2019; Song et al., 2015; Ma et         nial scales, as well as long-term changes. Then, we explore
al., 2008; Zhang et al., 2009; Rousseau et al., 2020; Chen          the contribution of internal climate variability (which mainly
et al., 2006; J. Chen et al., 2019). In earlier studies, a hu-      refers to the NAO, AMO, and ENSO in this study) and solar
mid climate during the MWP and a dry climate condition              activity to humidity oscillations on different timescales over
during the LIA was documented by the tree ring of Sabina            the past millennium.
przewalskii (Kom.) (Zhang et al., 2003). This climate pattern
was further demonstrated by the records from Lake Lop Nur
and Daxigou profile on the northern slope of the central Tian       2   Study site
Shan (Zhang et al., 2009; Ma et al., 2008). However, a grow-
ing body of studies based on the lacustrine sediments, ice          Lake Dalongchi (42◦ 260 3100 –42◦ 260 5800 N, 83◦ 160 4800 –
cores, tree ring, and peat profiles show a generally similar cli-   83◦ 180 1500 E, 2400 m above sea level), located on the south
mate pattern of a relatively dry MWP and a wet LIA in ACA           slope of the central Tian Shan, is an ideal location for inves-
over the last millennium (Chen et al., 2015, 2010; F. Chen          tigating hydroclimate changes in ACA (Fig. 1a), as the lake
et al., 2019; J. Chen et al., 2019; Lei et al., 2014; Rousseau      sits in the core area of the “westerlies dominated climatic
et al., 2020; Lan et al., 2019; He et al., 2013; Song et al.,       regime (WDCR)” (F. Chen et al., 2019). The bedrock in the
2015). Furthermore, there is some debate regarding the driv-        catchment of Lake Dalongchi is composed of pillow lava,
ing mechanism of the natural hydroclimate evolution over            gabbro, and limestone blocks included in a matrix of sheared
the last millennium. Many studies emphasize that internal           calcareous turbidites. The ophiolitic mélanges are juxtaposed
climate variability (i.e., major sea and atmospheric modes)         against Paleozoic sedimentary rocks, gneissic granitoids, and
is supposed to be more marked than external factors (e.g.,          andalusite cordierite-bearing micaschist (Xiao et al., 2013;
solar forcing) in influencing hydroclimate changes (F. Chen         Ma et al., 2006; Gao et al., 1998). The main aquifer is hosted
et al., 2019; Chen et al., 2006; Lan et al., 2019). According       by ophiolitic rocks and categorized as a fissured rock aquifer
to this theory, the NAO and Atlantic Multidecadal Oscilla-          (http://gis.geoscience.cn/website/hg/viewer.htm, last access:
tion (AMO) play important roles by controlling the strength         8 January 2022). This aquifer has multi-scale hydraulic
and shift of the westerly jet stream in determining hydrocli-       discontinuities and low groundwater potentiality due to the
matic changes in ACA (Chen et al., 2015, 2010; Aichner et           structural heterogeneities of the ophiolitic rocks (Lods et al.,
al., 2015; Lan et al., 2018, 2019). The El Niño–Southern Os-        2020; Jeanpert et al., 2019; Boroninaa et al., 2003).
cillation (ENSO) also contributes the climate variability in           Lake Dalongchi is a small alpine freshwater lake formed
ACA on a multi-centennial timescale (Chen et al., 2015; F.          by glacial moraine damming and has a mean pH of 8.03 and
Chen et al., 2019). In contrast, several paleoclimate records       a salinity of 0.31 g L−1 . Both the north and south sides of the
prefer to highlight the possible solar forcing to the humidity      lake are surrounded by steep mountains (Fig. 1b). The lake
oscillation over the last millennium (Song et al., 2015; Zhao       is mainly fed by the river originating from mountains on the
et al., 2009; He et al., 2013; Ling et al., 2018). For exam-        east, precipitation within the catchment, and glacial meltwa-
ple, the solar imprint on the effective humidity fluctuations       ter from the surrounding mountains at high elevations. The
in ACA was proved by wavelet spectral analysis of the sedi-         lake water flows out into Lake Xiaolongchi through a tunnel
ment record from Lake Manas (Song et al., 2015). Also, the          under the moraine and the outflow discharge is low. Then the
∼ 200-year moisture oscillations are related to the solar forc-     lake water from Xiaolongchi flows westwards into the Kuche
ing recorded by the lake-level changes during the past 1000         River basin (Fig. 1b).
years from Lake Hurleg (Zhao et al., 2009). Therefore, the             Measured in July 2018, the lake covers a surface area of
climate changes on different time scales and their possible         ∼ 1.4 km2 and has a catchment area of ∼ 131 km2 . The max-

Clim. Past, 18, 975–988, 2022                                                           https://doi.org/10.5194/cp-18-975-2022
S. Feng et al.: Humidity changes and possible forcing mechanisms                                                                    977

Figure 1. Maps of the study site. (a) Locations of Lake Dalongchi and other humidity records in arid Central Asia, mentioned in the text.
Sites 1–6 denote the Bayanbuluk meteorological station, Lake Bosten (Chen et al., 2006), Badian Jaran Desert (Ma and Edmunds, 2006;
Gates et al., 2008), Lake Sugan (He et al., 2013), Lake Gahai (He et al., 2013), and Lake Ala Kol (Rousseau et al., 2020), respectively.
The dashed yellow line indicates the boundary of the modern Asian summer monsoon; the mid-latitude inland region on the western side
of the modern Asia summer monsoon boundary line is arid central Asia (ACA) (Chen et al., 2010; F. Chen et al., 2019). The map was
generated using ArcMap 10.2 software (ESRI, USA, http://www.esri.com, last access: 9 February 2020). (b) Watershed map of the study
site. (c) Bathymetric contour map of Lake Dalongchi with the coring site.

imum water depth of Lake Dalongchi reaches 7.4 m in the
western lake, and its depth largely decreases from west to
east (Fig. 1c). Alpine coniferous forests dominated by Picea
primarily thrive on the southern and western slopes of the
surrounding mountains, while the northern slope is covered
by herbs such as Chenopodiaceae, Artemisia, Poaceae, and
Cyperaceae. According to the records from 1958 to 2019
at Bayanbuluk Station which is located ∼ 100 km to the
northeast of Lake Dalongchi, the mean annual temperature is
−4.6 ◦ C with a July average of 10.9 ◦ C and a January average
of −26.4 ◦ C, and the mean annual precipitation and evapora-
tion are 270 and 3200 mm, respectively. The mean annual
precipitation is far less than the evaporation capacity. More-
over, most of the precipitation occurs as convective rainfall
from June–August (Lan et al., 2018). The prevailing wind
is from the northwest, and the annual average wind speed is            Figure 2. Sedimentary lithology and multi-proxy variation versus
                                                                       depth for the composite DLC1819 core.
only 2.73 m s−1 . The average number of sandstorm days is
less than 5 d yr−1 based on the meteorological records from
1959 to 1998 (B. Zhang et al., 2021; Zhou et al., 2002).
                                                                       3.2   Laboratory analysis
                                                                       The DLC1819 core was subsampled at 1 cm intervals. All
3     Materials and methods
                                                                       subsamples were stored in a freezer in our laboratory at a
3.1    Sampling                                                        constant temperature of 4 ◦ C and used for MS, grain size,
                                                                       total organic carbon (TOC), and total nitrogen (TN) analy-
In July 2018 and August 2019, we retrieved several parallel            ses. Samples for MS were dried at below 40 ◦ C in a constant
long sediment cores from Lake Dalongchi at a maximum wa-               temperature air-blast drying oven and ground and packed into
ter depth of 7.4 m using the UWITEC platform manufactured              standard plastic boxes with a capacity of 2·2·2 cm3 . A Bartin-
in Austria, and several short cores using a piston gravity corer       gon MS2 susceptibility meter was used to measure magnetic
(Fig. 1c). To determine overlaps and ensure the continuity of          susceptibility. Samples used for grain size measurement were
the cores, magnetic susceptibility (MS) nondestructive scan-           pretreated with 10–20 mL of 10 % H2 O2 to remove organic
ning of all long and short sediment cores was used to obtain           matter and then with 10 mL of 10 % HCl to remove carbon-
a 6.95 m long composite core (DLC1819) (Fig. 2).                       ates; next, samples were rinsed with deionized water and fi-

https://doi.org/10.5194/cp-18-975-2022                                                                Clim. Past, 18, 975–988, 2022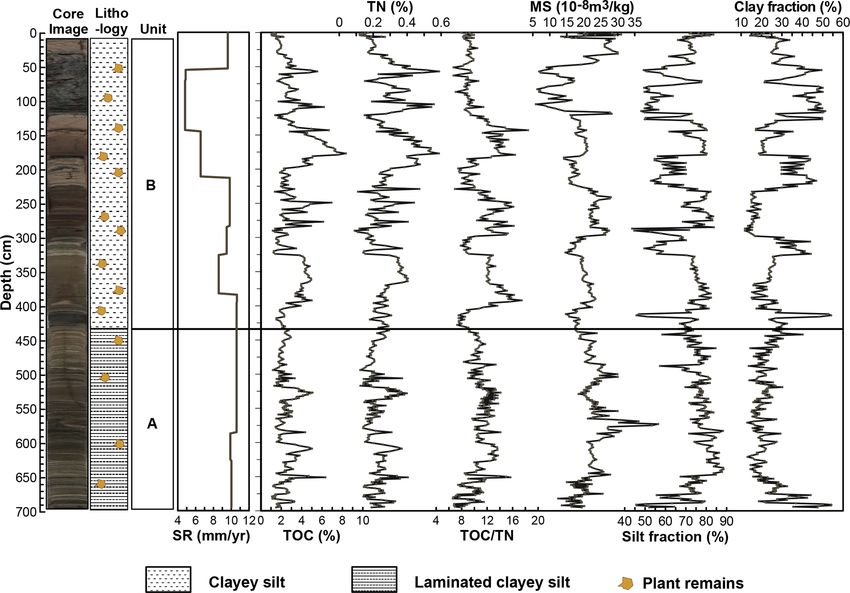
978                                                        S. Feng et al.: Humidity changes and possible forcing mechanisms

nally treated with 10 mL 0.05 M (NaPO3 )6 on an ultrasonic
vibrator for 10 min to promote dispersion. Grain size distri-
butions were determined using Malvern/MS 3000 laser grain
size analyzer. The samples used for TOC and TN determi-
nation were decalcified with 10 % HCl and rinsed repeatedly
with deionized water. Then, ∼ 3–5 mg dried and ground sam-
ples were analyzed using the EURO EA 3000 elemental an-
alyzer.
   Terrestrial plant remains at different depths in the
DLC1819 core were used for accelerator mass spectrometry
(AMS) 14 C measurements at Beta Analytic Inc., U.S.A. (Ta-
ble 1). The uppermost sediments were used for the radiomet-
ric dating by measuring the activity of 137 Cs as a function of    Figure 3. Age–depth model for the DLC1819 core of Lake Da-
depth. The samples of the uppermost sediments at 0.5 cm in-        longchi. (a) The 137 Cs activity versus depth in the uppermost sed-
tervals were dried and ground to less than 100 mesh and then       iments. (b) Bayesian age-model for the calibrated ages. The black
loaded into the 5 mL cylindrical PVC tube. Radio-activity of       dotted lines indicate the 95 % probability intervals of the model.
137 Cs was measured using a spectrum analysis system con-

sisting of a high-purity germanium well detector produced
by EG& G Ortec Company (USA), Ortec 919 spectrum con-              4.2    TOC, TN, C/N, MS, grain size
troller, and IBM microcomputer with a 16 K channel multi-          TOC and TN results show broadly similar changes and vary
channel analyzer.                                                  between 1.14 % and 8.33 % and between 0.09 % and 0.59 %,
                                                                   respectively (Fig. 2). C/N ratios fluctuate between 7.95 and
4     Results                                                      18.42 with an average of 10.88, and the values of C/N ra-
                                                                   tios exceed 10 at the depths of 440–650 cm, 330–400 cm,
4.1    Lithology and chronology                                    230–300 cm, and 130–180 cm (Fig. 2). MS values of the
                                                                   DLC1819 core vary between 5.90 and 41.89×10⁻⁸ m3 Kg−1
DLC1819 core is mainly composed of clayey silt and can
                                                                   with an average of 20.66 × 10⁻⁸ m3 Kg−1 (Fig. 2). The silt
be divided into two lithology units from bottom to top
                                                                   percentage fluctuates from 43.64 % to 88.50 % with an aver-
(Fig. 2). Unit A (695–430 cm) is mainly composed of dark
                                                                   age of 71.91 % while the variation of clay percentage has an
or light brown clayey silt with clear lamination. Unit B (430–
                                                                   opposite trend to that of silt, and its values vary from 11.84 %
0 cm) has a dramatic lithological variation characterized by
                                                                   to 54.26 % with an average of 25.97 % (Fig. 2). Sand content
brown or greyish-green clayey silt without obvious lamina-
                                                                   only accounts for 2.43 % of the total grain size on average.
tion. There are lots of the plant residues in the core, but they
                                                                   Generally, the higher values of the MS and silt content and
are more abundant in Unit B than in Unit A (Fig. 2).
                                                                   the lower clay content correspond to the higher C/N ratios
   A significant increase in 137 Cs activities occurred at ap-
                                                                   and vice versa (Fig. 2).
proximately 71 cm, which could be attributed to the onset of
rising concentrations of 137 Cs in the Northern Hemisphere
(NH) at 1952 CE (Fig. 3a). The distinct peak at the depth          5     Discussion
of 64 cm was taken as the 1963 CE global fallout maximum
(Pennington et al., 1973) (Fig. 3a). We established the age–       5.1    Proxy interpretation and humidity index
depth model of DLC1819 based on the 2 137 Cs ages and                     reconstruction
nine radiocarbon ages by the Bacon 2.5.7 procedure in R            The characteristics of 125–500 µm particles with well-
software using the Bayesian method (Blaauw and Christen,           developed surface structure can fully reflect the transport dis-
2011) (Fig. 3b). Chronology results show that the DLC1819          tance and dynamic conditions of sediment in a specific envi-
core covers the past 840 years with an approximate aver-           ronment; short distances and weak transport dynamics usu-
age sedimentation rate of 9.0 mm yr−1 . Unit A has unusu-          ally result in a poor grain roundness of sediments (Moral Car-
ally stable sediment accumulation rates with an average of         dona et al., 2005; Mahaney et al., 2004). The surface micro-
10.3 mm yr−1 , while the sediment accumulation rates vary          scopic properties of four randomly selected samples in the
greatly from 4.9 to 10.6 mm yr−1 in Unit B (Fig. 2).               DLC1819 core show that the grains in the range of 125–
                                                                   500 µm are characterized by poor roundness with an angu-
                                                                   lar outline which is quite different from the eolian materials
                                                                   (M. Zhang et al., 2021) (Fig. S1 in the Supplement), exclud-
                                                                   ing the possibility that the clastic particles are derived from
                                                                   eolian deposition in Lake Dalongchi.

Clim. Past, 18, 975–988, 2022                                                           https://doi.org/10.5194/cp-18-975-2022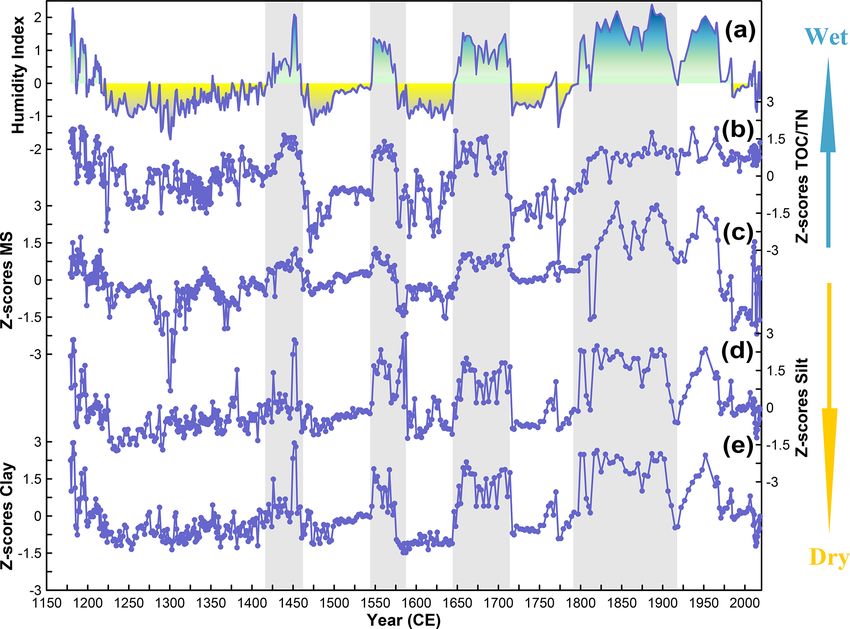
S. Feng et al.: Humidity changes and possible forcing mechanisms 979
Table 1. Accelerator mass spectrometry (AMS) 14 C dating results of DLC1819 core.
Composite Analyzed δ 13 C Calendar
No. Lab. no Sample ID depth (cm) material (‰) 14 C age/BP age/CE
1 Beta – 514897 DLC-1-1-61 69 Wood −24.9 90 ± 30 1870–1928
2 Beta – 507553 DLC-1-1-135 143 Wood −27.4 170 ± 30 1721–1818
3 Beta – 507554 DLC-1-2-82 210 Wood −31.4 230 ± 30 1635–1684
4 Beta – 507555 DLC-1-2-155 283 Wood −26.1 340 ± 30 1470–1640
5 Beta – 507556 DLC-1-3-61 324 Wood −28.1 430 ± 30 1420–1498
6 Beta – 507557 DLC-1-3-119 382 Wood −22.3 440 ± 30 1416–1490
7 Beta – 514898 DLC-1-3-131 394 Wood −23.7 370 ± 30 1446–1528
8 Beta – 514901 DLC-3-5’-37 585 Wood −23.6 670 ± 30 1274–1320
9 Beta – 542591 DLC2019-1-5-76 625 Wood −23.1 800 ± 30 1184–1275
Figure 4. Schematic diagram illustrating a simple explanation of
the lacustrine depositional process in the Lake Dalongchi region.
Lake level condition and the transport process of exogenous mate-
rials in the humid period (a) and the dry period (b).
Terrestrial plants usually have C/N ratios of more than
20 (Meyers, 1994, 2003), so the increased C/N ratios in
Lake Dalongchi sediments reflect the input amount of al- Figure 5. Humidity index reconstruction (a) based on the Z scores
lochthonous organic matter (Fig. 2). Synchronously, the in- of total organic carbon / total nitrogen (TOC/TN) ratios (b), the
Z scores of magnetic susceptibility (MS) (c), the Z scores of silt
crease in the MS values and silt content also indicates the in-
fraction (d), and the Z scores of clay fraction variation (e) in the
creased input of detrital materials and the intensified erosion DLC1819 core in Lake Dalongchi. Light grey bars highlight inter-
of the basin (Fig. 2). Given that the weak inflows of the runoff vals of increased humidity in Lake Dalongchi during the LIA.
into Lake Dalongchi, which is a shallow and a small lake with
an area only of 1.4 km2 , the distance from the lakeshore to
the sampling site is the key to determining the amount of ex- to a Z score (Fig. 5b, c, d, e). Then the HI was derived from
ogenous detrital materials in the core. Therefore, during the the average of the normalized standard Z scores. Positive and
humid (dry) period represented by high (low) lake level and negative Z scores indicate wet and dry climatic conditions
enlarged (reduced) lake area, exogenous materials containing (Fig. 5a).
magnetic minerals, coarse grain components, and terrestrial
plants were poorly (easily) transported to the sampling site
5.2 Humidity changes over the last millennium
due to the long (short) distance from the lakeshore and re-
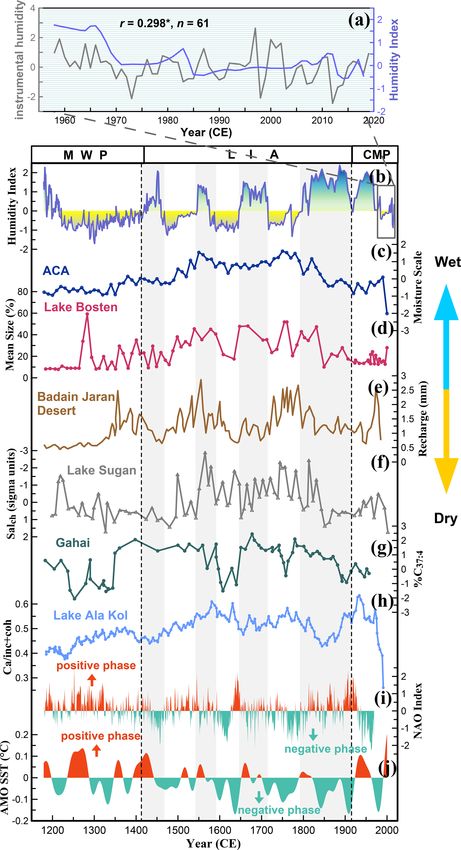
duction (intensified) erosion in the basin (Fig. 4). Thus, the There is a generally positive correlation (r = 0.298∗) be-
high MS values, silt content, and C/N ratios indicate a dry tween the reconstructed HI and the instrumental relative
climate and vice versa (Fig. 4). humidity records over the past 60 years from the nearby
Accordingly, multiple proxies, such as C/N ratios, MS, Bayanbuluk meteorological station at the 0.05 significance
silt, and clay fractions, were synthetically employed to re- level, verifying the reliability of the humidity reconstruction
construct the humidity index (HI) in the Lake Dalongchi re- (Fig. 6a). The HI changes show that the climate was dry dur-
gion over the past millennium (Fig. 5). As the high values ing the MWP (1180–1420 CE) and CWP (1920–2018 CE)
of C/N ratios, MS, and silt contents and low values of clay and wet during the LIA (1420–1920 CE) (Fig. 6b). More-
content reflect the arid climatic environment, the first three over, our preliminary palynological data also show a dry cli-
records multiplied by −1 and clay content were normalized mate characterized by herb pollen (∼ 71 %) dominated by
https://doi.org/10.5194/cp-18-975-2022 Clim. Past, 18, 975–988, 2022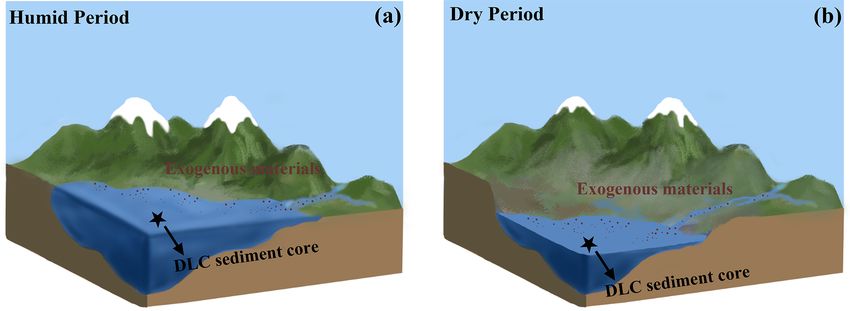
980                                                       S. Feng et al.: Humidity changes and possible forcing mechanisms

Artemisia, Chenopodiaceae, and Poaceae during the MWP
and a wet climate characterized by the rapid increased tree
pollen dominated by Picea (up to 45 %) during the LIA (un-
published data). This multi-centennial climate pattern is gen-
erally in agreement with the hydroclimatic patterns revealed
by recent numerous studies in ACA (Chen et al., 2006; Song
et al., 2015; Lan et al., 2018, 2019; Zhao et al., 2009; He
et al., 2013; Ma and Edmunds, 2006; Gates et al., 2008;
Rousseau et al., 2020) (Fig. 6c, d, e, f, g, h), although sev-
eral studies tend to suggest humid climate conditions during
the MWP in ACA (Zhang et al., 2009; Ma et al., 2008; Zhang
et al., 2003). A total 5 of the 17 records selected on the ba-
sis of reliable chronologies and robust proxies from ACA
show a relatively dry MWP, and a wet LIA characterized
not only by relatively humid but also by high precipitation
(Chen et al., 2010) (Fig. 6c). Recently, records from Lake Ala
Kol, Kyrgyzstan, reveal the cold and wet climate conditions
during the LIA indicated by the prominent glacier advances
(Rousseau et al., 2020) (Fig. 6h), which corresponds to the
maximal ice accumulation in the Guliya ice core (Rousseau
et al., 2020; Yang et al., 2009). Thus, the humidity changes
of Dalongchi lake do not indicate a local signal but a re-
gional signal, i.e., the typical “westerlies-dominated climatic
regime” (WDCR) (F. Chen et al., 2019).
   The previous study shows that the higher anomalous cli-
matic instability during the LIA compared to the MWP, sug-
gesting the moisture instability prefers to occur within the
conditions of an overall cold climate (J. Chen et al., 2019).
However, it is not clear how the specific unstable wet and
dry climate fluctuated during the LIA, due to the relatively
low-resolution records in ACA (Chen et al., 2006; Zhao et
al., 2009; Lan et al., 2019). The HI reconstruction of Lake
Dalongchi provides new evidence for the unstable hydrocli-
matic variability during the LIA (Fig. 6b). Four wet episodes
with the sharp high HI values were recorded for 1420–1470,
1550–1600, 1650–1720, and 1800–1920 CE, and three dra-
matic dry periods with the low HI values were recorded for
1470–1550, 1600–1650, and 1720–1800 CE during the LIA             Figure 6. Humidity index (HI) of Lake Dalongchi and compari-
(Fig. 6b). Our high-resolution reconstruction clearly docu-       son to other records in ACA over the last millennium. (a) Compar-
mented several obvious and dramatic secondary humidity            ison between the HI (blue line) and the standardized instrumental
fluctuations within the LIA, which are not clearly captured in    effective humidity recorded by Bayanbuluk meteorological station
other current records from ACA (Chen et al., 2006; Ma and         (grey line). An asterisk (∗ ) represents the 0.05 significance level.
Edmunds, 2006; Gates et al., 2008; He et al., 2013) (Fig. 6).     (b) The reconstructed HI for the past millennium (1180–2018 CE).
The climatic instability during the LIA can also be reflected     (c) The synthesized moisture curve over the last millennium in ACA
by the dramatic lithological variations and the unstable sed-     (Chen et al., 2010). (d) Variations in the mean grain size along the
                                                                  BST04H core in Lake Bosten (Chen et al., 2006). (e) The unsatu-
iment accumulation rates in Unit B (Fig. 2). Moreover, con-
                                                                  rated recharge history in Badian Jaran (Gates et al., 2008; Ma and
tinuous wavelet transform (CWT) of HI exhibits a signifi-         Edmunds, 2006). (f) Chironomid inferred salinity (Salch) in SG03I
cant century-scale dominant oscillation ranging from ∼ 88 to      of Sugan Lake (Chen et al., 2009). (g) %C37:4 from Lake Gahai
146 years, which is nearly throughout the entire time series      (He et al., 2013). (h) Ca/inc + coh from Lake Ala Kol (Rousseau et
and prominent in 1450–1800 CE, as well as a strong ∼ 50- to       al., 2020). (i) The reconstructed NAO (Ortega et al., 2015). (j) The
65-year multidecadal oscillation at a 95 % confidence level       reconstructed AMO (Wang et al., 2017). Light grey bars highlight
relative to the red noise spectrum (Fig. 7a).                     intervals of increased humidity in Lake Dalongchi during the LIA.

Clim. Past, 18, 975–988, 2022                                                           https://doi.org/10.5194/cp-18-975-2022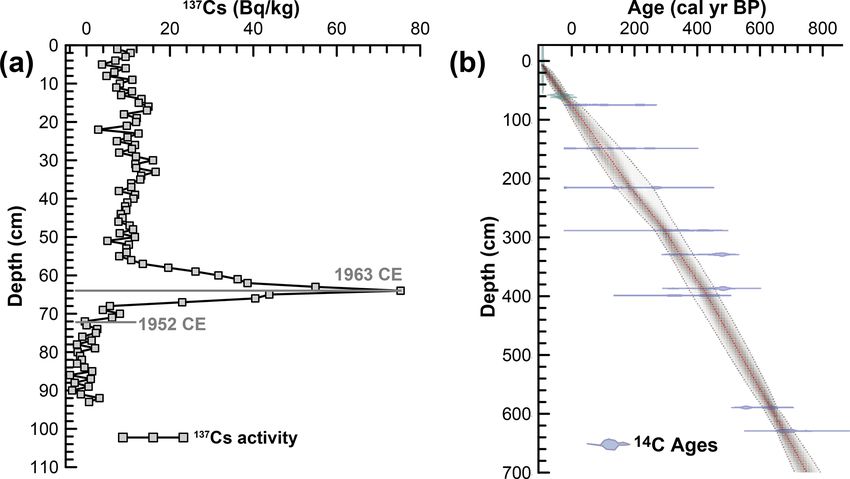
S. Feng et al.: Humidity changes and possible forcing mechanisms                                                                          981

Figure 7. The wavelet analysis of the HI and the relationship between the HI and the TSI or ENSO. (a) Continuous wavelet (CWT) power
spectrum of the HI. The irregular thick black contour represents the 95 % confidence level against red noise, and the thin curved black solid
line is the cone of influence (COI) (Grinsted et al., 2004). (b) A comparison between the HI and the reconstructed total solar irradiance
(TSI) (Bard et al., 2000). Wolf, Spörer, Maunder, and Dalton represent several grand solar minimums that occurred during the LIA. (c) The
wavelet coherence (WTC) result between the HI and the TSI (Bard et al., 2000). (d) As (b), but for ENSO variance reconstruction (Li et al.,
2011). Orange arrows represent the enhanced ENSO amplitude trend. (e) As (c), but for ENSO variance (Li et al., 2011). (f) A comparison
between the century component of HI and TSI (Bard et al., 2000). (g) A comparison between the multidecadal component of the HI and
ENSO variance reconstruction (Li et al., 2011). The 95 % confidence level against red noise is shown as an irregular thick black contour. The
black arrows illustrate the relative phase relationship: arrows pointing right are in phase and those pointing left are anti-phase (Grinsted et
al., 2004). Two asterisks (**) represent the 0.01 significance level.

https://doi.org/10.5194/cp-18-975-2022                                                                    Clim. Past, 18, 975–988, 2022
982                                                         S. Feng et al.: Humidity changes and possible forcing mechanisms

5.3     Possible forcing mechanisms                                 the climate system (Sha et al., 2016; Bond et al., 2001; Bard
                                                                    and Frank, 2006; Knudsen et al., 2014). As the largest dry
5.3.1    The influence of NAO and AMO
                                                                    inland regions on the globe, the climate records from ACA
Several studies have linked hydroclimate changes in arid            are valuable for investigating the fingerprint of solar forcing.
Central Asia to the NAO and the AMO over the last mil-              We compared HI with the reconstructed total solar irradiance
lennium (Aichner et al., 2015; Yan et al., 2019; Chen et al.,       (TSI) (Bard et al., 2000) and found a strong link and inverse
2006; Lan et al., 2018; F. Chen et al., 2019; J. Chen et al.,       relationship between the HI and TSI, especially during the
2019). On multidecadal timescales, most records show that           LIA (Fig. 7b). The HI increased significantly and reached its
the NAO and AMO are dominated by alternating sea surface            peak during the several grand solar minimums (Wolf, Spörer,
temperatures (SSTs) and sea-level pressure (SLP) anomalies,         Maunder, Dalton), whereas the humidity decreased rapidly in
respectively (Ortega et al., 2015; Knudsen et al., 2014). The       the maximum solar activity period (Fig. 7b). The WTC spec-
climatic instability during the LIA may be link to the NAO          trum between HI and TSI shows a strong correlation and anti-
and AMO via the westerlies (J. Chen et al., 2019). How-             phase pattern (Fig. 7c). Periodicities of significant coherence
ever, the relationship between HI, NAO, and AMO is am-              for HI and TSI occurred at ∼ 88 to 146 years, particularly
biguous on multidecadal timescales (Fig. 6b, i, g). Although        from 1400 CE to the present. Arrows in the significant coher-
the wavelet coherence (WTC) results show that the NAO and           ence spectral area point almost entirely to the left, implying
HI have approximately ∼ 25-, 50-, and 128 year periodici-           the persistent negative correlation of HI and TSI (Fig. 7c).
ties, and the AMO and HI have the periodicities of ∼ 32, 70,        Therefore, the WTC result confirms that the persistent ∼ 88–
and 128 years, these periodicities are nonpersistent (Fig. S2).     146-year cycle of HI in CWT is associated with solar activity
Therefore, our results suggest that the periodic variations         (Fig. 7a, c). The cycle of 88–146 years should be attributed to
in NAO and AMO themselves have little influence on the              the century-scale solar cycle of Gleissberg (Gleissberg, 1958,
humidity fluctuation in Lake Dalongchi at the multidecadal          1965; Ogurtsov et al., 2015) (Fig. 7a). Accordingly, we ex-
timescale.                                                          tracted this century signal from the original HI series based
   However, on multi-centennial timescales, the dominant            on the ensemble empirical mode decomposition (EEMD), a
dry climate conditions during the MWP and humid climate             new noise-assisted data analysis (NADA) method (Wu and
conditions during the LIA seems related to the relatively pos-      Huang, 2009; Huang et al., 1998). The relationship between
itive and negative phases exhibited in the NAO and AMO,             the century component and TSI has an apparent correlation
respectively (Fig. 6b, i, g). Previous studies indicate the neg-    (r = −0.217∗∗) and a clear coherence spectral area (Figs. 7f
ative phase of the NAO and AMO during the LIA favors in-            and S3a). The HI shows an extreme instability accompanied
creasing precipitation in ACA (J. Chen et al., 2019; Chen et        by obvious secondary oscillations of cold–wet and warm–dry
al., 2015, 2006, 2016; Lan et al., 2018; Aichner et al., 2015).     at century timescales during the LIA under the regulation of
During the MWP, the positive phase of the NAO with en-              solar activity (Fig. 7f). This verifies the critical role of the
hanced pressure between the Azores High and the Icelandic           Gleissberg solar cycle in controlling the effective humidity at
Low would lead to strengthened zonal flow, and the axis of          the century scale during the last millennium in ACA. Shin-
maximum moisture transport and preferred storm track ex-            dell et al. examined the climate response to the solar forcing
tend to the north and east (Trouet et al., 2009). In contrast,      at the Maunder minimum and indicated that even relatively
the axis of maximum moisture transport and preferred storm          little solar activity might play a primary role in century-scale
track migrated southwards when the NAO was in a negative            climate change in NH (Shindell et al., 2001). The possible
phase during the LIA (Hurrell, 1995). A general cold (warm)         solar contribution of the Gleissberg century cycle to climate
phase of the AMO corresponds to the negative (positive)             changes over at least the last millennium has been reported
NAO phase during the LIA (MWP) (Wang et al., 2017; Or-              from the North Atlantic region (Moffa-Sánchez et al., 2014;
tega et al., 2015), leading to a weaker (strong) upper-level jet    Ogurtsov et al., 2002a, b, 2015). In arid Central Asia, several
stream intensity and further resulting in development (reces-       records documented the solar fingerprint by the evidence of
sion) of the through-ridge system, consequently contributing        ∼ 200-year periodicity between the proxy data and solar ac-
to the increased (decreased) precipitation in ACA (J. Chen          tivity time series (Zhao et al., 2009; Yin et al., 2016), and
et al., 2019). Thus, the multi-centennial behavior in our re-       sediment records from Lake Toson and Lake Manas exhib-
construction might be related to the influence of the NAO           ited periodicities of 93 years and 70 to 100 years respec-
and AMO on hydroclimate changes between the MWP and                 tively through the spectral and wavelet analysis, which may
the LIA.                                                            be linked with the Gleissberg solar cycle (Ling et al., 2018;
                                                                    Song et al., 2015). However, still, rare records in ACA docu-
                                                                    mented the good relationship between the effective humidity
5.3.2    The role of the Gleissberg cycle
                                                                    changes and the fluctuations of the Gleissberg cycle. Our re-
Solar forcing has been treated as a critical factor for influenc-   construction provides strong evidence for negative link be-
ing key components (e.g., temperature, precipitation, evap-         tween the Gleissberg solar cycle and humidity changes at
oration, winds, ocean circulation, and iceberg transport) of        century timescales during the last millennium in ACA.

Clim. Past, 18, 975–988, 2022                                                           https://doi.org/10.5194/cp-18-975-2022
S. Feng et al.: Humidity changes and possible forcing mechanisms 983
The confusion we focus on now is how solar activity sig- 5.3.3 Linkage to ENSO
nificantly affected hydroclimate fluctuations in ACA over
the last millennium. Several studies proposed that the solar ENSO is a mode of variability representing changes in
forcing may influence the variability of the sea–atmospheric sea-surface temperatures and atmospheric circulation across
modes, the NAO in particular (Swingedouw et al., 2011; the equatorial Pacific Ocean (Jiménez-Moreno et al., 2021;
Kirov and Georgieva, 2002; Kodera, 2002; Gimeno et al., Cane, 2005). Paleoclimatic proxies and historical records
2003). Kodera (2002) suggests that the NAO extends to the suggest ENSO has long-term variability in amplitude and
stratosphere during the high solar activity and to the tro- frequency on multidecadal to centennial timescales (Yeh and
posphere during the low solar activity. Such a relationship Kirtman, 2007; D’Arrigo et al., 2005; Li et al., 2011; Mann et
between the solar activity and troposphere or stratosphere al., 2000). The amplitude of ENSO variability is the impor-
subsequently determines the positive or negative phase of tant factor to affect the occurrence of climate extremes over
NAO (Shindell et al., 2001; Kodera and Kuroda, 2002; Gray, the globe (Mcphaden et al., 2006; Cheng et al., 2008). On the
2003). Solar irradiance also has been served as a trigger multi-centennial timescale (i.e., MWP to LIA), the HI and
for the shifts of the precipitation-bearing westerlies during ENSO variance (Li et al., 2011) show a similar trend in am-
winter (Brahim et al., 2018; Kodera, 2002; Yukimoto et al., plitude changes (Fig. 7d). The amplitudes of HI and ENSO
2017). Ultimately, the solar variability indirectly affects the variance both show a distinctly increasing trend during the
hydroclimate changes through modulating the NAO state, LIA and maintain a relatively high level from ∼ 1650 to
suggesting solar regulation for hydroclimate might be ampli- 1950 CE (Fig. 7d). This trend suggests that the relatively hu-
fied on a regional scale through atmospheric circulation (In- mid environment and unstable hydroclimate in ACA may be
eson et al., 2011; Shindell et al., 2001; Gray, 2003; Brahim associated with the increase in ENSO variance amplitude (Li
et al., 2018; Kodera, 2002; Yukimoto et al., 2017). et al., 2011) and more frequent ENSO events (Rustic et al.,
However, for ACA far from the ocean with scarce precip- 2015) during the LIA, which are possible owing to a major
itation and intense evaporation, the mechanism of solar forc- reorganization within the tropical ocean–atmosphere system
ing on humidity may be direct. Our reconstruction reveals the or significant ENSO teleconnection changes from the MWP
robust negative relationship between the TSI and HI, but the to LIA (Rustic et al., 2015; Li et al., 2011). The results here
ambiguous relationship between the NAO and HI (Figs. 6, support previous studies showing that ENSO might affect hy-
7). The paleoclimate records from ACA also highlight that droclimate variability in ACA at multi-centennial timescales
the intense evaporation and direct heating caused by the en- with La Niña-like (EI Niño-like) conditions during the MWP
hanced solar irradiance control the effective humidity (Liu (LIA) (F. Chen et al., 2019; Chen et al., 2015). During the
et al., 2019; Song et al., 2015; He et al., 2013; Wu et al., LIA with relatively warm EI Niño-like conditions, the West-
2020; Ling et al., 2018; Zhao et al., 2009). To further investi- ern Pacific Subtropical High enhanced and extended west-
gate the potential feedback processes between the solar vari- wards, and a low-pressure trough related to the weakening
ability and effective humidity at century timescales in ACA, of the Siberian High over the central–southwest Asia region
we performed a transient experiment forced only by the TSI formed, together resulting wetter climatic conditions in arid
for the last millennium using the Max Planck Institute Earth Central Asia (Chen et al., 2015; F. Chen et al., 2019a; Feng
System Model (MPI-ESM) (Jungclaus et al., 2014) (Fig. S4). et al., 2016; Syed et al., 2006).
Most of the precipitation occurs in June–August in the study On the multidecadal timescales, however, the WTC be-
area, and the evaporation process is intensified in summer tween the HI and ENSO variance shows a robust negative
(Lan et al., 2018), so we mainly considered the results of phase relationship (Fig. 7e). In particular, the WTC result
June–July–August (JJA). There is a positive relationship be- shows that the HI has a similar quasi-regular cycle of ENSO
tween the TSI, temperature, and evaporation (Fig. S4), in- variance from 82–90 years during the MWP to 50–60 years
dicating that high solar output favors high temperature and thereafter (Li et al., 2011), which reveals the potential mod-
intensified evaporation at century timescales in arid Central ulation of these quasi-regular cycles of ENSO variance to
Asia. Moreover, the effective humidity shows a negative as- extreme humidity oscillations at the multidecadal timescales
sociation with evaporation, temperature, and TSI variability in ACA (Fig. 7e). Furthermore, the multidecadal component
(Fig. S4). However, the relationship between precipitation of the HI extracted by the EEMD (Wu and Huang, 2009;
and effective humidity appears to be obscure at the century Huang et al., 1998) also exhibits an obvious inverse relation-
timescale (Fig. S4). Therefore, the solar forcing has a direct ship with ENSO variance (Fig. 7g). The influence of ENSO
contribution to regulating the humidity in ACA by the Gleiss- on the extratropical climate has been shown to be modu-
berg century cycle forcing on the temperature and evapora- lated by ENSO variance at multidecadal timescales, and the
tion over the last millennium, although water vapor trans- calculated 31-year running correlations between the recon-
ported by westerlies and precipitation might be affected by structed ENSO variance and other records of ENSO telecon-
ocean–atmosphere modes. nections shows that the ENSO teleconnection is robust over
Central Asia during the past seven centuries only except for
the Maunder minimum (Li et al., 2013). The quasi-regular
https://doi.org/10.5194/cp-18-975-2022 Clim. Past, 18, 975–988, 2022984 S. Feng et al.: Humidity changes and possible forcing mechanisms
periodic variation of ENSO variance effects on the hydrocli- paper. FS and YL performed the data analysis. XM and JW partici-
mate changes of ACA at multidecadal timescales might be pated in the retrieval of the sediment core and sampling. All authors
through modulating the extreme precipitation. The water va- discussed the results and commented on the paper.
por from the Arabian Sea may be transported to the Xinjiang
region and cause heavy precipitation, although the water va-
por fluxes mostly come from the west transported by the pre- Competing interests. The contact author has declared that nei-
vailing westerlies (Huang et al., 2015a, 2013). Daily obser- ther they nor their co-authors have any competing interests.
vational precipitation and National Center for Environmental
Prediction (NCEP) reanalysis data also suggest that the low-
Disclaimer. Publisher’s note: Copernicus Publications remains
level water vapor fluxes from the Indian Ocean, transported
neutral with regard to jurisdictional claims in published maps and
along the eastern periphery of the Tibetan Plateau, are the institutional affiliations.
most important factor leading to rainstorms in ACA (Huang
et al., 2017). However, our knowledge of the cause of ENSO
variance influence on hydroclimate oscillations in ACA at Acknowledgements. We are grateful to the three anonymous re-
multidecadal timescales is still in its infancy and remains un- viewers and editor Mary Gagen for their insightful comments and
certain, owing to the complicated interactions of the tropi- constructive suggestions, which helped to improve the manuscript.
cal and subtropical ocean basins at decadal to multidecadal We thank Junfeng Li, Weihan Jia, Huashu Li, Huihui Qi, and Qi
timescales (Cai et al., 2019). The mechanisms for the dif- Zhang for their help with the field work.
ferent timescales between the ENSO amplitude and hydro-
climate changes in ACA require further exploration through
high-resolution records and simulation experiments. Financial support. This research has been supported by the Na-
tional Key Research and Development Program of China (grant
no. 2018YFA0606400), the National Natural Science Foundation
6 Conclusions of China (grant no. 41907375), and the Basic Research Program of
the Institute of Hydrogeology and Environmental Geology CAGS
We present the humidity index (HI) in ACA over the past mil- (grant no. SK202007).
lennium based on the ∼ 1.8-year high-resolution multiproxy
records from Lake Dalongchi in the central Tian Shan. Our
Review statement. This paper was edited by Mary Gagen and re-
results reveal dramatic and unstable multidecadal to century-
viewed by three anonymous referees.
scale humidity oscillations over the last millennium, espe-
cially within the LIA, which is distinct from other records of
ACA. Our findings emphasize that the Gleissberg solar cy- References
cle and quasi-regular period of ENSO amplitude play critical
roles in controlling the effective humidity in ACA at century Aichner, B., Feakins, S. J., Lee, J. E., Herzschuh, U., and Liu, X.:
and multidecadal timescales, respectively. However, high- High-resolution leaf wax carbon and hydrogen isotopic record of
resolution records on different timescales and climate model the late Holocene paleoclimate in arid Central Asia, Clim. Past,
simulations are still needed to improve our understanding of 11, 619–633, https://doi.org/10.5194/cp-11-619-2015, 2015.
the physical mechanisms of the links between solar irradi- Aizen, E. M., Aizen, V. B., Melack, J. M., Nakamura, T.,
ance and ocean–atmosphere modes and how their coupling and Ohta, T.: Precipitation and atmospheric circulation pat-
terns at mid-latitudes of Asia, Int. J. Climatol., 21, 535–556,
affects moisture variation in ACA.
https://doi.org/10.1002/joc.626, 2001.
Bard, E. and Frank, M.: Climate change and solar variability:
What’s new under the sun?, Earth Planet. Sci. Lett., 248, 1–14,
Data availability. The reconstructed humidity index in this study https://doi.org/10.1016/j.epsl.2006.06.016, 2006.
has been submitted to the datasets of the 4TU Center for Bard, E., Raisbeck, G., Yiou, F., and Jouzel, J.: Solar irradiance dur-
Research Data, which can will be permanently available at ing the last 1200 years based on cosmogenic nuclides, Tellus B,
https://doi.org/10.4121/16570398 (Feng et al., 2022). 52, 985–992, https://doi.org/10.1034/j.1600-0889.2000.d01-7.x,
2000.
Blaauw, M. and Christen, J. A.: Flexible paleoclimate age-depth
Supplement. The supplement related to the article contains models using an autoregressive gamma process, Bayesian Anal.,
the supplementary methods and four supplementary diagrams. 6, 457–474, https://doi.org/10.1214/ba/1339616472, 2011.
The supplement related to this article is available online Bond, G., Kromer, B., Beer, J., Muscheler, R., Evans, M. N., Show-
at: https://doi.org/10.5194/cp-18-975-2022-supplement. ers, W., Hoffmann, S., Lotti-Bond, R., Hajdas, I., and Bonani, G.:
Persistent Solar Infuence on North Atlantic Climate During the
Holocene, Science, 294, 2130–2136, 2001.
Author contributions. SF and XL conceived this study, carried Boroninaa, A., Renarda, P., Balderera, W., and Christodoulides,
out the laboratory analysis and data interpretation, and wrote the A.: Groundwater resources in the Kouris catchment (Cyprus):
Clim. Past, 18, 975–988, 2022 https://doi.org/10.5194/cp-18-975-2022S. Feng et al.: Humidity changes and possible forcing mechanisms 985 data analysis and numerical modelling, J. Hydrol., 271, 130–149, Cheng, Y., Zhou, X., Deng, Z., Tang, Y., and Chen, D.: Interdecadal https://doi.org/10.1016/S0022-1694(02)00322-0, 2003. Variation of ENSO Predictability in Multiple Models, J. Climate, Brahim, Y. A., Wassenburg, J. A., Cruz, F. W., Sifedine, A., Scholz, 21, 4811–4833, https://doi.org/10.1175/2008jcli2193.1, 2008. D., Boumchou, L., Dassie, E. P., Jochum, K. P., Edwards, R. L., D’Arrigo, R., Cook, E. R., Wilson, R. J., Allan, R., and and Cheng, H.: Multi-decadal to centennial hydroclimate vari- Mann, M. E.: On the variability of ENSO over the ability and linkage to solar forcing in the Western Mediteraanean past six centuries, Geophys. Res. Lett., 32, L03711, during the last 1000 years, Sci. Rep., 8, 1–8, 2018. https://doi.org/10.1029/2004GL022055., 2005. Cai, W., Wu, L., Lengaigne, M., Li, T., McGregor, S., Kug, J. Feng, Z., Sun, A., Abdusalih, N., Ran, M., Kurban, A., Lan, S., Yu, J. Y., Stuecker, M. F., Santoso, A., Li, X., Ham, Y. G., B., Zhang, D., and Yang, Y.: Vegetation changes and as- Chikamoto, Y., Ng, B., McPhaden, M. J., Du, Y., Dommenget, sociated climatic changes in the southern Altai Mountains D., Jia, F., Kajtar, J. B., Keenlyside, N., Lin, X., Luo, J. J., within China during the Holocene, The Holocene, 27, 683–693, Martin-Rey, M., Ruprich-Robert, Y., Wang, G., Xie, S. P., Yang, https://doi.org/10.1177/0959683616670469, 2016. Y., Kang, S. M., Choi, J. Y., Gan, B., Kim, G. I., Kim, C. E., Kim, Feng, S., Liu, X., Shi, F., Mao, X., Li, Y., and Wang, J.: Supplemen- S., Kim, J. H., and Chang, P.: Pantropical climate interactions, tary data for Humidity changes and possible forcing mechanisms Science, 363, 1–11, https://doi.org/10.1126/science.aav4236, over the last millennium in arid Central Asia, 4TU Research Data 2019. [data set], https://doi.org/10.4121/16570398, 2022. Cane, M. A.: The evolution of El Niño, past and Gao, J., Li, M., Xiao, X., Tang, Y., and He, G.: Paleozoic tec- future, Earth Planet. Sci. Lett., 230, 227–240, tonic evolution of the Tianshan Orogen, northwestern China, https://doi.org/10.1016/j.epsl.2004.12.003, 2005. Tectonophysics, 287, 213–231, https://doi.org/10.1016/S0040- Carlson, A. E. and Clark, P. U.: Ice sheet sources of sea level rise 1951(98)80070-X, 1998. and freshwater discharge during the last deglaciation, Rev. Geo- Gates, J. B., Edmunds, W. M., Ma, J., and Sheppard, P. phys., 50, 1–72, https://doi.org/10.1029/2011rg000371, 2012. R.: A 700-year history of groundwater recharge in the Chen, F., Huang, X., Zhang, J., Holmes, J. A., and Chen, J.: Hu- drylands of NW China, The Holocene, 18, 1045–1054, mid Little Ice Age in arid central Asia documented by Bosten https://doi.org/10.1177/0959683608095575, 2008. Lake, Xinjiang, China, Sci. China Ser. D, 49, 1280–1290, Gimeno, L., Torre, L. d. L., Nieto, R., Garcia, R., Hernan- https://doi.org/10.1007/s11430-006-2027-4, 2006. dez, E., and Ribera, P.: Changes in the relationship NAO Chen, F., Chen, J., Holmes, J., Boomer, I., Austin, P., Gates, J. B., Northern hemisphere temperature due to solar activity, Earth Wang, N., Brooks, S. J., and Zhang, J.: Moisture changes over the Planet. Sci. Lett., 203, 15–20, https://doi.org/10.1016/S0012- last millennium in arid central Asia: a review, synthesis and com- 821X(02)01090-7, 2003. parison with monsoon region, Quaternary Sci. Rev., 29, 1055– Gleissberg, W.: The eighty-year sunspot cycle, J. Br. Astron. Assoc., 1068, https://doi.org/10.1016/j.quascirev.2010.01.005, 2010. 68, 148–152, 1958. Chen, F., Jia, J., Chen, J., Li, G., Zhang, X., Xie, H., Xia, Gleissberg, W.: The eighty-year sunspot cycle in auroral frequency D., Huang, W., and An, C.: A persistent Holocene wetting numbers, J. Br. Astron. Assoc., 75, 227–231, 1965. trend in arid central Asia, with wettest conditions in the late Gray, L. J.: The influence of the equatorial upper stratosphere Holocene, revealed by multi-proxy analyses of loess-paleosol se- on stratospheric sudden warmings, Geophys. Res. Lett., 30, 4, quences in Xinjiang, China, Quaternary Sci. Rev., 146, 134–146, https://doi.org/10.1029/2002gl016430, 2003. https://doi.org/10.1016/j.quascirev.2016.06.002, 2016. Grinsted, A., Moore, J. C., and Jevrejeva, S.: Application of the Chen, F., Chen, J., Huang, W., Chen, S., Huang, X., Jin, L., Jia, cross wavelet transform and wavelet coherence to geophys- J., Zhang, X., An, C., Zhang, J., Zhao, Y., Yu, Z., Zhang, R., ical time series, Nonlin. Processes Geophys., 11, 561–566, Liu, J., Zhou, A., and Feng, S.: Westerlies Asia and monsoonal https://doi.org/10.5194/npg-11-561-2004, 2004. Asia: Spatiotemporal differences in climate change and possible He, Y., Zhao, C., Wang, Z., Wang, H., Song, M., Liu, W., and Liu, mechanisms on decadal to sub-orbital timescales, Earth Sci. Rev., Z.: Late Holocene coupled moisture and temperature changes on 192, 337–354, https://doi.org/10.1016/j.earscirev.2019.03.005, the northern Tibetan Plateau, Quaternary Sci. Rev., 80, 47–57, 2019a. https://doi.org/10.1016/j.quascirev.2013.08.017, 2013. Chen, J., Chen, F., Feng, S., Huang, W., Liu, J., and Zhou, A.: Huang, N. E., Shen, Z., Long, S. R., Wu, M. C., Shih, H. H., Zheng, Hydroclimatic changes in China and surroundings during the Q., Yen, N.-C., Tong, C. C., and Liu, H. H.: The empirical mode Medieval Climate Anomaly and Little Ice Age: spatial patterns decomposition and the Hilbert spectrum for nonlinear and non- and possible mechanisms, Quaternary Sci. Rev., 107, 98–111, stationary time series analysis, Proc. Roy. Soc. London, 454, https://doi.org/10.1016/j.quascirev.2014.10.012, 2015. 903–995, https://doi.org/10.1098/rspa.1998.0193, 1998. Chen, J., Chen, F., Zhang, E., Brooks, S. J., Zhou, A., and Zhang, Huang, W., Chen, F., Feng, S., Chen, J., and Zhang, X.: Interannual J.: A 1000-year chironomid-based salinity reconstruction from precipitation variations in the mid-latitude Asia and their associa- varved sediments of Sugan Lake, Qaidam Basin, arid Northwest tion with large-scale atmospheric circulation, Chi. Sci. Bull., 58, China, and its palaeoclimatic significance, Chi. Sci. Bull., 54, 3962–3968, https://doi.org/10.1007/s11434-013-5970-4, 2013. 3749–3759, https://doi.org/10.1007/s11434-009-0201-8, 2009. Huang, W., Feng, S., Chen, J., and Chen, F.: Physical Mech- Chen, J., Liu, J., Zhang, X., Chen, S., Huang, W., Chen, J., Zhang, anisms of Summer Precipitation Variations in the Tarim S., Zhou, A., and Chen, F.: Unstable Little Ice Age climate Basin in Northwestern China, J. Climate, 28, 3579–3591, revealed by high-resolution proxy records from northwestern https://doi.org/10.1175/jcli-d-14-00395.1, 2015a. China, Clim. Dynam., 53, 1–10, https://doi.org/10.1007/s00382- Huang, W., Chen, J., Zhang, X., Feng, S., and Chen, F.: Definition 019-04685-5, 2019b. of the core zone of the “westerlies-dominated climatic regime”, https://doi.org/10.5194/cp-18-975-2022 Clim. Past, 18, 975–988, 2022
986                                                             S. Feng et al.: Humidity changes and possible forcing mechanisms

   and its controlling factors during the instrumental period, Sci.         Holocene hydroclimatic variations and possible forcing mech-
   Chi. Earth Sci., 58, 676–684, https://doi.org/10.1007/s11430-            anisms over the eastern Central Asia, Sci. China, 62, 1288-1301,
   015-5057-y, 2015b.                                                       https://doi.org/10.1007/s11430-018-9240-x, 2019.
Huang, W., Chang, S.-Q., Xie, C.-L., and Zhang, Z.-P.:                   Lauterbach, S., Witt, R., Plessen, B., Dulski, P., Prasad, S., Min-
   Moisture sources of extreme summer precipitation events                  gram, J., Gleixner, G., Hettler-Riedel, S., Stebich, M., Schnet-
   in North Xinjiang and their relationship with atmo-                      ger, B., Schwalb, A., and Schwarz, A.: Climatic imprint of
   spheric circulation, Adv. Clim. Change Res., 8, 12–17,                   the mid-latitude Westerlies in the Central Tian Shan of Kyr-
   https://doi.org/10.1016/j.accre.2017.02.001, 2017.                       gyzstan and teleconnections to North Atlantic climate variabil-
Huang, X., Oberhänsli, H., von Suchodoletz, H., Prasad, S., Sor-            ity during the last 6000 years, The Holocene, 24, 970–984,
   rel, P., Plessen, B., Mathis, M., and Usubaliev, R.: Hydro-              https://doi.org/10.1177/0959683614534741, 2014.
   logical changes in western Central Asia (Kyrgyzstan) dur-             Lei, Y., Tian, L., Bird, B. W., Hou, J., Ding, L., Oimah-
   ing the Holocene as inferred from a palaeolimnological                   madov, L., and Gadoev, M.: A 2540-year record of mois-
   study in lake Son Kul, Quaternary Sci. Rev., 103, 134–152,               ture variations derived from lacustrine sediment (Sasikul
   https://doi.org/10.1016/j.quascirev.2014.09.012, 2014.                   Lake) on the Pamir Plateau, The Holocene, 2014, 1–10,
Hurrell, J. W.: Decadal trends in the north atlantic oscillation: re-       https://doi.org/10.1177/0959683614530443, 2014.
   gional temperatures and precipitation, Science, 269, 676–679,         Li, J., Xie, S.-P., Cook, E. R., Huang, G., D’Arrigo, R., Liu, F., Ma,
   https://doi.org/10.1126/science.269.5224.676, 1995.                      J., and Zheng, X.-T.: Interdecadal modulation of El Niño ampli-
Ineson, S., Scaife, A. A., Knight, J. R., Manners, J. C., Dunstone,         tude during the past millennium, Nat. Clim. Change, 1, 114–118,
   N. J., Gray, L. J., and Haigh, J. D.: Solar forcing of winter cli-       https://doi.org/10.1038/NCLIMATE1086, 2011.
   mate variability in the Northern Hemisphere, Nat. Geosci., 4,         Li, J., Xie, S.-P., Cook, E. R., Morales, M. S., Christie, D.
   753–757, https://doi.org/10.1038/NGEO1282, 2011.                         A., Johnson, N. C., Chen, F., D’Arrigo, R., Fowler, A.
Jeanpert, J., Iseppi, M., Adler, P. M., Genthon, P., Sevin, B.,             M., Gou, X., and Fang, K.: El Niño modulations over
   Thovert, J. F., Dewandel, B., and Join, J. L.: Fracture controlled       the past seven centuries, Nat. Clim. Change, 3, 822–826,
   permeability of ultramafic basement aquifers. Inferences from            https://doi.org/10.1038/nclimate1936, 2013.
   the Koniambo massif, New Caledonia, Eng. Geol., 256, 67–83,           Li, Z., Chen, Y., Wang, Y., and Li, W.: Drought promoted the dis-
   https://doi.org/10.1016/j.enggeo.2019.05.006, 2019.                      appearance of civilizations along the ancient Silk Road, Environ.
Jiménez-Moreno, G., Anderson, R. S., and Shinker, J. J.:                    Earth Sci., 75, 1116, https://doi.org/10.1007/s12665-016-5925-
   ENSO, sun and megadroughts in SW USA during the                          6, 2016.
   last 11,000 years, Earth Planet. Sci. Lett., 576, 117217,             Ling, Y., Dai, X., Zheng, M., Sun, Q., Chu, G., Wang, H., Xie,
   https://doi.org/10.1016/j.epsl.2021.117217, 2021.                        M., and Shan, Y.: High-resolution geochemical record for the
Jin, L., Chen, F., Morrill, C., Otto-Bliesner, B. L., and Rosenbloom,       last 1100 yr from Lake Toson, northeastern Tibetan Plateau,
   N.: Causes of early Holocene desertification in arid central Asia,       and its climatic implications, Quaternary Int., 487, 61–70,
   Clim. Dynam., 38, 1577–1591, https://doi.org/10.1007/s00382-             https://doi.org/10.1016/j.quaint.2017.03.067, 2018.
   011-1086-1, 2011.                                                     Liu, X., Rao, Z., Shen, C. C., Liu, J., Chen, J., Chen, S.,
Jungclaus, J. H., Lohmann, K., and Zanchettin, D.: Enhanced 20th-           Wang, X., and Chen, F.: Holocene Solar Activity Imprint on
   century heat transfer to the Arctic simulated in the context of          Centennial- to Multidecadal-Scale Hydroclimatic Oscillations in
   climate variations over the last millennium, Clim. Past, 10, 2201–       Arid Central Asia, J. Geophys. Res.-Atmos., 124, 2562–2573,
   2213, https://doi.org/10.5194/cp-10-2201-2014, 2014.                     https://doi.org/10.1029/2018jd029699, 2019.
Kirov, B. and Georgieva, K.: Long-term variations and interrela-         Lods, G., Roubinet, D., Matter, J. M., Leprovost, R., and
   tions of ENSO, NAO and solar activity, Phys. Chem. Earth,                Gouze, P.: Groundwater flow characterization of an
   27, 441–448, https://doi.org/10.1016/S1474-7065(02)00024-4,              ophiolitic hard-rock aquifer from cross-borehole multi-
   2002.                                                                    level hydraulic experiments, J. Hydrol., 589, 125152,
Knudsen, M. F., Jacobsen, B. H., Seidenkrantz, M. S., and Olsen, J.:        https://doi.org/10.1016/j.jhydrol.2020.125152, 2020.
   Evidence for external forcing of the Atlantic Multidecadal Oscil-     Ma, C., Wang, F., Cao, Q., Xia, X., Li, S., and Li, X.: Climate
   lation since termination of the Little Ice Age, Nat. Commun., 5,         and environment reconstruction during the Medieval Warm Pe-
   3323, https://doi.org/10.1038/ncomms4323, 2014.                          riod in Lop Nur of Xinjiang, China, Sci. Bull., 53, 3016–3027,
Kodera, K.: Solar cycle modulation of the North At-                         https://doi.org/10.1007/s11434-008-0366-6, 2008.
   lantic Oscillation: Implication in the spatial structure              Ma, J. and Edmunds, W. M.: Groundwater and lake evolution in
   of the NAO, Geophys. Res. Lett., 29, 59-51–59-54,                        the Badain Jaran Desert ecosystem, Inner Mongolia, Hydrogeol.
   https://doi.org/10.1029/2001gl014557, 2002.                              J., 14, 1231–1243, https://doi.org/10.1007/s10040-006-0045-0,
Kodera, K. and Kuroda, Y.: Dynamical response to                            2006.
   the solar cycle, J. Geophys. Res.-Atmos., 107, 4749,                  Ma, Z., Xia, L., Xu, X., Xia, Z., Li, X., and Wang, L.:
   https://doi.org/10.1029/2002jd002224, 2002.                              Geochemical characteristics of basalts: evidence for the tec-
Lan, J., Xu, H., Sheng, E., Yu, K., Wu, H., Zhou, K., Yan, D., Ye, Y.,      tonic setting and geological significance of Kulehu ophiolite,
   and Wang, T.: Climate changes reconstructed from a glacial lake          South Tianshan Mountains, Acta Petrol. Mineral., 25, 387–400,
   in High Central Asia over the past two millennia, Quaternary Int.,       https://doi.org/10.1016/S1872-2040(06)60043-1, 2006 (in Chi-
   487, 43–53, https://doi.org/10.1016/j.quaint.2017.10.035, 2018.          nese with English Abstruct).
Lan, J., Xu, H., Yu, K., Sheng, E., Zhou, K., Wang, T., Ye, Y.,          Mahaney, W. C., Dirszowsky, R. W., Milner, M. W., Menzies, J.,
   Yan, D., Wu, H., Cheng, P., Abuliezi, W., and Tan,L.: Late               Stewart, A., Kalm, V., and Bezada, M.: Quartz microtextures and

Clim. Past, 18, 975–988, 2022                                                                  https://doi.org/10.5194/cp-18-975-2022
You can also read