Housing Opportunities Analysis City of Defiance, Ohio
←
→
Page content transcription
If your browser does not render page correctly, please read the page content below

Housing Opportunities Analysis
                       City of Defiance, Ohio

Prepared For:

Defiance County Community
  Improvement Corporation (CIC)
1300 East Second Street, Suite 201
Defiance, OH 43512                                                               June 28, 2019

                DiSalvo Development Advisors, LLC | www.DDAdvise.com | 614.260.2501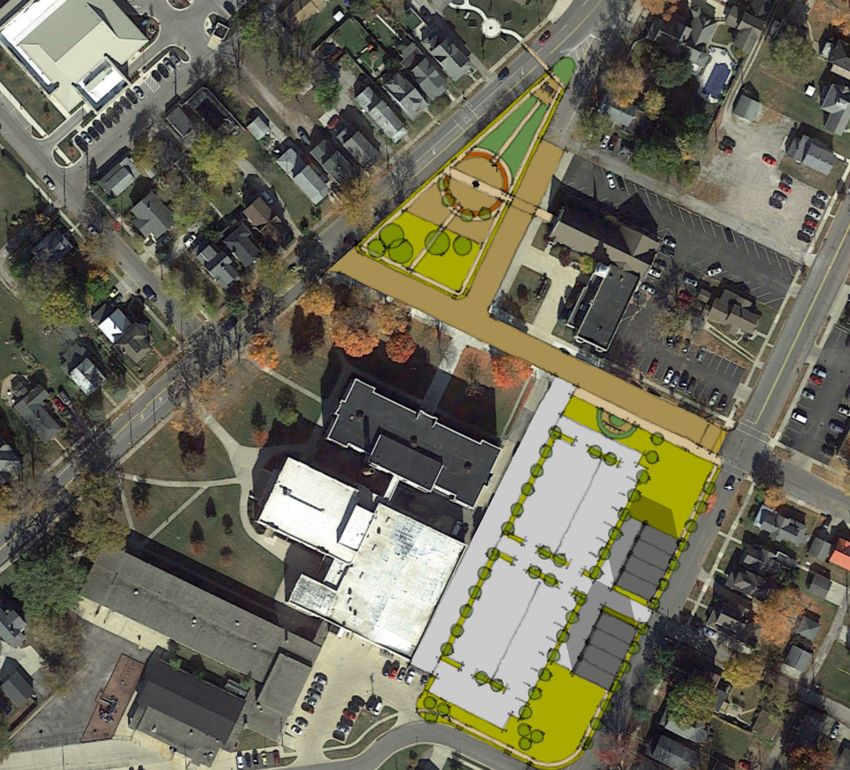
TABLE OF CONTENTS

I.     Executive Summary................................................................. 1

II.    Introduction ............................................................................ 11

III.   Housing Market Conditions ................................................... 14

IV.    Demographic & Economic Analysis ....................................... 21

V.     Downtown Assessment.......................................................... 26

VI.    Online Housing Survey .......................................................... 30

VII.   Demand Analysis ................................................................... 37

Addendum: Gateway Illustrations and Best Practice Examples (Gossman Group)
I.     Executive Summary

The purpose of this report is the identification of housing opportunities within the City of
Defiance and strategies to facilitate housing development. The following summarizes the key
findings and conclusions contained within the market analysis.

It is DDA’s opinion that a market exists in the next three years for 274 to 386 new housing units
within the City of Defiance. A distribution of housing support by product type and area is
included in the following table:

                          Market-Supported New Housing Development
                                      Three-Year Total
                                    City of Defiance, Ohio

 Housing Type & Price Range                                                   Total Units
 Rental Housing                                                                190 - 266
                                                        Less than $750                   82 - 116
                                                          $750 to $849                    55 - 78
                                                          $850 to $999                    37 - 52
                                                     $1,000 and Higher                    16 - 20
 For-Sale Single-Family                                                         52 - 64
                                                  $125,000 to $199,999                    40 - 44
                                                  $200,000 to $299,000                    10 - 16
                                                            $300,000+                       2-4
 For-Sale Condominium/Villa/Duplex/Townhouse                                    30 - 52
                                                  $125,000 to $199,999                    26 - 40
                                                  $200,000 to $300,000                     4 - 12
                                                          3-Year Total         274 - 386

The projected total units represent optimal market support in the market assuming a variety of
housing types, price points and locations are available. Additional market support exists at lower
sale prices; however, the ability of home builders to delivery new housing below $125,000 is
limited due to rising construction costs.

The Defiance housing market is severely constrained by the lack of modern housing production,
especially among rental housing and more moderately priced for-sale housing. The lack of
modern housing in Defiance is hindering household growth in the market and adversely
impacting the addition and sustainability of local businesses (e.g. lower consumer spending
power and smaller labor pool) and municipal and school district revenue (e.g. income and
property tax).

The greatest unmet demand for housing in Defiance is rental housing, despite the fact that three
of four households in the area are homeowners. Overall, the rental housing stock in the City of
Defiance is much older and more often functionally obsolete than for-sale housing options. The
low prevailing rent associated with the older housing has unrealistically set expectations of
achievable rents in the area and likely dissuaded multifamily housing developers from entering
the market. DDA has documented the demand for higher-priced newer housing in this report
through a combination of our online housing survey and a detailed housing and demand
analysis.
1|Page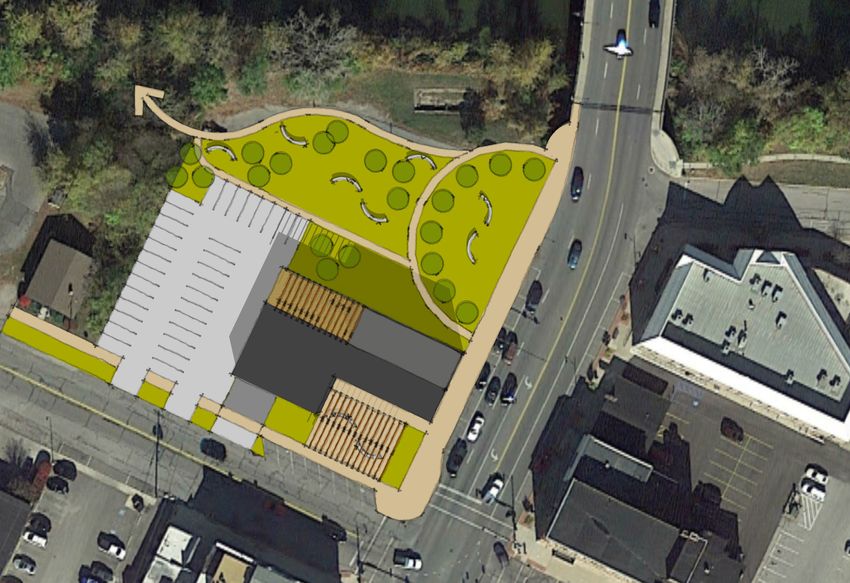
Housing Development Strategies

DDA has provided examples of development sites for a variety of housing products throughout
the area based on three factors:

   1. Relocation to most popular areas (based on online survey results)
   2. Vacant and/or redevelopment potential
   3. Attractive environment that commands housing premiums
          a. Rentals: higher market exposure, proximity to shopping and employment
          b. For-Sale: homes back up to wooded areas, water, golf course, parkland, etc.

Property owners were not contacted regarding the status of their properties. Therefore, the
inclusion of their properties in the list is for example purposes only.

Rental Housing

Our online survey of more than 700 local residents and workers indicated the North Clinton
Street area and Downtown are the most popular places in Defiance for renters to relocate.

All of the example rental housing sites shown
are in mixed-use environments. The 11-acre
site along North Clinton Street is currently a
trailer park called Northtowne Estates. The
property is in disrepair and has been plagued
by past sewage issues and overdue water
bills.

The trailer park site and the vacant 40-acre
site are adjacent Diehl Park and Northtowne
Mall. The sites south of US Highway 24 are
also within walking distance of Defiance
College.

Areas within a few blocks of the core
downtown area are considered candidates for
multifamily redevelopment, primarily rental,
but also for-sale housing.

2|Page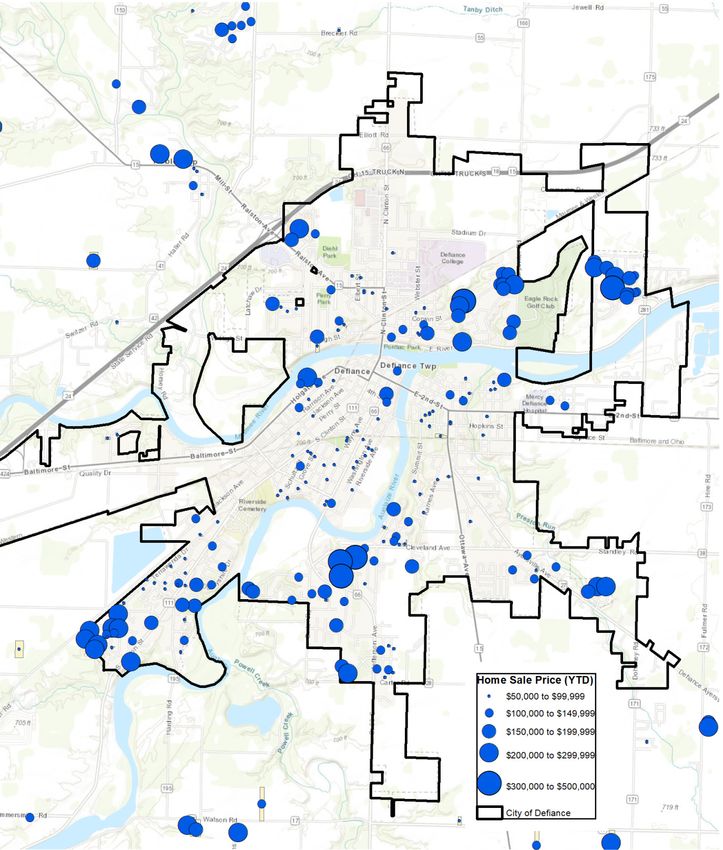
The North Clinton Street and Downtown areas present the best opportunities for housing
developers to achieve moderate to high-level rents of $750 and higher.

Units Priced Above $750/Month:

Nearly half the residents and
local workers surveyed indicated                Rent Willing To Pay in Downtown
that they would pay more than
                                                            Defiance
$750 per month for housing that
met their preferences.
                                                    5% 4%                           Less than $750
There are approximately 1,000                  8%
renter households within the City       10%                                         $750 to $849
of Defiance and immediate                                                   52%
surroundings        that      can                                                   $850 to $949
adequately afford rents in                    21%
excess of current rent levels.                                                      $950 to $1,049
Based on results of our online
                                                                                    $1,050 to $1,249
survey, a higher percentage of
households prefer to rent in the                                                    $1,250 to $1,500
downtown area with nearly half
willing to pay rents above $750
per month, 12 percentage points
higher than renters willing to pay
outside of the downtown area.
                                        Community Reinvestment Area Program – CRAs One & Two
Both areas are also within two of
the city’s four Community
Reinvestment Areas (CRAs).
CRAs One and Two provides
100 percent tax abatement for
commercial     and    residential
construction over a 15-year
period (see map on right for
CRAs boundaries).

Qualified Opportunity Zones

A majority of the downtown area
is also within the newly created
Qualified Opportunity Zones
(QOZs). QOZs were created by
the 2017 Tax Cuts and Jobs Act,
and are designed to spur
investment     in     communities
through tax benefits.

QOZs provide a deferral and reduction of capital gains taxes within five to seven years and a
total waiver of capital gains taxes at ten years or longer. The Qualified Opportunity Zone for the
City of Defiance is census tract 9586.00 (see map on following page).

Properties eligible for QOZ investment or Qualified Opportunity Funds (QOF) must be
purchased after 12/31/2017 with any prior ownership limited to 20% of the fund.

3|Page
The current QOF deadlines, pending new legislation are as follows.
QOF Important Dates
Qualified Opportunity Zone (highlighted in blue)
December 31, 2019 – Last day to
invest in QOF to receive ALL potential
tax benefits
December 31, 2021 – Last day to
invest in QOF to be able to receive
10% reduction in tax liabilities
December 31, 2026 – Last day to
invest in QOF without 5- and 7-year tax
reduction.
December 31, 2028 – QOZs expire,
pending new legislation
The QOZ impacts the north and western
areas of Downtown Defiance. Specifically,
all eligible areas south of Fourth Street are
on the north side of Clinton Street. QOZ’s
can be used in conjunction with other
incentive programs, such as the Federal
and State Historic Tax Credit program or the CRA Program.
Bedroom Types and Other Considerations
The downtown area represents the best opportunity for one-bedroom units. Based on the limited
base of one-person renter households with incomes in excess of $35,000, we recommend no
single development includes more than 10 to 12 total one-bedroom units.
Two-bedroom units are the highest in demand and should include two bathrooms.
The existing rental units in the market are small, but overall acceptable sizes. However, the
issue is that the existing floorplans are largely inefficient use of living space, including enclosed
kitchens, long hallways and small closets. New rental housing development will be marketable
and attractive at similar sizes (see square footage comparisons on page 16), but with more
open and efficient layouts and up-to-date amenities.
Survey respondents indicated the importance of reserved parking in the downtown and that they
also would be willing to pay more for a bonus room and half would pay extra for a fitness center.
Units Priced Below $750 per Month:
The demand for modern rental housing is highest for units priced less than $750 per month.
Without subsidies, however, it is unlikely a developer would consider building new or
substantially renovating housing renting below $750 per month. However, the Ohio Housing
Finance Agency (OHFA) offers a new affordable housing tax credit program that provides
housing for households earning up to 80% of the area median household income ($40,000 for a
two-person household). In prior years, OHFA’s tax credit program was limited to households
earning up to 60% of area median household income ($30,000 for a two-person household).
4|Page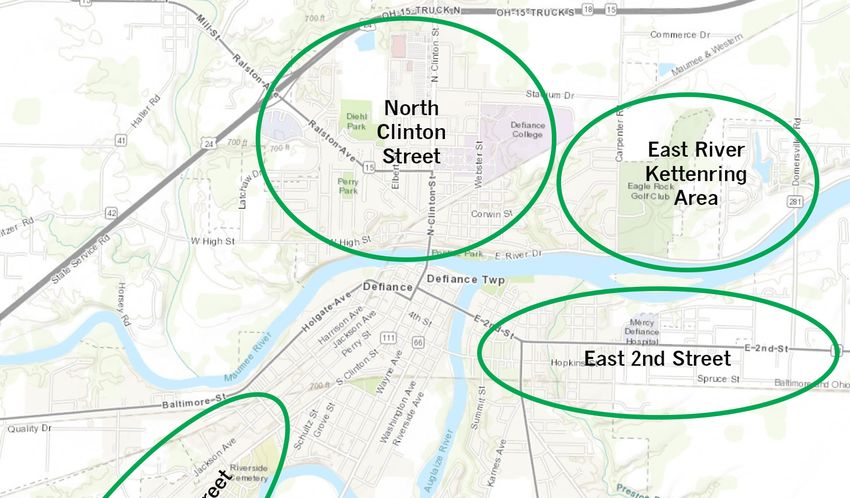
Funding from OHFA’s tax credit program is
based on a competitive scoring process with
other sites throughout Ohio. Developers are
most     attracted   to   communities     where
development sites can garner high scores based
on OHFA’s criteria. Based on our review of
OHFA’s Draft 2020-2021 Qualified Alocation
Plan, it is important for sites to be proximate
amenities, employment centers and significant
community investments. OHFA also has scoring
based on census tract indices and Opportunity
Zones. Examples of two sites in Defiance’s
Qualified Census Tract 9588 along East Second
Street are shown in the map on the right.

Based on our discussion with tax credit housing developers and OHFA thresholds, a minimum
development of at least 40 units is required.

For-Sale Housing

The Kettenring area of Defiance, within the East River Drive corridor, continues to be the most
popular and preferred area of residence for homeowners, followed by the South Jefferson
Avenue area and Downtown. Notably, there were strong responses in all areas of the city as
long as the new housing met their preferences.

                       Preferred Area of Residence : For-Sale Housing
 30.0%
 25.0%
              24.3%

 20.0%
                           18.0%

 15.0%
                                       17.2%

                                                    12.9%

                                                                  12.8%

 10.0%
                                                                                 8.8%

                                                                                              6.1%
  5.0%
  0.0%
          East River      South     Downtown       South          North      Other Areas   East 2nd
            Drive       Jefferson              Clinton Street Clinton Street                Street
                         Avenue

Examples of For-Sale Housing Site Candidates

Vacant land surrounding the northern portion of the Eagle Rock Golf Club is a prime example
for a for-sale housing development where homebuyers are more likely to pay premiums to live
adjacent a golf course (see map on following page).

The northern edge of the 108-acre parcel is bounded by train tracks, but proper buffering should
help mitigate any noise issues. A large wooded tract also provides the potential for lot/home
premiums at a site in the South Clinton Street area.

5|Page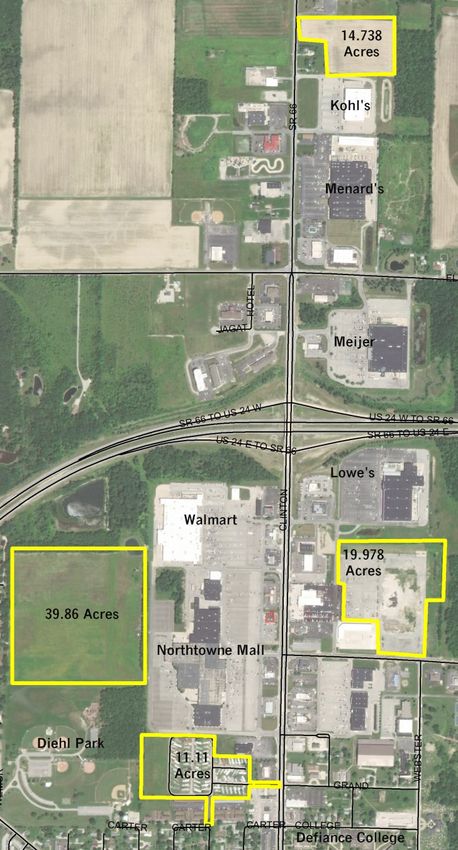
Carpenter Road Site – Kettenring Area            Canal Road Site – South Clinton Street Area

There is potential for additional phases of for-sale housing developments throughout the area.
Two examples of this type of development with proximate infrastructure are: a 24-acre site near
Promedica Defiance Regional Hospital (map on bottom left) and a 12-acre site in the South
Jefferson Avenue area (map on bottom right). The 60-acre site at the southwest corner of Carter
Road and South Jefferson Avenue is largely flat agricultural land. The development of larger
sites for housing developments should consider a retention pond as a featured amenity and
premium for adjacent homes.

Latchaw Drive Site – North Clinton Street Area   Carter Road Site/South Jefferson Avenue Area

6|Page

The demand for new single-family home development leads the market. More than seven of
every ten households surveyed would consider paying a monthly fee for maintenance-free
living.

The high-end of the condominium or villaminium market appears to be at approximately
$200,000 with rare sales of attached ranch product occurring above $200,000 and those listed
are staying on the market for an extended period of time. Based on DDA’s experience in similar
markets, a multi-story townhome product in or near the downtown could command sales rates in
the upper $200,000s. Consideration should be given to identifying townhome sites in the
downtown area or other CRA areas that would provide property tax abatement.

DDA and the Gossman Group identified a potential for-sale townhome site near the old Junior
High School. Consideration should be given to adding this area as a residential CRA and/or
incentivizing the land purchase to the developer. In Downtown Dayton, the City Development
Corporation, a local CDC, provided city-owned property to developers at relatively no cost to
facilitate townhome development.

The value of living in or near downtown, whether renting or owning will be predicated on the
attraction and vibrancy of the downtown commercial environment.

Downtown Defiance Commercial Environment

Tenant mix was assessed by DDA in Downtown
Defiance. The food and beverage category, including
upscale full-service restaurants and brewery/tap room
and brew pubs, are deemed the most underserved
tenant type and should be the priority target for future
marketing efforts. Retail goods and services are also
underrepresented within the downtown. A list of other
candidates for the downtown based on comparisons
with other downtowns can be found on pages 28 and
29.

Based on the locations of vacant space and buildings
with less than optimal uses or tenants (parcels
highlighted in light orange below) we have identified
three priority areas to upgrade the merchandizing mix
(shown on map as black boxes):

1. Clinton/Second (SW corner) – 300-304 Clinton (see photo)

2. Clinton/Third (NE corner) – 319-325 Clinton
3. Clinton/Fourth (NW corner) – 416-428 Clinton

7|Page
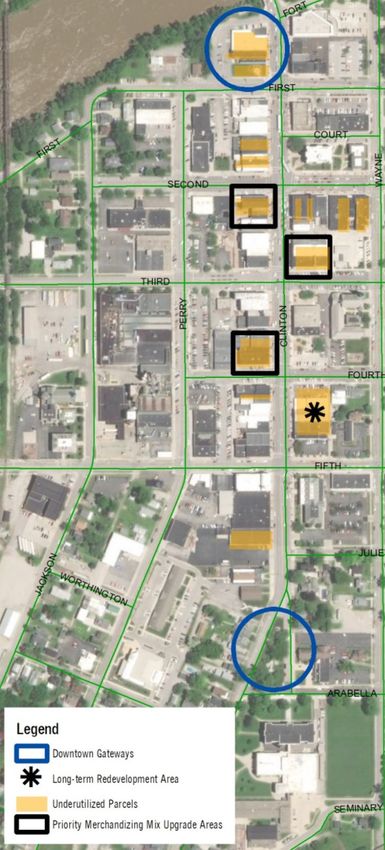
The priority corner locations to upgrade are a few of the most highly visible spaces. If upgraded
with engaging uses could help promote walkability along the downtown corridor, resulting in
more visitations and spending.
Downtown Gateways
Gateways are important place-makers for downtowns and special districts. Gateways, when
done well, are not only visually attractive and provide a strong first impression of the downtown,
but also help to define the geographic limits of the downtown district. Framing the boundaries of
downtown with gateways heightens visitor awareness of the special territory the architecture,
public realm and collection of tenants within it.
When completed, the gateways and the downtown environs all contribute to the truest sense of
place. DDA teamed with Gossman Group, a design and planning firm, to identify the best
possible gateway locations and provide illustrative examples. The recommended gateways for
the downtown are at the north and south ends of the Clinton Street corridor (areas circled in
blue on map on prior page). An illustration and example photo of potential redevelopment for
each gateway follows. Additional illustrations and examples are included in the Addendum.
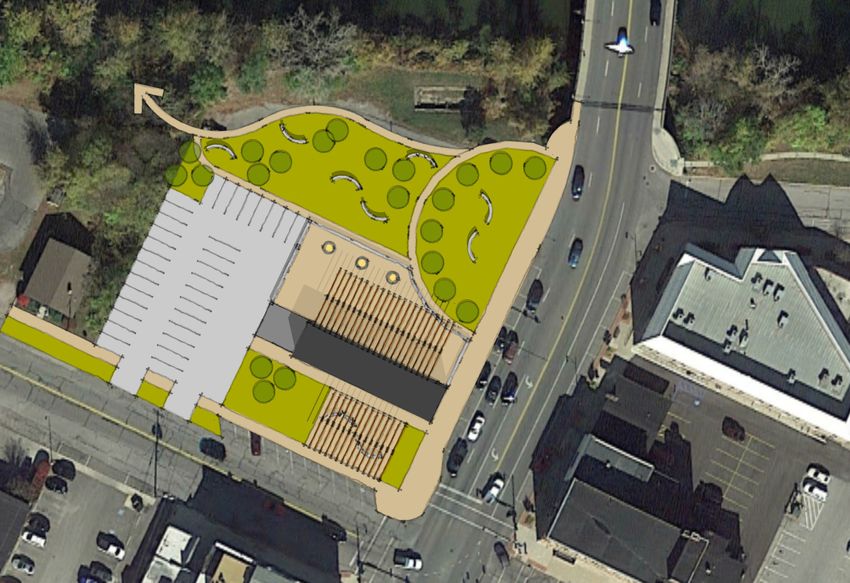
Downtown North Gateway
The northwest corner of Clinton and West
First Streets with frontage along the
Maumee River was identified as the
downtown’s north gateway. Portions of the
property are within a floodplain and FEMA
monies are under consideration to fund
demolition of at least two buildings and
possibly a third (Harper Building, shown as
#4 on map). The illustration below shows a
scenario in which Fort Street is vacated and
the Harper building remains. We
recommend outdoor seating and recreation
area focused along the riverfront with more
consideration given to commercial use
south of Spanky’s and a potential Spanky’s
expansion combined with outdoor seating.
Another redevelopment scenario is
illustrated in the Addendum section of the
report.
1. Trail Network
2. Lawn/Park Area
3. Trellis or Covered Seating
4. Renovated “Harper” Building
5. Removal of ½ of the Second Floor for outdoor
deck
6. Spanky’s Expansion Opportunity
7. Back of House/Garbage Area
8. Parking Lot
9. Stone Walls with Signage Opportunity
Example of outdoor seating under trellis
8|PageDowntown South Gateway and Potential Townhome Site The point of the Clinton Street South split was identified as the downtown’s southern gateway. The gateway is approximately 600 feet from the Clinton/Fifth Street intersection. Despite this close proximity, however, it is difficult to see the iconic clock set back among mature trees and as a result it does not compel downtown visitors to walk farther south. Combined with the atypical downtown uses in the 600 block of Clinton Street, this visual disconnect effectively cuts off visitation to the southern portion of the downtown. The illustration by the Gossman Group shows an extended park with a relocated clock farther north with connectivity to Hometown Heroes Park via a crosswalk. In this illustration, Triangle Park is turned into a plaza with a prominent artwork piece in the middle. Example of sculptured art The suggested textured paving of the street further promotes walkability and connectivity in and around the park. A suggested memorial to Don Miller is included retaining the end zone and other key fixtures such as the scoreboard and northern field goal post. The improved gateway will also serve as a key amenity to the future redevelopment of the Junior High School. For-sale townhomes are shown along Wayne Avenue. The most likely development scenario for the townhomes involves phased development of four or more attached townhomes. 1. Textured Pavement 2. Add crosswalk to connect to Hometown Heroes Park 3. Relocate Clock to northern end of extended park and 4. Triangle Park to be turned into plaza with prominent artwork in middle 5. Preserve large trees in park 6. Investigate improved traffic circulation; potential conversion from one-way to two-way street(s) 7. The Four Horseman/Don Miller Memorial 8. Redevelopment Opportunity 9. Future Townhome Opportunity (later phases) 10. Parking Lot 11. Townhomes at Wayne Avenue 9|Page
The importance of constructing gateways was identified in The City of Defiance Strategic Plan
and 2030 Land Use Plan, created in 2011. The plan stated, “In order to define and identify the
“Downtown District” as a special place within the City of Defiance, gateways or entry portals into
the Downtown should be designed and constructed at key locations. These gateways should
contain signage, landscaping, lighting, and other design elements that make a statement about
entering the Downtown District and give visitors a sense of being in a special place.” The plan
identified the Clinton Street and Second Street bridges as potential locations. One of our two
recommended gateways is at the Clinton Street Bridge.

We do not recommend another gateway at the Second Street Bridge as a priority because the
development environment in that portion of the downtown area does not reflect the downtown’s
core urban design. Instead the area is vehicle-oriented and more reflective of a development
found in the suburbs. Additionally, it is our opinion that the Defiance County Courthouse is an
attractive landmark on Second Street that serves to let people know they have arrived
downtown. Since many visitors will travel to the downtown via Second Street, it will be
important, that other attractive uses also are visible at the intersection. This is one of the
reasons that the properties at 300-304 Clinton Street were identified as one of three priority
merchandizing mix upgrade areas.

Near and Long-Term Downtown Redevelopment Opportunities

1. Near-Term
Based on our experience, in other downtowns nationwide and our online survey results of local
residents and workers, an immediate opportunity exists for upscale rental housing in the
downtown area. The focus of redevelopment should be the conversion of upper floor spaces in
historic buildings along the Clinton Street corridor into rental housing units. The downtown offers
the best opportunity to capitalize on rent premiums and pent up demand for modern housing in
Defiance.

Similarly, premiums also exist for for-sale housing on the periphery of the downtown. The
redevelopment potential of municipal-owned parcels, including surface parking and other
underutilized parcels, should be a priority to incentivizing developers to build new housing in the
greater downtown area of Defiance.

2. Long-Term

In most markets, the success of upper floor condominiums above retail space typically follows
the successful redevelopment and occupancy of upscale rental housing development. The
willingness of people to pay upscale rents to live downtown ease their mind regarding resales
values when ready to resell. That being said, developers/builders who are interested in
apartment development and want to take advantage of a QOZ investment, may consider setting
the building up as a condominium so that they have an additional exit strategy after ten years.

Also, the successful renting of upscale units in the downtown at higher rent levels will pave the
way for future rentals in other areas of the city currently dominated by low-rent housing.

The 500 Block on the east side of Clinton (505 through 519) includes some of downtown’s
largest spaces with an atypical downtown tenant (NAPA). Two of the buildings on this block
were home to a bowling alley and the former Strand Theater. The spaces are too large for most
of the common downtown tenant types. It is our opinion, that the most likely redevelopment
scenario involves demolition of parts or all of the larger buildings. An indoor recreational use
could be an interim reuse of one of the buildings. Recreation and entertainment were noted in
the survey as desired amenities for the downtown.

10 | P a g e
II.      Introduction

A. Objective
      DiSalvo Development Advisors, LLC (DDA) has analyzed the market-supported
      opportunities for housing in the City of Defiance and the strategies in support of housing and
      long-term vibrancy of the downtown.

B. Methodology
      DDA’s conclusions related to the market-supported opportunities for housing in Defiance are
      based on analyses of the housing market within the Primary Market Area, area
      demographics and the attractiveness of the surrounding environment.

      1. Primary Market Area

      Identification of an appropriate Primary Market Area (PMA) is essential to this analysis as it
      is used to establish market demand and housing values within the City of Defiance.
      A PMA is the smallest geographic area which represents 60% to 70% of anticipated support
      for housing in the City of Defiance. The PMA includes the City of Defiance, Defiance,
      Richland and Noble Townships and portions of Highland, Tiffin and Adams Townships.

      The PMA was determined based on interviews with area real estate, planning, and housing
      professionals, analyses of area mobility patterns, and determining factors made by DDA’s
      analysts in the field. The PMA was further validated from data obtained from an online
      worker and resident survey.

      The PMA is a 120-square mile area
      situated in the southeastern area of
      Defiance County. While it is not
      uncommon for a county seat to attract
      households throughout the entire
      county, we have excluded the more
      rural areas of Defiance County. The
      PMA       captures    the    highest
      concentration of areas where local
      workers live (see thematic map on
      right).

      We do not expect substantial support
      originating from residents in rural
      environments because a move would
      be a significant change in lifestyle.

                                               Place of Residence for Local Workers (2015 Longitudinal Data, Census)

      A street map with the delineated Primary Market Area and City of Defiance corporate limits
      follows.

11 | P a g e
PRIMARY MARKET AREA – City of Defiance, Ohio
2. Downtown Assessment - Commercial Opportunities/Strategies
Downtowns are the heart of small and mid-size cities and often considered the measure of a
community’s overall charm and marketability. A vibrant downtown positively impacts housing
throughout the city and offers an urban mixed-use lifestyle often sought by young
professionals, empty nesters and employee transfers from major urban markets.
In communities dominated by decade’s old housing stock and lower rent levels, downtown
areas often represent the best opportunity to deliver modern housing stock including new
construction and historic rehab.
The ability of the market to support an appreciable amount of residential space will be
predicated not only on building attributes and prevailing market conditions, but also on
entertainment, green space, restaurants, coffee shops and night clubs within easy walking
distance (1/4 mile). Based on DDA’s experience with mixed-use development in downtowns
and lifestyle centers, these types of amenities provide a unique lifestyle that is necessary for
attracting tenants and achieving higher housing values.
12 | P a g eThe following steps will be taken to assess non-residential opportunities within the
downtown.
Conduct stakeholder interviews to assess strengths/weakness
Inventory ground floor businesses in core downtown area
Provide tenant profile (vacancies and users)
Compare downtown with other downtown areas
A basic downtown market plan in the form of a bubble diagram will be developed to highlight
areas of optimal redevelopment potential considering the following factors:
Development strategies
Housing placement
Adding to existing retail/restaurant clusters
Leveraging and enhancing areas with strong community assets (i.e. greenspace,
popular commercial businesses and parking provisions)
Other market opportunities
3. Identification of Market Conditions
Conventional apartment properties have been identified and personally inspected and/or
contacted by telephone by an analyst of DiSalvo Development Advisors.
Annual for-sale housing sales trend data and Defiance County Auditor data has been
analyzed to assess the depth of the for-sale housing market.
4. Demographic and Economic Summary
Household trends have been analyzed, including increases/decreases in households’
(projected through 2023), incomes and tenure (owner/renter).
A review of major employers, labor force, unemployment rate and distribution of employees
by industry type will be provided.
5. Demand Analysis
The report includes a demand analysis for housing development which considers several
key issues.
Historic absorption/sales rates of rental and for-sale housing within the city
Internal support – Demand from all households within the City of Defiance
External support – Demand from employees in Defiance residing outside Defiance and
anticipated new hires/transfers from outside the area.
Optimal absorption – Achievable housing total based on experience of similar sized
markets, citywide and downtown specific
The demand analysis is supplemented by results of an online survey of local workers and
residents.
13 | P a g eIII. Housing Market Conditions
Housing market conditions have been identified through an analysis of permit activity and
surveys of rental and for-sale housing. The results of the housing surveys are used to
establish the overall strength of the housing market and to identify opportunities and
obstacles related to housing development.
1. Housing Permit Activity
The City of Defiance has averaged 11 single-family home permits annually since 2010. An
additional four to five single-family homes were permitted annually in the nearby townships
of Noble, Defiance and Richland. Single-family permitting activity in Defiance accounts for
slightly more than one-third (36.8%) of all single-family homes in Defiance County.
Year of Single-Family Detached 2-Unit Attached (Duplex)
Housing Permit Total Units Total Value Average Value Total Units Total Value Average Value
2010 28 $2,832,297 $101,153 2 $300,000 $150,000
2011 5 $1,010,000 $202,000 0 $0 $0
2012 8 $2,169,348 $271,169 4 $570,000 $142,500
2013 12 $2,306,650 $192,221 0 $0 $0
2014 7 $1,678,500 $239,786 0 $0 $0
2015 4 $847,000 $211,750 6 $730,000 $121,667
2016 13 $2,671,317 $205,486 8 $1,050,000 $131,250
2017 11 $3,075,000 $279,545 2 $293,000 $146,500
Total 88 $16,590,112 $188,524 22 $2,943,000 $133,773
The highest number of annual
single-family home permits was
28 units in 2010. The peak in
Permit Activity 2010 - 2017
single-family production during 35
this period is attributable to 30 2
development of Defiance
Crossing Homes, an affordable 25
rental housing development. 20
Notwithstanding 2010, the 8
15 28
highest number of permits was 2
13, issued in 2016. One of 10 4
every four homes permitted in 12 6 13
5 11
8 7
the City of Defiance are two-unit 5 4
attached homes or duplexes. A 0
distribution of home permits by 2010 2011 2012 2013 2014 2015 2016 2017
year, value and housing type Single-Family Duplex
follows.
Since 2010, nearly three-fourths of the permits issued for duplexes in the county were within
the City of Defiance. During this period, permits for one triplex and ten units within buildings
of five or more units were issued (none in Defiance).
14 | P a g e2. Rental Housing
DDA identified and surveyed 17 apartment properties within the Defiance area totaling 801
units. At an overall 99.5% occupancy level, the local apartment market is clearly constrained
as demand is exceeding supply. A healthy rental market has an occupancy rate of
approximately 95%. The 5% vacancy provides ample mobility for residents in and out of the
area to move into alternative housing as their housing needs change. DDA identified only
two available market-rate apartments and two affordable senior housing units. Waiting lists
were indicated at more than half of the properties surveyed. As the table below shows,
overall occupancy rates are high among all ages and types of rental housing in the PMA.
Apartment Property Year Built Total Units Occupancy Rate Project Type
Defiance Crossing Homes 2010 32 100.0% LIHTC, Single-family Homes
Villas of Wayne Trail 2007 42 95.2% LIHTC, Older Adults, Age 55+
Chelsea Village 1995 72 97.2%* Market-Rate (former LIHTC)
Island Parkway Manor* 1985 45 100.0% HUD Section 202; Age 62+
Clinton Circle 1981 80 100.0% HUD Section 8; 30% of income
Kettenring Hills 1980 24 100.0% Market-Rate
Wooded Acres 1979 60 100.0% Market-Rate
Defiance Ridge 1978 35 100.0% LIHTC/RHS Section 515
Castle Court Apartments 1974 50 Not Available Market-Rate
Arlington Place 1973 64 Not Available Market-Rate
Carter Apartments 1972 57 100.0% Market-Rate
Lexington Apartments 1971 28 100.0% Market-Rate
Carriage House 1970 20 100.0% Market-Rate
Ralston Square 1970 50 100.0% HUD Section 8; 30% of income
Rosewood Manor 1969 32 100.0% Market-Rate
Winthrop Terrace 1969 80 100.0% Market-Rate
Belden Circle 1965 30 Not Available Market-Rate
Total 801 99.5%*
LIHTC – Low-Income Housing Tax Credit; RHS – Rural Housing Services; HUD – Housing and Urban Development
*Of the 14 participating properties
Of the 517 market-rate units, 421 (81.4%) were built in the 1960s and 1970s.
Rental Housing Stock (20 units+) By Year Built
400
350
85
300
250
Total Units
200
150 279
100 125
142
50 72
24 42 32
0
1960s 1970s 1980s 1995 2007 2010
Market-rate Income-Restricted
15 | P a g eChelsea Village is the newest apartment property in the PMA built in 1995. The property
originally operated as a Low-Income Housing Tax Credit property (LIHTC) and was
converted into a market-rate property (no maximum income restrictions) in 2014.
Management indicated that they are currently operating from a waiting list. Published rents
at the property have increased 5.4% to 7.0% in three months. This is a high rental increase,
indicative of demand for modern rental housing in the PMA. A 2.5% to 3.0% is considered a
healthy annual rent increase in well-established markets.
Rental housing rates in the PMA are low ranging from $410 to $630 among one-bedroom
units and $445 to $850 among two-bedroom units. We attribute the low rates to the dated
rental housing stock with minimal amenities. A distribution of one- and two-bedroom
collected rents by property, size and resulting rent per square foot follows.
One-Bedroom Two-Bedroom/1 Bath
Apartment Property Rent Size (SF) RPSF Rent Size (SF) RPSF
Lexington Apartments $495 750 $0.66 $550 830 $0.66
Carter Apartments $475 740 $0.64 $525 950 $0.55
Rosewood Manor $475 525 $0.90 - - -
Carriage House $410 675 $0.61 $550 950 $0.58
Wooded Acres $360 650 $0.55 $445-$460 925 $0.48-$0.50
Winthrop Terrace $490-$500 620-660 $0.76-$0.79 $565-$575 744-792 $0.73-$0.76
Chelsea Village - - - $685 - $740* 789-981* $0.75-$0.87
Kettenring Hills - - $850 1,100 $0.77
Arlington Place - - - $600 760 $0.79
Villas of Wayne Trail (LIHTC) $630 688 $0.92 $754 855 $0.88
Castle Court Not Available
Belden Circle Not Available
Range $410-$630 525-750 $0.55-$0.92 $445-$850 744-981* $0.48-$0.88
RPSF – Rent Per Square Foot
*1/5-bath townhome
The highest rent per square foot achieved in
the PMA is at an income-restricted senior
housing development, Villas of Wayne Trail.
The one- and two-bedroom rent per square foot
is $0.92 and $0.88, respectively. The
development includes attached ranch or one
floor duplex units with an attached one-car
garage (photo on right). The property was built
in 2007 and is restricted to persons age 55 and
older with incomes at or below 35%, 50% and
60% of area median income. A two-person
household is eligible with an annual income of
$30,000 or less (60%). The units include a
dishwasher unit which is only available in three
market-rate properties in the PMA. Villas of Wayne Trail, affordable housing for persons age 55+
16 | P a g eThe highest one-bedroom collected rent among
market-rate properties is $500 at Winthrop
Terrace. Unit amenities at Winthrop Terrace
include refrigerators, ranges and disposals (no
dishwasher, icemaker, and microwave), mini-
blinds, wall air conditioning units, ceiling fans
and units with either a patio or balcony. The
property is the only development that includes
a pool and only one of five properties surveyed
that include an on-site laundry room. Winthrop Terrace
Kettenring Hills offers the highest-priced two-
bedroom/one bath apartment in the PMA at
$850 per month. The property was built in 1980
and is located in the popular Kettenring area of
Defiance and is situated with views of
Kettenring Hills Lake, a reservoir to Auglaize
River. Unit amenities include a dishwasher,
disposal, microwave, balcony or patio and
laundry facility.
Kettenring Hills
Notably, Chelsea Village is the only property in the PMA that offers two-bedroom and more
than one bathroom. Chelsea Village also is the only market-rate property in the PMA that
offers three-bedroom units. The three-bedroom townhomes at Chelsea Village include 1.5 to
2 bathrooms and range in price from $870 to $910 per month.
Defiance Crossing Homes, the newest rental
community built in Defiance (2010), includes 32
affordable detached single-family homes. The
three- and four-bedroom homes range in price
from $625 to $660 per month, respectively. The
homes are available to families with incomes up
to 60% of the area median income (e.g.
$37,440 for a four-person household). The
homes include 2 to 2.5 baths and range in size
from 1,116 to 1,417 total square feet.
Defiance Crossing Homes
Other Rentals
According to area realtors, modest- to larger-size homes with an attached garage typically
command rents of $700 to $1,200 per month. Smaller homes in the area are generally
rented in the $500s and $600s. These smaller homes typically do not include more than one
bath and do not have an attached garage.
There is a high share of duplex rentals on the
east side of the Kettenring Hills Lake along
Deerwood Drive. The typical duplex includes
three bedrooms and two bathrooms with a one-
or two-car attached garage. A realtor indicated
that the third bedroom is often used as an
office. Rents reportedly are upwards of $1,000
per month including lawn care and snow Photo of typical duplex in Kettenring area
removal. One owner of multiple duplexes in the
area cited a 14-person waiting list.
17 | P a g e3. For-Sale Housing
Platted subdivisions represent the majority of the for-sale housing alternatives and locations
within the City of Defiance. Scattered farmhouses and manufactured homes typically
situated on larger tracts, often adjacent agriculture, are more prevalent outside the city limits
in more rural areas of the county.
Area Single-Family* Farmhouse Condominium Duplex Manufactured Home Total
PMA 7,089 417 271 111 120 8,008
City of Defiance 4,890 2 250 98 25 5,265
Defiance County 10,901 1,414 335 124 350 13,124
Source: Defiance County Auditor and DDA
*Reflect homes within platted subdivisions.
With an estimated 4,207 homeowners in the City of Defiance in 2018 (source: ESRI,
Incorporated), approximately 1,000 or 20% of the 5,265 typical owner-occupied homes
within the City of Defiance are rented or vacant (for-sale, for rent or uninhabitable). Within
the PMA, the overall share of potential rentals among these housing types is slightly lower at
15%.
Single-Family Home Sales
According to the Defiance County Auditor, there were 255 single-family home sales within
the PMA in the past year (excluding home sales of less than $50,000). A review of home
sales data provided by Re/Max Realty of Defiance indicates that the 255 home sales in
2018 are relatively comparable to sales achieved in prior years.
Nearly half the home sales were among homes priced between $50,000 and $100,000. A
review of a sample of sales among this lower priced point indicated a high share of investor
sales with few homeowners using the home as a primary residence. Additionally, as the
table below shows, the majority of homes within the lowest price point include but one
bathroom.
Median Home Sales by Sale Price and Number of Bedroom/Bathrooms
Home Sale Price Year Built 1-2Br/1Ba 2Br/2+Ba 3Br/1Ba 3Br/2+Ba 4+Br/1Ba 4+Br/2+Ba Total
$50,000 to $99,999 1952 19 5 44 36 8 11 123
$100,000 to $149,999 1961 2 5 9 32 1 13 62
$150,000 to $199,999 1972 1 1 0 27 0 6 35
$200,000 to $299,999 1993 0 1 0 12 0 16 29
$300,000 and Higher 2003 0 0 0 0 0 6 6
Total 22 12 53 107 9 52 255
Share 8.6% 4.7% 20.8% 42.0% 3.5% 20.4% 100.0%
Note: Table does not include farmhouse sales
The median year built by home sales price shows a trend with a decade or more difference
in home age for every $50,000 to $100,000 increase in home sales price.
18 | P a g eA map illustrating where home sales occurred within the PMA by price range within the past
year follows.
Home Sales in 2018
Platted Subdivisions
City of Defiance and Outlying Areas of PMA
The majority of home sales of $200,000 and higher are occurring in the Berkshire Village
area (southwest), Kettenring (northeast) and the South Jefferson Avenue area (near south)
of the City of Defiance.
19 | P a g eCondominiums
A total of 15 condominium units were sold within the City of Defiance in 2018. According to
Re/Max data, the highest condominium/villa sales total, in the past few years, of $50,000 or
more was 18 in 2015 and again in 2017. A summary of the recent condominium sales by
condominium development follows.
Year
Condominium Development Built Unit Size (SF) Bedrooms Baths Sale Amount
Auglaize Condominiums 1999 1626 3 2 $194,900
2000 1626 2 2 $190,000
Courtyard Condominiums 1986 1416 3 3 $195,500
1990 1882 3 2 $139,900
1989 2896 4 3 $175,000
Green Meadows 2005 904 2 1 $85,000
2004 904 2 1 $84,900
2006 904 2 1 $82,000
Hunter Glen Condominiums 2006 1314 3 2 $127,000
Kettenring Hills Condominiums 1978 1198 3 3 $162,500
Lakota Ridge 1990 1368 2 2 $130,000
Pontiac Condominiums 1962 1450 2 2 $87,000
River Crossing 2008 1424 2 2 $145,000
2002 1266 2 2 $135,000
2003 1266 2 2 $132,000
Notably, all of the condominium sales are duplex-style with two attached homes, most often
one-story buildings with attached garages. In 2018, Green Meadows and Pontiac
Condominiums are achieving the lowest resale prices in the market. The highest resales
occurred among Auglaize Condominiums in the South Jefferson Avenue area and Courtyard
Condominiums in the Kettenring area. The majority of condominiums are within these two
popular areas of the city.
A review of condominiums listed on Realtor.com
shows a newly constructed duplex in the
Kettenring area priced above $200,000, but it
has been listed for more than one year. To date,
just one unit has a sale pending. In total, we
identified four duplex sales above $200,000,
one in 2014 and 2015 and two in 2017, all at
Lakota Hills Condominiums near the Auglaize
River and South Jefferson Avenue.
Kettenring area condominium listed for sale
(source: Realtor.com)
20 | P a g eIV. Demographics & Economic Analysis
A. Area Demographics
1. Population Trends
A slight population decline of 448 occurred in the PMA between 2000 and 2010. Declines
are estimated and projected to continue at nearly the same rate in 2018 and 2023. From
2000 to 2010, the population decline in the City of Defiance was half the rate of decline of
the overall PMA (0.9%). The projected population decline in Defiance from 2018 to 2023 is
1.4%, 0.4 percentage point below the rate of the PMA. The population for 2000, 2010, 2018
(estimated) and 2023 (projected) are summarized as follows:
Year
2000 2010 2018 2023
(Census) (Census) (Estimated) (Projected)
Population 25,099 24,651 24,188 23,764
Population Change - -448 -463 -424
Percent Change - -1.8% -1.9% -1.8%
Source: 2000, 2010 Census; ESRI Incorporated
Between 2018 and 2023, the population is projected to decline by 1,940 persons or 0.8%.
2. Household Trends
Households are a better indication of housing demand than population, especially with
number of persons per households declining nationally. Household trends within the PMA
are summarized as follows:
Year
2000 2010 2018 2023
(Census) (Census) (Estimated) (Projected)
Households 9,814 9,843 9,750 9,612
Household Change - +29 -93 -138
Percent Change - +0.3% -0.9% -1.4%
Household Size - 2.44 2.41 2.40
Source: 2000, 2010 Census; ESRI Incorporated
Within the PMA, households increased by 29 households between 2000 and 2010. Between
2010 and 2018, the household base experienced a slight decline of 93 households. By 2023
the household base is projected to continue a slight decline to 9,612 households, a change
of only 1.4% since 2018.
The average household size within the PMA of 2.41 persons is slightly larger than the
households in the City of Defiance (2.35).
Between 2018 and 2023, the greatest growth among household age groups is projected to
be among the households between the ages of 65 and older indicating an increasing need
for housing for older adults/seniors in the market. A modest decline is projected among
households age 25 to 34 and 55 to 64. Households by age are summarized as follows:
21 | P a g eHouseholds 2018 (Estimated) 2023 (Projected) Change 2018-2023
by Age Number Percent Number Percent Number Percent Points
Under 25 414 4.2% 400 4.2% -14 -0.1
25 to 34 1,403 14.4% 1,270 13.2% -133 -1.2
35 to 44 1,522 15.6% 1,555 16.2% 33 0.6
45 to 54 1,545 15.8% 1,458 15.2% -87 -0.7
55 to 64 1,981 20.3% 1,735 18.1% -246 -2.3
65 to 74 1,651 16.9% 1,834 19.1% 183 2.1
75 & Over 1,233 12.6% 1,360 14.1% 127 1.5
Total 9,749 100.0% 9,612 100.0% -137 -
Source: ESRI, Incorporated
From 2010 to 2018, there was a four-percentage point tenure shift with an estimated
increase of 365 renter households and decline of 458 homeowners. By 2023, household
tenure shares are projected to remain relatively the same as 2018. There remains an above
average share of renters relative to the county (26.4%) and region. Households by tenure
are distributed as follows:
2010 Census 2018 (Estimated) 2023 (Projected)
Tenure Number Percent Number Percent Number Percent
Owner-Occupied 7,253 73.7% 6,795 69.7% 6,720 69.9%
Renter-Occupied 2,590 26.3% 2,955 30.3% 2,892 30.1%
Total 9,843 100.0% 9,750 100.0% 9,612 100.0%
Source: ESRI, Incorporated
3. Household Income Trends
The distribution of households by income within the PMA is summarized as follows:
2018 (Estimated) 2023 (Projected)
Household Income Households Percent Households Percent
Less Than $15,000 1,160 11.9% 907 9.4%
$15,000 to $24,999 993 10.2% 778 8.1%
$25,000 to $34,999 881 9.0% 749 7.8%
$35,000 to $49,999 1,443 14.8% 1,355 14.1%
$50,000 to $74,999 2,238 23.0% 2,207 23.0%
$75,000 to $99,999 1,300 13.3% 1,408 14.6%
$100,000 to $149,999 1,095 11.2% 1,404 14.6%
$150,000 to $199,999 353 3.6% 460 4.8%
$200,000 & Over 285 2.9% 346 3.6%
Total 9,750 100.0% 9,613 100.0%
Median Income $52,957 $58,884
Source: Esri, Incorporated
From 2018 to 2023, ESRI, Incorporated projects an income shift with 600 or 20% less
households earning less than $35,000 a year. During this same period, households earning
$75,000 or more are projected to increase by 585. In 2018, the median household income
was $52,957. By 2023, the median household income is projected to increase 11.2% to
22 | P a g e$58,884. The 2018 median household income in Defiance is $49,852, slightly lower than
the PMA.
The following table shows the estimated number of owner households within the PMA by
size and income for 2018.
Total,
Owner Households 1-PHH 2-PHH 3-PHH 4-PHH 5+PHH All Ages Age 65+
Less than $15,000 296 84 23 48 6 457 261
$15,000 - $24,999 245 102 17 30 8 402 339
$25,000 - $34,999 237 169 27 51 18 503 337
$35,000 - $49,999 294 469 65 94 38 960 449
$50,000 - $74,999 253 859 269 162 113 1,655 502
$75,000 - $99,999 79 507 219 176 151 1,132 244
$100,000 - $149,999 50 389 261 175 186 1,061 190
$150,000 or more 13 228 182 122 79 623 129
Total 1,465 2,807 1,064 857 600 6,793 2,450
Share 21.6% 41.3% 15.7% 12.6% 8.8% 100.0% 36.1%
Note: The data is derived from HUD’s Economic and Market Analysis Division, 2016 ACS county data
and has been adjusted accordingly by DDA to reflect 2018 household estimates for the PMA.
The owner and renter households of one- to two-persons represent nearly two-thirds of the
households in the PMA. However, approximately 40% of homeowners are two-person while
nearly the same share among renters is one-person households. There are 2.5 times more
homeowners age 65 and older than renters within the same age group.
The following table shows the estimated number of renter households within the PMA by
size and income for 2018.
Total,
Renter Households 1-PHH 2-PHH 3-PHH 4-PHH 5+PHH All Ages Age 65+
Less than $15,000 461 112 67 51 13 703 146
$15,000 - $24,999 305 135 84 39 28 591 155
$25,000 - $34,999 162 75 60 34 47 378 39
$35,000 - $49,999 109 153 84 39 99 483 45
$50,000 - $74,999 53 264 111 125 30 583 32
$75,000 - $99,999 24 41 33 24 47 168 9
$100,000 - $149,999 0 14 20 0 0 34 0
$150,000 or more 15 0 0 0 0 15 7
Total 1,127 793 458 312 264 2,955 434
38.1% 26.8% 15.5% 10.6% 8.9% 100.0% 14.7%
Note: The data is derived from HUD’s Economic and Market Analysis Division, 2016 ACS county data
and has been adjusted accordingly by DDA to reflect 2018 household estimates for the PMA.
23 | P a g eB. Employment
According to the 2015 Longitudinal
Census data, more than 7,000
employees commute within and out of
the PMA.
The 7,421 employees that live outside
the area and commute into the PMA
for work represent a potential source of
support for the subject property.
Another 5,859 people live inside the
PMA and commute to work outside the
PMA. In 2015, 4,456 or 37.5% of the
11,877 employees in the PMA also
lived in the PMA.
1. Labor Force Profile
One-third of the labor force in the PMA is within the Manufacturing industry. Health Care &
Social Assistance (13.7%), Retail Trade (13.1%) and Accommodation & Food Services
(7.3%) constitute another third of the employment base. Employment in the PMA, as of
2018, was distributed as follows:
NAICS Group Establishments Employees Percent
Manufacturing 40 5,838 33.9%
Health Care & Social Assistance 103 2,365 13.7%
Retail Trade 156 2,256 13.1%
Accommodation & Food Services 79 1,256 7.3%
Public Administration 86 859 5.0%
Other Services (except Public Admin) 153 831 4.8%
Finance & Insurance 58 598 3.5%
Construction 68 540 3.1%
Educational Services 18 446 2.6%
Professional, Scientific & Tech Services 67 389 2.3%
Transportation & Warehousing 19 366 2.1%
Wholesale Trade 30 340 2.0%
Information 30 331 1.9%
Real Estate, Rental & Leasing 58 250 1.5%
Management of Companies & Enterprises 3 220 1.3%
Arts, Entertainment & Recreation 16 115 0.7%
Admin & Support, Waste Mgt & Remediation 23 99 0.6%
Unclassified Establishments 35 105 0.6%
Agriculture, Forestry, Fishing & Hunting 6 9 0.1%
Utilities 4 21 0.1%
Total 1,053 17,233 100.0%
Sources: ESRI Incorporated and Infogroup
24 | P a g e2. Major Employers
The 15 largest employers within the Primary Market Area employ approximately 4,500. The
area’s three largest employers are in the manufacturing industry. A list of employers of 125
or more employees is summarized as follows:
Number of
Business Name Major Industry Employees
Gm Powertrain Manufacturing 651
Defiance Metal Products 640
Johns Manville 635
ProMedica Defiance Oncology Health Care and Social Assistance 350
ProMedica Defiance Regional Hospital 340
Mercy Health - Defiance Hospital 325
Laurels of Defiance 140
Northwestern OH Community Action Commission, Inc. 140
Meijer Retail Trade 200
Lowe's Home Improvement 150
Menards 130
Kroger Pharmacy 120
First Federal Bank Finance 177
First Defiance Financial Corp Management of Companies 177
Thomas E Keller Trucking Inc Transportation and Warehousing 160
Sources: ESRI Incorporated, Infogroup and Defiance County Economic Development
3. Employment Trends
The following charts were generated from the U.S. Department of Labor’s, Bureau of Labor
Statistics. It reflects employment and unemployment trends for Defiance County, Ohio.
Unemployment rates are at a ten-year low in Defiance County. The total of resident
employees in Defiance County has remained relatively stable since 2009.
Defiance County, Ohio: 10-Year Employment Trend
19,500 16.0
19,000 14.0
Total Employees
18,500 12.0
10.0
18,000
8.0
17,500
6.0
17,000 4.0
16,500 2.0
16,000 0.0
2008 2009 2010 2011 2012 2013 2014 2015 2016 2017 Oct‐18
Employment 19,100 17,513 17,539 17,389 17,531 17,518 17,907 17,756 17,499 17,596 17,336
unemployment 7.5 14.1 12.2 9.6 7.7 7.5 5.5 4.9 4.9 4.9 4.1
Note: October 2018 employment data is preliminary, subject to change.
25 | P a g eV. Downtown Assessment
The housing market potential in Downtown Defiance is predicated on the variety and quality of
commercial businesses within the downtown. The commercial environment is an important
factor in providing a unique lifestyle to attract persons to live downtown. The type and number of
households that would consider living downtown increases when there is a more developed and
vibrant commercial environment.
To assess the downtown’s commercial environment, DDA inventoried building uses within the
core area of the downtown. The inventory included properties with frontage along South Clinton
Street generally extending from the Maumee River to Fifth Street and properties within a block
of Clinton Street along Second Street.
Downtown Defiance encompasses a much larger area. However, we have focused on the
smaller more walkable core area for assessing the commercial environment. These types of
uses typically require higher traffic volume and visibility associated with Clinton Street’s more
conventional retail space.
1. Downtown Inventory
There is approximately 200,000 square feet of ground floor space in the core area of
Downtown Defiance. Of this space, nearly one-fourth (24%) is used by office tenants. The
next largest space user is private clubs (Masonic Temple and VFW) at 8.2%, followed by
auto parts and service (NAPA). Vacant space accounts for 11.1% of all ground floor space.
Notably, much of the vacant space is not actively marketed as available, yet other spaces
have no tenants at all and are used as transitional storage space. A distribution of ground
floor space in the core area of Downtown Defiance by uses of 4,000 or more (2% share)
square feet follows.
Downtown Core Uses by Share of Ground Floor Space
Antique Store, 2.3% Clothing & Sporting
Accessories, 2.2% Goods,
Karate Studio, 2.2% 2.1% Bar, 2.0%
Jewelry, 2.3%
Bakery, 2.3%
Music, 2.4% Office Use, 23.9%
Home Goods, 3.2%
Vacant, 11.1%
Hobby, Toy & Bank, 4.1%
Games Store,
3.3% Private Club, 8.2%
Restaurant, 4.0%
Auto Parts and
Service, 4.5%
26 | P a g eThere are at least 33 different uses throughout the core downtown area, not including
vacant space. A more detailed inventory of ground floor uses by estimated total square
footage and share follows.
Ground Floor Uses by Estimated Square Footage
Core Area of Downtown Defiance
4th Quarter 2018
Business Type Estimated Square Feet Share of Ground Floor Space
Office Use 48,080 23.9%
Vacant 22,398 11.1%
Private Club 16,385 8.2%
Auto Parts and Service 9,069 4.5%
Bank 8,300 4.1%
Restaurant 7,992 4.0%
Hobby, Toy & Games Store 6,613 3.3%
Home Goods 6,420 3.2%
Music 4,797 2.4%
Bakery 4,716 2.3%
Jewelry 4,644 2.3%
Antique Store 4,640 2.3%
Karate Studio 4,478 2.2%
Clothing & Accessories 4,400 2.2%
Sporting Goods 4,182 2.1%
Bar 4,096 2.0%
Hair Salon 3,828 1.9%
Computer Repair 3,520 1.8%
Day spa 3,124 1.6%
Home furnishings 3,080 1.5%
Coffee 3,000 1.5%
Art Gallery 2,948 1.5%
Crafts Store 2,904 1.4%
Fitness 2,332 1.2%
Beauty Supplies 2,244 1.1%
Baby Goods 1,958 1.0%
Church 1,760 0.9%
Nail Salon 1,760 0.9%
Art Studio (instructional) 1,450 0.7%
Commercial Screen Printing 1,364 0.7%
Medical Supplies 1,232 0.6%
Photography Studio 1,150 0.6%
Vacuum Repair 1,056 0.5%
Wholesale 1,056 0.5%
Total 200,976 100.0%
Source: Defiance County Auditor and DDA estimates
The downtown tenant mix was also compared with similar sized downtowns to assess its
mix of uses.
27 | P a g e2. Downtown Commercial Environment Comparisons
DDA inventoried other small- to medium-sized downtowns in Ohio to identify the typical mix
of uses associated with downtowns in different stages of maturation. Based on this
comparative assessment, Downtown Defiance has a low share of food and drink
establishments and retail goods. A
relatively healthy mix of visitor-oriented
uses, such as Ruby Rose Market, Anna
Marie’s Creations and Fort Defiance
Antiques, exists in the core downtown area.
There are high shares of office users in
ground floor spaces. Office workers bolster
consumer spending in the downtown,
however, such a high share of ground-floor
office spaces limits opportunities for
restaurants and/or retail establishments. A
comparison of the Downtown Defiance mix
of uses with the average share in a variety
of commercial environments follows.
Quality Of Average Share of Uses In Core Downtown Ground Floor Space By Quality of Environment
Environment Food & Drink Vacant Visitor-Oriented Offices Retail Goods/Services Other Uses
Poor 10% 30% 0% 10% 10% 40%
Limited 15% 25% 3% 10% 14% 33%
Fair 25% 15% 5% 15% 20% 20%
Healthy 27% 10% 10% 20% 23% 10%
Vibrant 30% 5% 13% 20% 27% 5%
Defiance 10% 11% 11% 24% 15% 29%
Our assessment of the mix of uses in
Downtown Defiance is illustrated in the
concentric ring illustration (see image on
right). Overall, it is DDA’s opinion that the
downtown area rates at a limited-to-fair
commercial environment. The introduction of
additional food and beverage establishments
will immediately improve the downtown and
attract more visitors, patrons and residents.
Notably, however, a high share of
respondents to the online survey indicated
that they would live in downtown if housing
met their preferences. This fact is a clear
indication that the commercial environment is
adequate enough to attract prospective
residents.
28 | P a g eThe assessment that there is a low share of restaurants in the downtown is validated by
residents and local workers who indicated in the on-line survey that restaurants were the top
business desired for the downtown. The addition of boutique retail shops and more modern
bars were the second and third top responses to the online survey.
While the quantity of commercial offers is important, a variety in quality is equally important.
For example, the downtown has several well-established fast casual moderately-priced
restaurants, but no higher priced options.
A list of common businesses found in other well-developed downtowns follows. The uses
highlighted are not located in the core downtown area.
Common Downtown Businesses
Antique Full-service restaurant
Apparel & accessories (excluding women's boutique) Furniture
Art galleries Game store
Arts and crafts Hardware
Bakery Health club/yoga studio/fitness center/training facility
Dog bakery Hobby/collectibles/toy
Barber Home accessories
Beauty salon Ice cream/yogurt
Beauty supplies Jeweler
Bicycle Limited-service restaurant
Book/comics Musical instruments
Bridal shop Nails salon
Candy Painting studio
Candle shop Pet goods store
Cards and gifts Pet grooming
Cellular/wireless Photo studio
Cigar Record Stores - CDs/Vinyl albums
Coffee/tea Shoe repair
Day spa Shoes
Delicatessen/Sandwich shop Specialty sporting goods
Doughnut/muffin/cupcake Tailor
Drug store Tattoo
Dry cleaner Tavern/brew pub/arcade bar
Electronic/computer repair Variety store
Eye care/eyewear Vintage shops
Family recreation Wine shop
Florist/flowers/plants Women's boutique (including consignment)
Notably, hardware and drug stores in downtowns are those that have typically been in the
market for decades.
29 | P a g eYou can also read