Host microbiome responses to the Snake Fungal Disease pathogen (Ophidiomyces ophidiicola) are driven by changes in microbial richness
←
→
Page content transcription
If your browser does not render page correctly, please read the page content below

www.nature.com/scientificreports
OPEN Host microbiome responses
to the Snake Fungal Disease
pathogen (Ophidiomyces
ophidiicola) are driven by changes
in microbial richness
Alexander S. Romer1, Joshua B. Grinath2, Kylie C. Moe1 & Donald M. Walker1*
Dermatophytic pathogens are a source of disturbance to the host microbiome, but the temporal
progression of these disturbances is unclear. Here, we determined how Snake Fungal Disease, caused
by Ophidiomyces ophidiicola, resulted in disturbance to the host microbiome. To assess disease
effects on the microbiome, 22 Common Watersnakes (Nerodia sipedon) were collected and half were
inoculated with O. ophidiicola. Epidermal swabs were collected weekly for use in microbiome and
pathogen load characterization. For the inoculated treatment only, we found a significant effect of
disease progression on microbial richness and Shannon diversity consistent with the intermediate
disturbance hypothesis. When explicitly accounting for differences in assemblage richness, we found
that β-diversity among snakes was significantly affected by the interaction of time and treatment
group, with assemblages becoming more dissimilar across time in the inoculated, but not the control
group. Also, differences between treatments in average microbiome composition became greater
with time, but this interactive effect was not evident when accounting for assemblage richness. These
results suggest that changes in composition of the host microbiome associated with disease largely
occur due to changes in microbial richness related to disease progression.
Emerging infectious diseases (EIDs) have been identified by conservation biologists as a leading threat to global
biodiversity in this c entury1–3. EIDs caused by fungal pathogens are of particular concern as they are more likely
to result in the extinction/extirpation of their hosts when compared to diseases caused by other infectious a gents4.
Notable fungal diseases of wildlife include White-nose Syndrome of bats, Chytridiomycosis of amphibians, and
Snake Fungal Disease5–7. Snake Fungal Disease (SFD) occurs in wild snake populations of many species, across a
large geographic area in the United States, and has also been detected in numerous other countries8–13. Research
has demonstrated that the fungus Ophidiomyces ophidiicola (previously Ophidiomyces ophiodiicola [Guarro,
Deanna A. Sutton, Wickes and Rajeev] Sigler, Hambl. and Paré), is the causative agent of S FD5,14. Understand-
ing host responses to EIDs, such as SFD, may largely depend on our knowledge of how pathogens interact with
host microbiomes.
The tissues and organs of multicellular organisms provide dynamic habitat for the host m icrobiome15,16. The
epidermis of vertebrates harbors a diverse assemblage of microbes whose composition can be altered by factors
such as microtopography, host demographics, and environmental conditions17. Additionally, multicellular organ-
isms possess complex relationships with their microbiome which can influence digestion, fitness, and pathogen
susceptibility18–20. For example, Chytridiomycosis is known to alter the amphibian microbiome in wild popula-
tions and laboratory e xperiments21. Previous work has demonstrated that the epidermal microbiome of snakes
sampled in the Eastern United States is distinct from environmental microbial assemblages22. Furthermore, host
species, host habitat, and the presence of O. ophidiicola are predictive of the snake microbiome across spatial
scales22,23. This suggests that the epidermal snake microbiome is not simply a product of random dispersal of
microbes from the environment and is sensitive to host disease state. However, microbiome responses during
1
Department of Biology, Middle Tennessee State University, 1301 E Main St, Murfreesboro, TN 37132,
USA. 2Department of Biological Sciences, Idaho State University, 921 S. 8th Ave, Pocatello, ID 83209, USA. *email:
donald.walker@mtsu.edu
Scientific Reports | (2022) 12:3078 | https://doi.org/10.1038/s41598-022-07042-5 1
Vol.:(0123456789)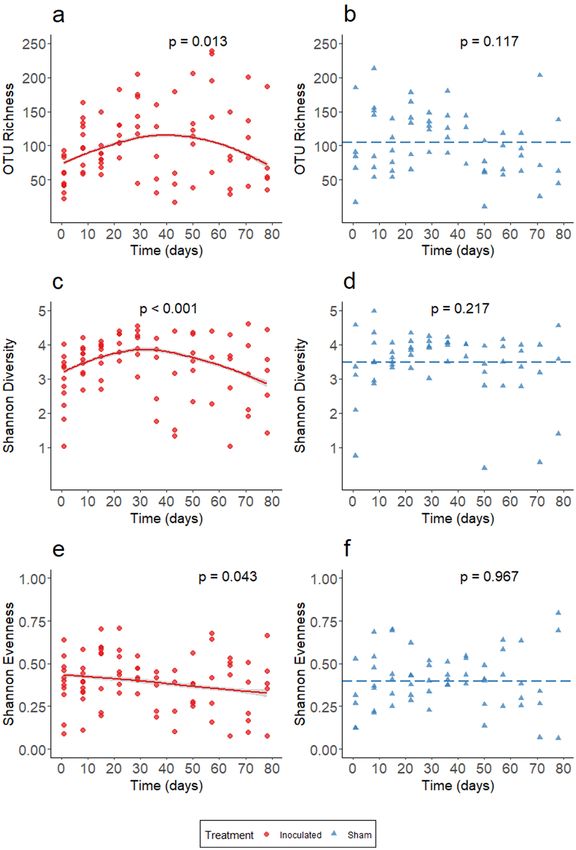
www.nature.com/scientificreports/
disease progression are generally unclear. This study investigates the relationship between Snake Fungal Disease
progression and disturbance to the skin microbiome within an ecological context.
Ecological disturbance can be defined as the alteration of an ecological system by a perturbing biotic or
abiotic process24. Host microbial assemblages are subject to ecological disturbance including such processes as
epidermal disease flares25. Consequently, it may be reasonable to conceptualize colonization of snake skin by
a fungal pathogen, like O. ophidiicola, as a disturbance to the host microbiome. Disturbance is associated with
increased variability in microbial assemblage composition and alterations to the relative importance of stochastic/
deterministic assembly processes26. Additionally, increases in the magnitude or frequency of disturbance can
result in changes to assemblage richness or other measures of diversity27. A widely accepted model relating dis-
turbance and species richness is the intermediate disturbance hypothesis28. This hypothesis suggests that higher
levels of disturbance will increase species richness, until a threshold value is reached, at which point additional
levels of disturbance will decrease r ichness28. Given that the extent of clinical signs associated with SFD generally
increases over time14, it is likely that the microbiome may be differentially affected at different stages of infection.
However, it is unclear whether microbiome response to disease is consistent with the intermediate disturbance
hypothesis or other patterns of change.
Many field studies examining SFD have used samples of snakes collected at a single time point22,23,29,30.
However, field studies with repeat sampling report significant variability in clinical signs and fungal load within
individuals31–33. Understanding the mechanisms that underlie disease state variability is an unresolved but central
issue in wildlife disease. SFD has been correlated with negative impacts to snake overwintering and reproductive
suppression33–35. However, changes in the host microbiome may, in part, explain variation in pathogen load and
disease signs, as the microbiome serves as the first line of defense against p athogens17. Studies have shown that
infection with O. ophidiicola alters the composition of the host microbiome22,23. Furthermore, some culturable
skin microbes of snakes are known to have inhibitory effects against O. ophidiicola36. Thus, understanding the
effects of fungi on the microbiome, at the skin interface, may inform our understanding of microbial response
to a pathogen mediated environment.
The overall objective of this experiment was to determine the effects of O. ophidiicola on the host microbi-
ome over temporal scales relevant to disease progression. We tested the following predictions: pathogen load
will increase through time, prior to mortality, and infection will alter measures of alpha diversity (Operational
Taxonomic Unit [OTU] richness, Shannon diversity, Shannon evenness), beta diversity (multivariate disper-
sion), and average community composition through time. To test these predictions, we inoculated snakes under
controlled conditions and evaluated changes in microbial assemblages using metrics based on both the presence
and abundance of OTUs to understand the community properties (i.e. richness, evenness) driving the observed
patterns. This experiment provides a framework for interpreting the effects of wildlife pathogens on epidermal
microbiomes over the course of disease progression. Additionally, our results elucidate bacterial-fungal interac-
tions in a non-mammalian epidermal microbiome within the context of host disease and wildlife conservation.
Results
We collected and analyzed 144 epidermal swabs via qPCR and high-throughput 16S rRNA amplicon sequencing.
Eighteen snakes were swabbed on a weekly basis throughout the course of the experiment which lasted a total
of 13 weeks. Eleven snakes were assigned to the inoculated treatment group and seven snakes were assigned to
the sham treatment group. Over the course of the experiment, six inoculated snakes and four sham snakes died.
Inoculated snakes had a mean value of 52% positive qPCR reactions when analyzed on a per-animal basis (i.e.,
isease37.
not lumped before analysis). All snakes in the inoculated treatment group developed clinical signs of d
Pathogen load. Days prior to mortality was found to be significantly predictive of copy number (LME,
χ2 = 3.92, p = 0.002; Fig. 1a). Thus, as the days prior to an animal experiencing mortality decreased, copy number
increased in qPCR positive swabs (slope = −0.04; SE = 0.02). Additionally, experimental time was found to be sig-
nificantly predictive of copy number (LME, χ2 = 9.73, p = 0.003; Fig. 1b). Thus, as the experiment progressed, we
detected higher pathogen load in our inoculated animals (slope = 0.07; SE = 0.03). These results indicate inocula-
tion success and disease progression through time.
Alpha diversity. A significant and non-linear trend for OTU richness was found for the inoculated treat-
ment group through time (GAMM, edf = 2.53, F = 3.86, p = 0.0126; Fig. 2a) but not for the sham control group
(GAMM, edf = 1.61, F = 1.83, p = 0.117; Fig. 2b). Inoculation produced a concave relationship where richness
initially increased and then decreased through time. As with richness, a significant and non-linear trend for
Shannon diversity (H) through time was observed for the inoculated treatment group (GAMM, edf = 2.559,
χ2 = 20.75, p < 0.001; Fig. 2c) but not the sham control group (GAMM, edf = 2.18, χ2 = 2.82, p = 0.217; Fig. 2d).
Thus, inoculation produced a non-linear trend on alpha diversity of the host microbiome, which was not
observed in the sham control group. Furthermore, a significant effect of time on Shannon evenness (E) was
observed for the inoculated treatment group (GAMM, edf = 1.00, F = 4.181, p = 0.043; Fig. 2e) but not the sham
treatment group (GAMM, edf = 1.000, F = 0.002, p = 0.967; Fig. 2f). We observed a consistent decrease in even-
ness among inoculated snakes through experimental time. Additionally, as four of seven snakes in the sham
control group died during the experiment, we assessed if mortality type (natural death or euthanasia) had a
significant effect on alpha diversity among sham snakes. Time had a significant effect on OTU richness (GAMM,
edf = 2.33, F = 4.058, p = 0.011) and Shannon diversity (GAMM, edf = 2.36, χ2 = 14.605, p = 0.001) among sham
snakes that died naturally (Supplemental Material, Fig. S1). These relationships were concave in shape, but they
did not drive patterns found when considering all sham snakes together in the analyses above. All results in this
study were robust to the inclusion of mortality type as a covariate.
Scientific Reports | (2022) 12:3078 | https://doi.org/10.1038/s41598-022-07042-5 2
Vol:.(1234567890)
www.nature.com/scientificreports/
Figure 1. Days before mortality and time are predictive of pathogen load in inoculated snakes. (a) Pathogen
load is represented as a function of time measured in units of days before mortality. Pathogen load values were
derived from the natural log transformation of copy number values for O. ophidiicola. The negative trendline in
this subplot indicates that as snakes were temporally closer to mortality, we observed higher pathogen loads. (b)
The positive trendline in this subplot indicates that as the experiment progressed, we observed higher pathogen
loads. LME model p-values for temporal effects are provided within each panel.
β‑diversity. Multivariate dispersion of the pathogen inoculated group was significantly higher than the
sham control group for both the Jaccard index (LME, χ2 = 32.49, p < 0.001; Fig. 3a, Table 1) and Bray–Curtis
index (LME, χ2 = 23.69, p < 0.001; Fig. 3b, Table 1). The interaction of time and treatment group had a significant
effect on multivariate dispersion of the Raup-Crick metric (LME, χ2 = 3.90, p = 0.048; Fig. 3c, Table 1). A post
hoc assessment found that time had no significant effect on multivariate dispersion of the Raup-Crick metric
for the sham control group (GLS, T-value = −0.75, p = 0.457; Fig. 3c) but did have a significant effect on inocu-
lated treatment group (GLS, T-value = 2.34, p = 0.022; Fig. 3c). We observed a positive relationship between time
and distance-to-centroid values for the Raup-Crick metric in the inoculated treatment group (slope = 0.002,
SE = 0.001). The Raup-Crick metric is a presence/absence community dissimilarity metric, which generates a
null expectation for the number of shared species between communities by relating global site occupancy of taxa
to local site occupancy probabilities, and then accounting for sampling bias likely to occur due to differences in
richness between s ites38. Thus, when we explicitly account for differences in richness, pathogen inoculated snake
microbiomes became more dissimilar over the entire course of the experiment resulting in increased β-diversity
among snakes.
Assemblage composition. The interaction between experimental treatment and time was found to have
a significant effect on the average microbial composition when measured using both the Jaccard index (PER-
MANOVA, F-stat = 1.34, p = 0.020; Fig. 4a, Table 2) and the Bray–Curtis index (PERMANOVA, F-stat = 1.44,
p = 0.038; Fig. 4b, Table 2) but not the Raup-Crick metric (PERMANOVA, F-stat = 1.58, p = 0.307; Fig. 4c,
Table 2). This suggests that differences in host microbiome composition between treatment groups are primarily
explained by differences in OTU richness.
Discussion
Disturbance ecology allows investigators to predict and interpret the effects of perturbations, such as disease, on
biotic assemblages24. In this investigation, O. ophidiicola was investigated as a potential ecological disturbance
to the host microbiome. By inoculating snakes with O. ophidiicola in a controlled and pseudo-naturalistic set-
ting, the effects of SFD could be measured through time for individual snakes. Thus, we were able to investigate
temporal trends in host microbiome diversity and composition associated with infection. Our results suggest that
SFD progression generates non-linear trends in host microbiome diversity. Furthermore, we found that analyses
of null models of β-diversity (Raup-Crick dissimilarity) conflicted with traditional community dissimilarity
metrics. This suggests that changes in assemblage richness are an important mechanism through which host
microbiome composition is altered by O. ophidiicola. The patterns we observed within this system are consistent
with conceptual models of disturbance ecology, in particular, the intermediate disturbance hypothesis.
Infection with O. ophidiicola can have detrimental consequences for the host such as increased basal meta-
bolic rate and evaporative water l oss39. Fungal pathogen load has been shown to increase at both the population
and individual level over the course of an infectious disease o utbreak40,41, which is consistent with our study
Scientific Reports | (2022) 12:3078 | https://doi.org/10.1038/s41598-022-07042-5 3
Vol.:(0123456789)www.nature.com/scientificreports/
Figure 2. Time is predictive of OTU richness, Shannon diversity, and Shannon Evenness in inoculated but not
sham snakes. (a,b) OTU richness of the host microbiome as a function of time. (c,d) Shannon diversity of the
host microbiome as a function of time. (e,f) Shannon evenness of the host microbiome as a function of time.
(a,c,e) Trendlines were generated using generalized additive mixed effects modeling. (a,c) Note that both OTU
richness and Shannon diversity initially rose and then declined among the inoculated treatment group. (e)
Among the inoculated treatment group, we observed a decrease in evenness through experimental time. (b,d,f)
No significant effect of time was found for any measured component of alpha diversity among the sham control
group. The dotted line in these subplots represents the mean value for OTU richness, Shannon diversity, or
Shannon Evenness. P-values for temporal effects are provided within each panel.
results. We found that infection progressed in severity throughout the clinical trial for inoculated animals. While
field studies do suggest chronic infection in free-roaming s nakes32–34, other attempts to inoculate snakes with
O. ophidiicola have reported a similar acute progression of disease as reported h ere14,42. Additionally, we found
that higher pathogen load was associated with a shorter time until mortality. We were unable to determine that
Scientific Reports | (2022) 12:3078 | https://doi.org/10.1038/s41598-022-07042-5 4
Vol:.(1234567890)www.nature.com/scientificreports/
Figure 3. Inoculation results in higher β-diversity of the host microbiome. Multivariate dispersion of the host
microbiome was approximated by generating distance-to-centroid values for the (a) Jaccard, (b) Bray–Curtis,
and (c) Raup-Crick dissimilarity metrics. (a,b) There was a significant difference between treatment groups for
both the Jaccard and Bray–Curtis indices (boxplots; LME p-values within each panel). Inoculated snakes were
predicted to have higher distance-to-centroid values indicating greater dissimilarity or β-diversity throughout
the experiment. (c) A positive relationship was observed between time and distance-to-centroid values for the
Raup-Crick metric in the inoculated treatment group. Thus, the host microbiome of inoculated snakes tended
to become more dissimilar over time. No relationship between time and distance-to-centroid values was found
for the Raup-Crick metric for the sham control group. Consequently, a dotted line was used to represent the
regression for this group (p-values are provided for post-hoc regressions).
Denominator Fixed effects Standard error of
Fixed effects degrees of freedom estimates estimates χ2 P-values R-squared
Treatment 15 0.0235 0.0066 32.493 < 0.001
Time 124 −0.0003 0.0002 4.278 0.039
Jaccard 0.360
Treatment*time 15 < 0.0001 0.0001 < 0.001 0.999
Mortality type 124 −0.0082 0.0046 3.200 0.074
Treatment 15 0.0329 0.0105 23.694 < 0.001
Time 124 −0.0001 0.0003 0.102 0.749
Bray–Curtis 0.279
Treatment*time 15 −0.0001 0.0002 0.045 0.832
Mortality type 124 −0.0125 0.0071 3.066 0.080
Treatment 15 0.0098 0.0388 8.698 0.003
Time 124 0.0008 0.0009 1.539 0.215
Raup-Crick 0.231
Treatment*time 15 0.0017 0.0009 3.900 0.048
Mortality type 124 −0.0173 0.0265 0.423 0.515
Table 1. Summary of LME models of multivariate dispersion. Each subsection represents a distinct
community dissimilarity metric (Jaccard, Bray–Curtis, and Raup-Crick, respectively). Predictor variables
included in the model are denoted in the Fixed effects column. All other columns detail model output
including denominator degrees of freedoms, Wald chi-square values, and p-values for each fixed effect.
Evaluation of the LMER models was conducted using type-II sum of squares.
animals died from SFD via the methods used here as no necropsies were conducted, however, this does sug-
gest that snakes with increasing pathogen loads are more likely to be in poor health. Pathogen load dynamics
are predicted to be an important factor in the persistence or extirpation of amphibian populations affected by
Chytridiomycosis43. Thus, further research into pathogen load dynamics is likely to be informative in under-
standing SFD outbreaks and for conservation management decisions. We acknowledge the elevated attrition
rate (6/11 inoculated and 4/7 sham snakes died prior to the end of the experiment) of Watersnakes in captiv-
ity (similar to Neuman-Lee et al., 2014) and suggest a larger sample size during future s tudies44. Wild-caught
Scientific Reports | (2022) 12:3078 | https://doi.org/10.1038/s41598-022-07042-5 5
Vol.:(0123456789)www.nature.com/scientificreports/
Figure 4. Inoculation results in changes to host microbiome composition which are partially explained
by differences in richness. Nonmetric multidimensional scaling (NMDS) ordinations representing host
microbiome composition of sham and inoculated snakes throughout the experiment measured using (a)
Jaccard, (b) Bray–Curtis, and (c) Raup-crick dissimilarity. Multiple indices were used in order to discern
patterns that were shared, or not, across indices. Differences in composition between sham and inoculated
treatments are indicated by ellipses (95% SE); time is represented by contours with lighter colors corresponding
to later sampling events (weeks). (a, b) The interaction of time and treatment group (PERMANOVA p-values
within each panel) was significantly predictive of composition for both the Jaccard and Bray–Curtis index,
suggesting that average composition of the host microbiome varied depending on treatment across time. (c) The
interaction term was not significantly predictive of community composition for the Raup-Crick metric, which
explicitly accounts for differences in composition that are likely to occur due to differences in richness alone.
Changes in richness following infection with O. ophidiicola may be a key mechanism resulting in alterations to
the host microbiome.
Fixed effects Degrees of freedom Sum of squares Partial R-squared Mean squares F-statistic P-value
Treatment 1 0.91 0.014 0.905 2.13 0.001
Time 1 1.34 0.021 0.13 3.15 0.001
Treatment*time 1 0.57 0.009 0.569 1.34 0.020
Jaccard
Mortality type 1 0.67 0.107 0.67 1.58 0.010
Residuals 139 58.99 0.944 0.43
Total 143 62.46 1.000
Treatment 1 1.04 0.019 1.042 2.79 0.001
Time 1 1.69 0.030 1.69 4.54 0.001
Treatment*time 1 0.54 0.010 0.539 1.44 0.038
Bray–Curtis
Mortality type 1 0.70 0.013 0.70 1.88 0.008
Residuals 139 51.83 0.929 0.38
Total 143 55.80 1.000
Treatment 1 2.01 0.062 2.014 11.31 0.001
Time 1 4.43 0.137 4.43 24.87 0.001
Treatment*time 1 0.27 0.009 0.268 1.58 0.307
Raup-Crick
Mortality type 1 0.90 0.028 0.90 5.08 0.008
Residuals 139 24.76 0.764 0.18
Total 143 32.39 1.000
Table 2. Summary of PERMANOVA models of multivariate centroid position. Each subsection represents
a distinct community dissimilarity metric (Jaccard, Bray–Curtis, and Raup-Crick respectively). Predictor
variables included in the model are denoted in the Fixed effects column. All other columns detail model
output, including F-statistics, partial R-squared, and p-values for each fixed effect.
Scientific Reports | (2022) 12:3078 | https://doi.org/10.1038/s41598-022-07042-5 6
Vol:.(1234567890)www.nature.com/scientificreports/
snakes were brought into standardized conditions in captivity to explicitly test for microbiome differences due
to disease while retaining biologically relevant microbial assemblages. This transition may have caused stress in
study snakes. Indeed, non-diseased snakes that died naturally had temporal patterns of microbial richness and
Shannon diversity similar to diseased snakes. However, our results are robust to the inclusion of mortality type
in the analyses (Supplementary Material, Figure S1). In a similar fashion to pathogen load, we were able to test
for temporal trends in the snake microbiome resulting from disease.
The microbiome is linked to host health, including processes of innate immunity17. Additionally, changes in
alpha diversity of the microbiome are associated with factors such as o besity45, the environment46, and disease47.
In this investigation, time was found to have a significant effect on OTU richness of pathogen inoculated, but
not control snakes. Assemblage richness is sensitive to many factors including ecological disturbance48. Two
factors suggest that ecological disturbance is a likely scenario to describe mechanistic interactions between skin
bacteria and O. ophidiicola. First, a relationship was only observed between time and richness for the O. ophidii-
cola inoculated group. Previous work has shown that skin disease acts as a disturbance to the host microbiome
resulting in changes to assemblage c omposition25. Second, the relationship between time (i.e., disease progres-
sion) and richness was concave for the O. ophidiicola inoculated group and absent for the sham control group.
While the relationship between disturbance and richness varies depending on the ecological context, a widely
accepted model relating these variables is the intermediate disturbance hypothesis. This hypothesis states that
increasing levels of disturbance will increase species richness until a threshold value is reached, after which,
species richness will d ecrease28. Our results are consistent with the intermediate disturbance hypothesis, as O.
ophidiicola acts as a disturbance to the host microbiome, and disease progression leads to an increase in the
magnitude of disturbance. It is likely this is a common process in host disturbed microbiomes, as pathogens are
known to result in alternative stable states in frog skin m icrobiomes49 in both lab and field e xperiments21, and
pathogens reduce the ability of the host or microbiome to regulate assemblage richness and/or c omposition50.
Previous observational studies of free-roaming snakes have demonstrated that the presence of O. ophidiicola
correlates with alterations in the composition of the epidermal microbiome22,23. In this experiment, we imple-
mented two traditional measures of community dissimilarity (Jaccard and Bray–Curtis) which are differentially
sensitive to the effect of rare taxa. We found a significant interaction effect on average community composition,
indicating that pathogen inoculation was predictive of host microbiome changes through time. We further
investigated this pattern by applying the Raup-Crick index to our dataset and found no significant effect of the
time × treatment interaction term on community composition. Together, these results suggest that differences
in assemblage composition between pathogen inoculated and sham control snakes are described by differences
in assemblage richness through t ime51.
To assess the relationship between disease progression and microbiome β-diversity we evaluated distance-
to-centroid values representing the degree of heterogeneity in microbiome composition. The inoculated snake
microbiome was found to have higher multivariate dispersion than sham snakes for both Jaccard and Bray–Curtis
dissimilarity indices, indicating greater microbiome heterogeneity in the presence of a fungal pathogen. Addition-
ally, multivariate dispersion of the Raup-Crick metric indicated that the sham snake microbiomes tended to be
less variable, whereas, the pathogen inoculated microbiome increased in variability over time. This increase in
dissimilarity occurred as microbial assemblage alpha diversity initially increased for diseased snakes, and then
the assemblages continued to differentiate as taxa were lost, and alpha diversity (richness and Shannon diversity)
decreased during advanced stages of disease progression. These changes were associated with decreased micro-
bial assemblage evenness, indicating that some taxa became dominant, while others became rare through time.
Our results indicate that disease progression generates increasing variability in host-microbiome composition
even under conditions where the environmental microbial reservoir is similar. This suggests that fungal disease
progression may be related to an increase in stochastic community assembly processes, such as drift, which can
increase beta-diversity in the reptile m icrobiome52 as has been proposed in other animal microbiome s ystems50.
Wildlife diseases are an active area of research for understanding host-microbiome-pathogen interactions.
This experiment has shown that the application of disturbance ecology can be useful in interpreting the effects
of disease processes on the microbiome. We found that disturbance to the host microbiome occurred as a
result of disease; causing alterations in alpha diversity. Our results show that O. ophidiicola alters the measured
composition of the host microbiome throughout infection, but these changes are driven primarily by differ-
ences in richness, between healthy and diseased snakes. We found that SFD results in increased variability in
the host microbiome with potential consequences for host health. We demonstrate that disruption of the host
microbiome by a fungal pathogen is associated with host-health outcomes and changes to the host-associated
epidermal microbiome. Given the growing threat of EIDs to wildlife in the twenty-first century, developing an
increased understanding of the relationship between disease and microbiome ecology is crucial to inform effec-
tive conservation strategies.
Methods
Snake and soil collection. The Common Watersnake (Nerodia sipedon) is a nonvenomous semi-aquatic
snake found throughout Eastern and Central North A merica53. We collected 22 N. sipedon in Tennessee during
spring 2019. Any animal from the sham control group that had a positive qPCR reaction (Ct < 39) throughout
the experiment (n = 4) was removed from all statistical analyses. Study snakes had a mean snout-vent length
(SVL) of 28.4 cm and a mean mass of 11.4 g (Supplementary Material, Table S1). Study snakes were primarily
neonates or juveniles with 15 of 18 animals having an SVL less than 25 cm (Supplementary Material, Table S1).
We used nitrile gloves while handling snakes to prevent transmission of microbes between animals. We collected
snakes free of clinical signs, to control for initial disease state, and further confirmed absence of O. ophidii-
cola using quantitative PCR (qPCR) of skin s wabs54. We collected soil from snake capture locations to create a
Scientific Reports | (2022) 12:3078 | https://doi.org/10.1038/s41598-022-07042-5 7
Vol.:(0123456789)www.nature.com/scientificreports/
pseudo-naturalistic environmental reservoir of microbes. We collected a two-liter bag of soil three meters away
from the closest riverbank of each snake capture location. As with snake samples, we confirmed the absence of
O. ophidiicola in soil samples via qPCR. We stored soil samples at 4 °C in darkness in a bag that allowed for gas
exchange but conserved moisture until mesocosm construction.
Mesocosm design and animal care. Throughout the experiment, snakes were maintained individually
in 66.24 L plastic storage totes (66 × 34 × 41 cm) with ventilation holes. We used a soil/aspen substrate mixture
to provide an environmental reservoir of microbes. Specifically, equal parts, by weight, of each soil sample were
mixed for 15 min until homogeneous. We combined this soil mixture with autoclaved aspen shavings in a 2:1
soil to aspen ratio by weight. We evenly layered this substrate into snake enclosures in a ~ 6 cm deep layer. When
soiled, substrate was spot cleaned and replaced completely whenever snakes spilled large amounts of water.
Snake enclosures had a hide box, autoclaved climbing branch, and water dish. Enclosures were located in a 23 °C
room with a 12-h light/dark cycle. Depending on animal size, snakes were offered as many Guppies (Poecilia
reticulata; small snakes; < 35 cm SVL) or Platies (Xiphophorus maculatus; large snakes; > 35 cm SVL) as they
would consume weekly.
Live animal trials. The experiment began on 31 May 2019 and concluded on 21 August 2019. Eleven snakes
were randomly assigned to both the inoculation treatment and sham control groups. The snakes in the treatment
group were inoculated with O. ophidiicola using the following procedure: A culture of O. ophidiicola was grown
on Sabouraud dextrose agar (SDA) for 15 days and sectioned into 0.5 c m2 blocks then placed, mycelium side up,
onto a waterproof bandage. Similar to Lorch et al. (2015), #150 sandpaper was used to abrade, via five strokes,
the dorsal ventral and neck surface of the skin of each snake. Bandages with O. ophidiicola agar blocks were
placed on each abrasion site to inoculate the skin for 72 h before being removed. Animals in the sham control
group received the same treatment although sterile SDA blocks were applied to the bandages. Every seven days,
samples were collected of the epidermal microbiome for all study snakes. Aseptic technique was used whenever
work was conducted in and around the mesocosms to ensure that O. ophidiicola and other microbes were not
transferred between enclosures. The swabbing protocol used to collect microbial samples involved wetting a
rayon-tipped sterile applicator (Puritan 10808-146; VWR) with Millipore water that had been autoclaved for
two hours. The applicator was then rolled using a stroking motion over a 15 cm portion of the snake’s midbody
15 times to standardize the sampled grain size22,55. All swab samples were stored at -20 °C until DNA extraction.
This study was completed under IACUC MTSU-19-3012 approval and carried out according to relevant animal
care and ARRIVE guidelines.
Quantifying pathogen load. DNA was extracted from swab samples using the DNeasy PowerSoil kit
(Qiagen) per the manufacturer’s protocol (n = 144 total samples). On each 96 well plate, a single DNA control
blank was extracted to filter out contamination during qPCR and bioinformatic analyses. Pathogen load was
measured using qPCR of the ITS gene marker of O. ophidiicola54. Quantitative PCR reactions and criteria for
detection of positive samples followed the methods described in Walker et al.22. To determine pathogen load
within each sample, a serial dilution of 1–1 × 10¹⁰ copies of a synthetic DNA fragment representing the qPCR
target sequence (gBlock; Integrated DNA Technologies) was used to generate a standard curve.
Amplicon sequencing and bioinformatics. To characterize microbial assemblages, a 250 bp region of
the 16S rRNA marker was PCR amplified using primers 515F and 806R56. Amplicons were dual indexed fol-
lowing Fadrosh et al.57. Indexed amplicons were selected based on fragment size to remove adapter dimers
using HighPrep magnetic beads (MagBio Genomics). The concentration of each library was quantified using
a Quantus fluorometer (Promega), normalized, and pooled before sequencing on the Illumina MiSeq platform
(2 × 250 bp paired end reads). Mothur v1.43.0 was used to conduct bioinformatic analyses according to the MiSeq
SOP58,59 with several modifications. After forming contigs, screen.seqs was used to remove primers and barcodes.
Sequences with a minimum of 248 bp and maximum length of 256 bp were then selected for downstream analy-
sis. Sequences with ambiguous base calls and homopolymers greater than eight were removed from the data set.
Remaining sequences were aligned to the SILVA v132 reference a lignment60,61. The data were denoised using
pre.cluster to merge sequences with two or fewer nucleotide differences. The chimera.vsearch command was
used to remove chimeric sequences using the parameter ‘template = self ’. Sequences identified as chloroplast,
mitochondria, unknown, Archaea or Eukarya were removed from the dataset. Sequences were clustered into
operational taxonomic units (OTUs) at 97% similarity using the cluster.split command. OTUs identified in nega-
tive control sequencing blanks (1602 total OTUs) were removed from the final data set. Rare OTUs (< 5) were
removed using the remove.rare command and ‘bygroup = T’ option to remove any OTU that had fewer than the
threshold sequences (< 5) on a per sample basis. Rarefaction of assemblages, based on total sequence reads, is
typically conducted on a per sample basis in order to normalize ‘sampling effort’ across s amples62. Therefore, we
subsampled our data at 1102 sequence reads to generate a final rarefied abundance dataset that was imported
into R v3.6.3 for statistical analysis63.
Analysis of pathogen load. Analysis of qPCR data was restricted to positive samples from the inoculated
treatment group. This allowed us to test hypotheses regarding changes in pathogen load. Specifically, we tested if
time before an inoculated animal experienced mortality (natural or euthanasia) was predictive of O. ophidiicola
copy number (fungal load). Modeling was accomplished using linear mixed effects models in nlme. We natural
log transformed the copy number data to meet model assumptions of normality. We included days prior to mor-
tality, mortality type (natural or euthanasia), and their interaction as fixed effects. Snake identity was included
Scientific Reports | (2022) 12:3078 | https://doi.org/10.1038/s41598-022-07042-5 8
Vol:.(1234567890)www.nature.com/scientificreports/
as a random effect and log copy number as the response variable. Death was defined as the date at which an
individual experienced mortality over the clinical trial or was euthanized because the experiment concluded.
Model fit was characterized using manual review of model residuals. Model selection was performed using
Akaike Information Criterion (AIC) to determine if the inclusion of a random effect, temporal autocorrelation,
and/or unequal variance term was appropriate64. A model was considered superior to another model iteration if
the associated AIC value of that model was > 2 below the less complex model. In instances where there was not a
difference of > 2, the simpler model was selected.
We also tested for the effect of experimental time on pathogen load. For this model, we included experimental
time, mortality type, and their interaction as fixed effect terms, whereas log copy number was the response vari-
able. Snake identity was included as a random effect. Model selection was performed as described above. Neither
a temporal autocorrelation nor unequal variance term was indicated for inclusion in either model. Analysis of
variance with type-II sum of squares (Wald χ2 statistics; car package) was used to determine the significance of
the fixed effects while accounting for unequal sample sizes among snakes due to differential m ortality65.
Analysis of alpha diversity. We employed a generalized additive mixed effects model, via the function
gam from the software package mgcv, to test if time had linear or non-linear effects on the richness of the host
microbiome. Our model formula specified richness as the response variable. Time, treatment group, and mortal-
ity type (natural or euthanasia) were designated as fixed effects. The effect of time was modeled separately for
each treatment group. Basis complexity (k) was limited to four to prevent model overfitting66. Random effects
were specified using the ‘bs = re’ argument to the smoothing function. Akaike Information Criterion values were
used to determine the most efficient random effects structure, distribution function, transformation link, and if
the inclusion of a temporal autocorrelation term was a ppropriate64. Shannon-diversity (H) was calculated using
the diversity function with the argument “index = shannon” in vegan. We then used a generalized additive mixed
effects model in the same manner described above. Shannon-evenness index (E) was calculated by computing
the exponential function (ex) of an assemblage’s Shannon-diversity and dividing that by the assemblage’s OTU
richness67. In the same manner as the other diversity metrics, a generalized additive mixed effects model was
used to make inferences regarding this metric. Since four of seven sham control snakes died during the experi-
ment, we generated generalized additive mixed effects models in order to determine the effect of time on alpha
diversity, according to mortality type (natural or euthanasia) within the sham treatment group. More specifically,
we generated three models corresponding to each of the measures of alpha diversity examined in this study:
OTU richness, Shannon diversity, and Shannon evenness. In each model, a measure of alpha diversity was speci-
fied as the response variable. Time and mortality type (natural or euthanasia) were designated as fixed effects.
The effect of time was modeled as a smooth term separately for each level of mortality type. Basis complexity (k)
was limited to four to prevent model overfitting. Random effects were specified using the ‘bs = re’ argument to
the smoothing function. The function gam.check from the package mgcv was used to ensure that sufficient basis
complexity was supplied to all fixed effects terms. Restricted maximum likelihood was used to estimate smooth-
ing parameters by specifying “REML” to the method argument. Stepwise AIC selection, as described above, was
used to determine inclusion of a random effect, alternative distribution, and/or temporal autocorrelation terms.
Analysis of β‑diversity. We applied the Jaccard, Bray–Curtis, and Raup-Crick dissimilarity indices metric
to our dataset using the functions vegdist and raupcrick from the package vegan. The Jaccard index treats com-
positional data as presence/absence, and therefore, rare species have a greater effect on measured dissimilarity51.
The Bray–Curtis index accounts for species abundance, and therefore, rare species have less of an effect on meas-
ured dissimilarity51. The Raup-Crick metric is a presence/absence community dissimilarity metric, which gener-
ates a null expectation for the number of shared species between communities by relating global site occupancy
of taxa to local site occupancy probabilities, and then accounting for sampling bias likely to occur due to differ-
ences in richness between sites38. Using this metric, one is able to explicitly account for differences in richness on
measured community d issimilarity38. The function betadisper in vegan was used to generate distance-to-centroid
values for each of these community dissimilarity metrics. Communities were grouped by the interaction of
experimental time and treatment group. Thus, a multivariate centroid against which distance-to-centroid values
can be calculated was created for each treatment group separately at all time points. Distance-to-centroid values
were then evaluated using linear mixed effects modeling with the function lme from the package nlme. Distance-
to-centroid values for each dissimilarity metric were used as the response variable while the fixed effects struc-
ture of all three models consisted of treatment group, time, their interaction, and mortality type. Stepwise AIC
selection, as described above, was used to determine if the inclusion of a random effect, temporal autocorrela-
tion, and/or unequal variance term was appropriate. An analysis of variance with type-II sum of squares (Wald
χ2 statistics; car package) was used to determine the significance of the fixed effects. A post-hoc assessment of
any significant interaction terms was performed using the gls function from nlme. For post-hoc assessments,
each treatment group was modeled independently to determine the relationship between multivariate disper-
sion and time on a per treatment basis.
Analysis of assemblage composition. The function adonis in vegan was used to conduct Permutational
Multivariate Analysis of Variance on distance matrices generated via the dissimilarity metrics above. The speci-
fied fixed effect terms included treatment group, time, their interaction, and mortality type. A statistically sig-
nificant interaction term would indicate average microbiome composition of each treatment group changed in
a disparate fashion through time. For all adonis models, animal ID was specified as a grouping variable (using
“strata = ”) to constrain permutations and account for repeated measures (see Supplementary Material, Methods
Section for additional detail on all methods).
Scientific Reports | (2022) 12:3078 | https://doi.org/10.1038/s41598-022-07042-5 9
Vol.:(0123456789)www.nature.com/scientificreports/
Data availability
The R code and data frame to reproduce the above analysis are included within the Supplemental Material. Raw
data are available through the corresponding author upon request.
Received: 6 October 2021; Accepted: 7 February 2022
References
1. Daszak, P., Cunningham, A. A. & Hyatt, A. D. Emerging infectious diseases of wildlife: threats to biodiversity and human health.
Science 287, 443–449 (2000).
2. Pedersen, A. B., Jones, K. E., Nunn, C. L. & Altizer, S. Infectious diseases and extinction risk in wild mammals. Conserv. Biol. 21,
1269–1279 (2007).
3. Smith, K. F., Sax, D. F. & Lafferty, K. D. Evidence for the role of infectious disease in species extinction and endangerment. Conserv.
Biol. 20, 1349–1357 (2006).
4. Fisher, M. C. et al. Emerging fungal threats to animal, plant and ecosystem health. Nature 484, 186–194 (2012).
5. Paré, J. A. & Sigler, L. An overview of reptile fungal pathogens in the genera Nannizziopsis, Paranannizziopsis, and Ophidiomyces.
J. Herpetol. Med. Surg. 26, 46–53 (2016).
6. Warnecke, L. et al. Inoculation of bats with European Geomyces destructans supports the novel pathogen hypothesis for the origin
of white-nose syndrome. Proc. Natl. Acad. Sci. 109, 6999–7003 (2012).
7. Skerratt, L. F. et al. Spread of chytridiomycosis has caused the rapid global decline and extinction of frogs. EcoHealth 4, 125 (2007).
8. Franklinos, L. H. V. et al. Emerging fungal pathogen Ophidiomyces ophiodiicola in wild European snakes. Sci. Rep. 7, 3844 (2017).
9. Lorch, J. M. et al. Snake fungal disease: an emerging threat to wild snakes. Philos. Trans. R. Soc. B Biol. Sci. 371, 20150457 (2016).
10. Bustos, M. L., Nicolás Sánchez, M., Peichoto, M. E. & Teibler, G. P. First report of fungal disease in a South American snake. Rev.
Investig. Vet. Perú 29, 1036–1042 (2018).
11. Sun, P.-L. et al. Infection with Nannizziopsis guarroi and Ophidiomyces ophiodiicola in reptiles in Taiwan. Transbound. Emerg. Dis.
https://doi.org/10.1111/tbed.14049 (2021).
12. Haynes, E. et al. First report of ophidiomycosis in a free-ranging California kingsnake (Lampropeltis californiae) in California,
USA. J. Wildl. Dis. 57, 246–249 (2021).
13. Takami, Y. et al. First report of ophidiomycosis in Asia caused by Ophidiomyces ophiodiicola in captive snakes in Japan. J. Vet. Med.
Sci. 83, 1234–1239 (2021).
14. Lorch, J. M. et al. Experimental infection of snakes with Ophidiomyces ophiodiicola causes pathological changes that typify snake
fungal disease. MBio 6, e01534 (2015).
15. Koenig, J. E. et al. Succession of microbial consortia in the developing infant gut microbiome. Proc. Natl. Acad. Sci. 108, 4578–4585
(2011).
16. Huttenhower, C. et al. Structure, function and diversity of the healthy human microbiome. Nature 486, 207–214 (2012).
17. Grice, E. A. & Segre, J. A. The skin microbiome. Nat. Rev. Microbiol. 9, 244–253 (2011).
18. Gall, C. A. et al. The bacterial microbiome of Dermacentor andersoni ticks influences pathogen susceptibility. ISME J. 10, 1846–1855
(2016).
19. Gould, A. L. et al. Microbiome interactions shape host fitness. Proc. Natl. Acad. Sci. 115, E11951–E11960 (2018).
20. Hanning, I. & Diaz-Sanchez, S. The functionality of the gastrointestinal microbiome in non-human animals. Microbiome 3, 51
(2015).
21. Jani, A. J. & Briggs, C. J. The pathogen Batrachochytrium dendrobatidis disturbs the frog skin microbiome during a natural epidemic
and experimental infection. Proc. Natl. Acad. Sci. 111, E5049–E5058 (2014).
22. Walker, D. M. et al. Variability in snake skin microbial assemblages across spatial scales and disease states. ISME J. 13, 2209–2222
(2019).
23. Allender, M. C., Baker, S., Britton, M. & Kent, A. D. Snake fungal disease alters skin bacterial and fungal diversity in an endangered
rattlesnake. Sci. Rep. 8, 12147 (2018).
24. Rykiel, E. J. Jr. Towards a definition of ecological disturbance. Aust. J. Ecol. 10, 361–365 (1985).
25. Kong, H. H. et al. Temporal shifts in the skin microbiome associated with disease flares and treatment in children with atopic
dermatitis. Genome Res. 22, 850–859 (2012).
26. Ferrenberg, S. et al. Changes in assembly processes in soil bacterial communities following a wildfire disturbance. ISME J. 7,
1102–1111 (2013).
27. Mackey, R. L. & Currie, D. J. The diversity–disturbance relationship: is it generally strong and peaked?. Ecology 82, 3479–3492
(2001).
28. Connell, J. H. Diversity in tropical rain forests and coral reefs: high diversity of trees and corals is maintained only in a nonequi-
librium state. Science 199, 1302–1310 (1978).
29. Guthrie, A. L., Knowles, S., Ballmann, A. E. & Lorch, J. M. Detection of snake fungal disease due to Ophidiomyces ophiodiicola in
Virginia, USA. J. Wildl. Dis. 52, 143–149 (2016).
30. Chandler, H. C. et al. Ophidiomycosis prevalence in Georgia’s eastern indigo snake (Drymarchon couperi) populations. PLoS ONE
14, e0218351 (2019).
31. Tetzlaff, S. J. et al. Snake fungal disease affects behavior of free-ranging massasauga rattlesnakes (Sistrurus catenatus). Herpetol.
Conserv. Biol. 12, 624–634 (2017).
32. Lind, C. M., McCoy, C. M. & Farrell, T. M. Tracking outcomes of snake fungal disease in free-ranging pygmy rattlesnakes (Sistrurus
miliarius). J. Wildl. Dis. 54, 352–356 (2018).
33. Lind, C. M., Lorch, J. M., Moore, I. T., Vernasco, B. J. & Farrell, T. M. Seasonal sex steroids indicate reproductive costs associated
with snake fungal disease. J. Zool. 307, 104–110 (2019).
34. McKenzie, J. M. et al. Field diagnostics and seasonality of Ophidiomyces ophiodiicola in wild snake populations. EcoHealth 16,
141–150 (2019).
35. McCoy, C. M., Lind, C. M. & Farrell, T. M. Environmental and physiological correlates of the severity of clinical signs of snake
fungal disease in a population of pigmy rattlesnakes, Sistrurus miliarius. Conserv. Physiol. 5, cow077 (2017).
36. Hill, A. J. et al. Common cutaneous bacteria isolated from snakes inhibit growth of Ophidiomyces ophiodiicola. EcoHealth 15,
109–120 (2018).
37. Baker, S. et al. Case definition and diagnostic testing for Snake Fungal Disease. Herpetol. Rev. 50, 279–285 (2019).
38. Chase, J. M., Kraft, N. J. B., Smith, K. G., Vellend, M. & Inouye, B. D. Using null models to disentangle variation in community
dissimilarity from variation in α-diversity. Ecosphere 2, art24 (2011).
39. Agugliaro, J., Lind, C. M., Lorch, J. M. & Farrell, T. M. An emerging fungal pathogen is associated with increased resting metabolic
rate and total evaporative water loss rate in a winter-active snake. Funct. Ecol. 34, 486–496 (2020).
40. Frick, W. F. et al. Pathogen dynamics during invasion and establishment of white-nose syndrome explain mechanisms of host
persistence. Ecology 98, 624–631 (2017).
Scientific Reports | (2022) 12:3078 | https://doi.org/10.1038/s41598-022-07042-5 10
Vol:.(1234567890)www.nature.com/scientificreports/
41. Gervasi, S. S., Hunt, E. G., Lowry, M. & Blaustein, A. R. Temporal patterns in immunity, infection load and disease susceptibility:
understanding the drivers of host responses in the amphibian-chytrid fungus system. Funct. Ecol. 28, 569–578 (2014).
42. Allender, M. C. et al. Development of snake fungal disease after experimental challenge with Ophidiomyces ophiodiicola in cot-
tonmouths (Agkistrodon piscivorous). PLoS ONE 10, e0140193 (2015).
43. Briggs, C. J., Knapp, R. A. & Vredenburg, V. T. Enzootic and epizootic dynamics of the chytrid fungal pathogen of amphibians.
Proc. Natl. Acad. Sci. 107, 9695–9700 (2010).
44. Neuman-Lee, L. A. et al. Assessing multiple endpoints of atrazine ingestion on gravid Northern Watersnakes (Nerodia sipedon)
and their offspring. Environ. Toxicol. 29, 1072–1082 (2014).
45. Turnbaugh, P. J. et al. A core gut microbiome in obese and lean twins. Nature 457, 480–484 (2009).
46. Kueneman, J. G. et al. Community richness of amphibian skin bacteria correlates with bioclimate at the global scale. Nat. Ecol.
Evol. 3, 381–389 (2019).
47. Manichanh, C. et al. Reduced diversity of faecal microbiota in Crohn’s disease revealed by a metagenomic approach. Gut 55,
205–211 (2006).
48. Murphy, G. E. P. & Romanuk, T. N. A meta-analysis of declines in local species richness from human disturbances. Ecol. Evol. 4,
91–103 (2014).
49. Jani, A. J. et al. The amphibian microbiome exhibits poor resilience following pathogen-induced disturbance. ISME J. 15, 1628–1640
(2021).
50. Zaneveld, J. R., McMinds, R. & Vega Thurber, R. Stress and stability: applying the Anna Karenina principle to animal microbiomes.
Nat. Microbiol. 2, 1–8 (2017).
51. Anderson, M. J. et al. Navigating the multiple meanings of β diversity: a roadmap for the practicing ecologist. Ecol. Lett. 14, 19–28
(2011).
52. Lankau, E. W., Hong, P.-Y. & Mackie, R. I. Ecological drift and local exposures drive enteric bacterial community differences within
species of Galápagos iguanas. Mol. Ecol. 21, 1779–1788 (2012).
53. Mebert, K. Good species despite massive hybridization: genetic research on the contact zone between the watersnakes Nerodia
sipedon and N. fasciata in the Carolinas, USA. Mol. Ecol. 17, 1918–1929 (2008).
54. Bohuski, E., Lorch, J. M., Griffin, K. M. & Blehert, D. S. TaqMan real-time polymerase chain reaction for detection of Ophidiomyces
ophiodiicola, the fungus associated with snake fungal disease. BMC Vet. Res. 11, 95 (2015).
55. Wiens, J. A. Spatial scaling in ecology. Funct. Ecol. 3, 385–397 (1989).
56. Caporaso, J. G. et al. Global patterns of 16S rRNA diversity at a depth of millions of sequences per sample. Proc. Natl. Acad. Sci.
108, 4516–4522 (2011).
57. Fadrosh, D. W. et al. An improved dual-indexing approach for multiplexed 16S rRNA gene sequencing on the Illumina MiSeq
platform. Microbiome 2, 6 (2014).
58. Schloss, P. D. et al. Introducing mothur: open-source, platform-independent, community-supported software for describing and
comparing microbial communities. Appl. Environ. Microbiol. 75, 7537–7541 (2009).
59. Kozich, J. J., Westcott, S. L., Baxter, N. T., Highlander, S. K. & Schloss, P. D. Development of a dual-index sequencing strategy and
curation pipeline for analyzing amplicon sequence data on the Miseq Illumina sequencing platform. Appl. Environ. Microbiol. 79,
5112–5120 (2013).
60. Quast, C. et al. The SILVA ribosomal RNA gene database project: improved data processing and web-based tools. Nucl. Acids Res.
41, D590–D596 (2013).
61. Yilmaz, P. et al. The SILVA and “All-species Living Tree Project (LTP)” taxonomic frameworks. Nucl. Acids Res. 42, D643–D648
(2014).
62. Weiss, S. et al. Normalization and microbial differential abundance strategies depend upon data characteristics. Microbiome 5, 27
(2017).
63. R Core Team. R: A language and environment for statistical computing. (R Foundation for Statistical Computing, 2021).
64. Bozdogan, H. Model selection and akaike’s information criterion (AIC): the general theory and its analytical extensions. Psycho-
metrika 52, 345–370 (1987).
65. Fox, J. & Weisberg, S. An R Companion to Applied Regression (SAGE Publications, Thousand Oaks, 2011).
66. Zuur, A., Ieno, E. N., Walker, N., Saveliev, A. A. & Smith, G. M. Mixed Effects Models and Extensions in Ecology with R (Springer,
2009).
67. Heip, C. A new index measuring evenness. J. Mar. Biol. Assoc. UK 54, 555–557 (1974).
Acknowledgements
We thank Dr. V. Cobb, Dr. B. Miller, Dr. M. Grisnik, Alejandro Grajal-Puche, Jackson West, and Emma Phipps
for their valuable input and assistance with this project. This study was completed under IACUC MTSU-19-3012
and funded by a USFWS State Wildlife Grant (#58209) to DMW.
Author contributions
A.S.R., K.M., and D.M.W. collected data, A.S.R. and D.M.W. ran bioinformatics analyses, A.S.R. and J.G. per-
formed statistical modeling, A.S.R. wrote the first draft of the manuscript, and all authors contributed substan-
tially to revisions.
Competing interests
The authors declare no competing interests.
Additional information
Supplementary Information The online version contains supplementary material available at https://doi.org/
10.1038/s41598-022-07042-5.
Correspondence and requests for materials should be addressed to D.M.W.
Reprints and permissions information is available at www.nature.com/reprints.
Publisher’s note Springer Nature remains neutral with regard to jurisdictional claims in published maps and
institutional affiliations.
Scientific Reports | (2022) 12:3078 | https://doi.org/10.1038/s41598-022-07042-5 11
Vol.:(0123456789)www.nature.com/scientificreports/
Open Access This article is licensed under a Creative Commons Attribution 4.0 International
License, which permits use, sharing, adaptation, distribution and reproduction in any medium or
format, as long as you give appropriate credit to the original author(s) and the source, provide a link to the
Creative Commons licence, and indicate if changes were made. The images or other third party material in this
article are included in the article’s Creative Commons licence, unless indicated otherwise in a credit line to the
material. If material is not included in the article’s Creative Commons licence and your intended use is not
permitted by statutory regulation or exceeds the permitted use, you will need to obtain permission directly from
the copyright holder. To view a copy of this licence, visit http://creativecommons.org/licenses/by/4.0/.
© The Author(s) 2022
Scientific Reports | (2022) 12:3078 | https://doi.org/10.1038/s41598-022-07042-5 12
Vol:.(1234567890)You can also read