HHS Public Access Author manuscript Lancet. Author manuscript; available in PMC 2019 January 29.
←
→
Page content transcription
If your browser does not render page correctly, please read the page content below
HHS Public Access
                                 Author manuscript
                                 Lancet. Author manuscript; available in PMC 2019 January 29.
Author Manuscript

                    Published in final edited form as:
                     Lancet. 2012 December 15; 380(9859): 2163–2196. doi:10.1016/S0140-6736(12)61729-2.

                    Years lived with disability (YLDs) for 1160 sequelae of 289
                    diseases and injuries 1990-2010: a systematic analysis for the
                    Global Burden of Disease Study 2010
                    A full list of authors and affiliations appears at the end of the article.

                    Summary
Author Manuscript

                         Background—Non-fatal health outcomes from diseases and injuries are a crucial consideration
                         in the promotion and monitoring of individual and population health. The Global Burden of
                         Disease (GBD) studies done in 1990 and 2000 have been the only studies to quantify non-fatal
                         health outcomes across an exhaustive set of disorders at the global and regional level. Neither
                         effort quantified uncertainty in prevalence or years lived with disability (YLDs).

                    ‡
                     Correspondence to: Prof Christopher J L Murray, Institute for Health Metrics and Evaluation, University of Washington, 2301 Fifth
                    Avenue, Suite 600, Seattle, WA 98121, USA cjlm@uw.edu.
                    Contributors
                    CJLM, ADL, and TV prepared the first draft. TV, AF, MN, RL, CM, ME, KS, JS, ADL, and CJLM finalised the draft on the basis of
                    comments from all other authors and reviewer feedback. CJLM and ADL had the idea for the study and provided overall guidance. All
                    other authors developed cause-specific models, reviewed results, provided guidance on the selection of key covariates, and reviewed
                    the paper.
Author Manuscript

                    Conflicts of interest
                    C E Canter has worked as an Optum Health consultant, Blue Cross Blue Shield consultant, and received Berlin Heart Honoraria and
                    travel fees. E R Dorsey has received payments for consulting services from Lundbeck and Medtronic and research support from
                    Lundbeck and Prana Biotechnology. T Driscoll was supported in part by funding from the National Occupational Health and Safety
                    Commission (now Safework Australia). M Ezzati chaired a session and gave a talk at the World Cardiology Congress (WCC), with
                    travel cost reimbursed by the World Heart Federation. At the WCC, he also gave a talk at a session organised by PepsiCo with no
                    financial or other remuneration. F Guillemin did a study on osteoarthritis epidemiology in an institution that received grants from
                    public sources: Assurance-Maladie (CNAMTS) InVS, Inserm, CHU de Nancy, CHU de Nice, Conseil Regional de Lorraine, Societe
                    Francaise de Negma-Lerads, Pfizer, Pierre Fabre Medicaments, Sanofi-Aventis France. H J Hoffman is a US Federal Government
                    employee of the National Institutes of Health (NIH). P J Hotez reports holding several positions: Dean, National School of Tropical
                    Medicine, Baylor College of Medicine; Director, Sabin Vaccine Institute Texas Children’s Hospital Center for Vaccine Development;
                    and President, Sabin Vaccine Institute. He also is an inventor on several patents: 5,527,937 “Hookworm Anticoagulant”; 5,753,787
                    “Nucleic Acids for Ancylostoma Secreted Proteins”; 7,303,752 B2 “Hookworm vaccine”; 12/492,734 “Human Hookworm Vaccine”;
                    61/077,256 “Multivalent Anthelminthic Vaccine”; and PCT-20100701/0.20.5.18 “Malaria Transmission blocking vaccine”. G A
                    Mensah is a former employee of PepsiCo. F Perez-Ruiz was an advisor for Ardea, Menarini, Novartis, Metabolex; was a member of
                    the Speaker’s Bureau for Menarini, Novartis; an advisor for educational issues for Savient; led investigation grants for the Spanish
                    Health Ministry, Hospital de Cruces Rheumatology Association; and was principal investigator in clinical trials for Ardea. G V
                    Polanczyk has served as a speaker or consultant to Eli-Lily, Novartis, Janssen-Cilag, and Shire Pharmaceuticals, developed educational
Author Manuscript

                    material for Janssen-Cilag, and received an independent investigator grant from Novartis and from the National Council for Scientific
                    and Technological Development (CNPq, Brazil). L Rushton received honorarium for board membership of the European Centre for
                    Ecotoxicology and Toxicology of Chemicals and received research grants to Imperial College London (as PI) from the European
                    Chemical Industry Council (CEFIC) and CONCAWE (Conservation of Clean Air and Water Europe). J A Singh has received research
                    grants from Takeda and Savient and consultant fees from Savient, Takeda, Ardea, Regeneron, Allergan, URL pharmaceuticals, and
                    Novartis. J A Singh is a member of the executive of OMERACT, an organisation that develops outcome measures in rheumatology and
                    receives arms-length funding from 36 companies; a member of the American College of Rheumatology’s Guidelines Subcommittee of
                    the Quality of Care Committee; and a member of the Veterans Affairs Rheumatology Field Advisory Committee. J A Singh is
                    supported by research grants from the National Institutes of Arthritis, Musculoskeletal and Skin Diseases (NIAMS), National Institute
                    on Aging (NIA), National Cancer Institute (NCI) and the Agency for Health Quality and Research Center for Education and Research
                    on Therapeutics (CERTs) and is also supported by the resources and the use of facilities at the VA Medical Center at Birmingham,
                    Alabama, USA.
                    *Authors listed alphabetically
                    †Joint senior authors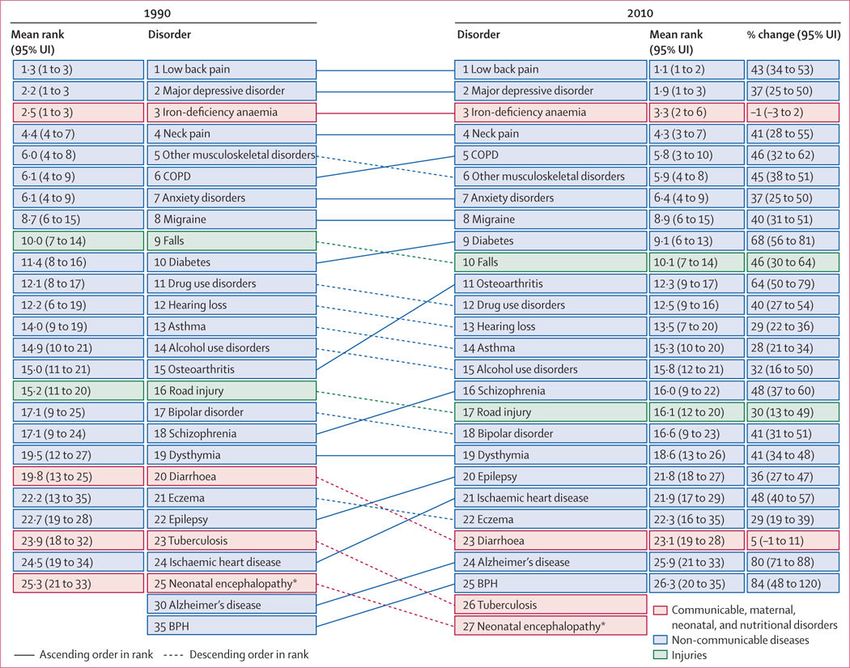
Vos et al.                                                                                                         Page 2

                                 Methods—Of the 291 diseases and injuries in the GBD cause list, 289 cause disability. For 1160
Author Manuscript

                                 sequelae of the 289 diseases and injuries, we undertook a systematic analysis of prevalence,
                                 incidence, remission, duration, and excess mortality. Sources included published studies, case
                                 notification, population-based cancer registries, other disease registries, antenatal clinic
                                 serosurveillance, hospital discharge data, ambulatory care data, household surveys, other surveys,
                                 and cohort studies. For most sequelae, we used a Bayesian meta-regression method, DisMod-MR,
                                 designed to address key limitations in descriptive epidemiological data, including missing data,
                                 inconsistency, and large methodological variation between data sources. For some disorders, we
                                 used natural history models, geospatial models, back-calculation models (models calculating
                                 incidence from population mortality rates and case fatality), or registration completeness models
                                 (models adjusting for incomplete registration with health-system access and other covariates).
                                 Disability weights for 220 unique health states were used to capture the severity of health loss.
                                 YLDs by cause at age, sex, country, and year levels were adjusted for comorbidity with simulation
Author Manuscript

                                 methods. We included uncertainty estimates at all stages of the analysis.

                                 Findings—Global prevalence for all ages combined in 2010 across the 1160 sequelae ranged
                                 from fewer than one case per 1 million people to 350 000 cases per 1 million people. Prevalence
                                 and severity of health loss were weakly correlated (correlation coeffi cient –0·37). In 2010, there
                                 were 777 million YLDs from all causes, up from 583 million in 1990. The main contributors to
                                 global YLDs were mental and behavioural disorders, musculoskeletal disorders, and diabetes or
                                 endocrine diseases. The leading specific causes of YLDs were much the same in 2010 as they
                                 were in 1990: low back pain, major depressive disorder, iron-deficiency anaemia, neck pain,
                                 chronic obstructive pulmonary disease, anxiety disorders, migraine, diabetes, and falls. Age-
                                 specific prevalence of YLDs increased with age in all regions and has decreased slightly from
                                 1990 to 2010. Regional patterns of the leading causes of YLDs were more similar compared with
                                 years of life lost due to premature mortality. Neglected tropical diseases, HIV/AIDS, tuberculosis,
Author Manuscript

                                 malaria, and anaemia were important causes of YLDs in sub-Saharan Africa.

                                 Interpretation—Rates of YLDs per 100 000 people have remained largely constant over time but
                                 rise steadily with age. Population growth and ageing have increased YLD numbers and crude rates
                                 over the past two decades. Prevalences of the most common causes of YLDs, such as mental and
                                 behavioural disorders and musculoskeletal disorders, have not decreased. Health systems will need
                                 to address the needs of the rising numbers of individuals with a range of disorders that largely
                                 cause disability but not mortality. Quantifi cation of the burden of non-fatal health outcomes will
                                 be crucial to understand how well health systems are responding to these challenges. Effective and
                                 affordable strategies to deal with this rising burden are an urgent priority for health systems in
                                 most parts of the world.

                                 Funding—Bill & Melinda Gates Foundation.
Author Manuscript

                        Introduction
                                           Non-fatal health outcomes from diseases and injuries are a crucial consideration in the
                                           promotion and monitoring of individual and population health. In an era in which the
                                           Millennium Development Goals (MDGs) have refocused global health attention on
                                           prevention of mortality from selected disorders, it is important to emphasise that health is
                                           about more than avoiding death. Individuals, households, and health systems devote

                                                  Lancet. Author manuscript; available in PMC 2019 January 29.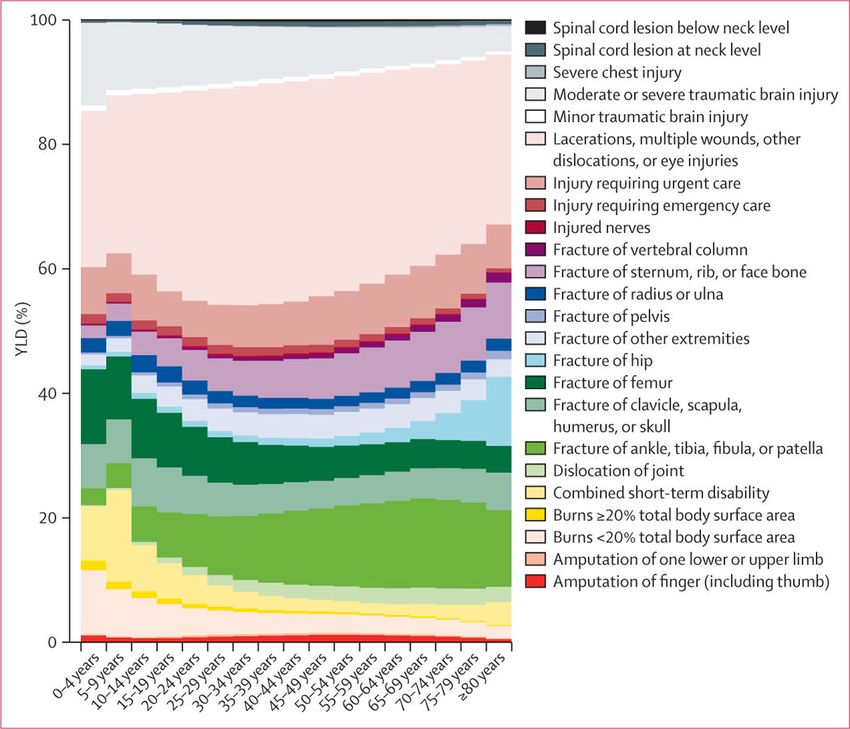
Vos et al.                                                                                             Page 3

                                 enormous resources to the cure, prevention, and amelioration of non-fatal sequelae of
Author Manuscript

                                 diseases and injuries. Some form of periodic accounting about the burden of non-fatal illness
                                 in populations, and how it is changing, should therefore be available for policy making and
                                 planning. Quantification of the burden of non-fatal health outcomes was one of the main
                                 goals in launching the Global Burden of Disease study (GBD) in the 1990s.1 The study
                                 introduced the disability-adjusted life-year (DALY) as a time-based measure of health that
                                 enables commensurable measurement of years of life lost due to premature mortality (YLLs)
                                 with years of life lived in less than ideal health (years lived with disability [YLDs]). The
                                 amalgamation of both components of individual and population health under a
                                 comprehensive framework for measuring population health can provide important insights
                                 into a broader set of causes of disease burden than can consideration of mortality alone.

                                 To our knowledge, the various revisions of the GBD are the only effort to quantify non-fatal
                                 health outcomes across an exhaustive set of disorders at the global and regional level.2‒8
Author Manuscript

                                 Many national burden of disease studies and subnational studies have analysed local patterns
                                 of YLDs as well.9‒16 Publication of the GBD 1990 results raised awareness about a range of
                                 disorders that primarily cause ill health and not death, such as unipolar major depression,
                                 bipolar disorder, asthma, and osteoarthritis.17‒19 This attention has led to greater policy
                                 debate and action on mental health and other non-communicable diseases at WHO,4,20,21 in
                                 non–governmental organisations, and in many countries.22 The burden of non-fatal illness
                                 attributed to some parasitic diseases has also been an important issue highlighted by the
                                 GBD findings.23‒26

                                 Despite the unique role of the GBD in provision of comparative quantification of the burden
                                 of non-fatal health outcomes, there have been important limitations. The evidence on MDG-
                                 related diseases has been regularly revised and incorporated into updates of the GBD, but
Author Manuscript

                                 many disorders have not been systematically analysed since 1990. Global Health Statistics, a
                                 companion volume to the original Global Burden of Disease and Injuries book, provided
                                 estimates of incidence, prevalence, remission, and case fatality for 483 sequelae, by age and
                                 sex, for eight regions of the world.27 The GBD 2000 revisions included 474 sequelae. A
                                 substantial number, but not all, of these sequelae were revised since GBD 1990. Those that
                                 were not revised were approximated with constant relations between YLLs and YLDs or
                                 YLD rates estimated from the GBD 1990. Even when revisions were undertaken, however,
                                 many were not based on systematic analyses of published studies and unpublished sources.
                                 The epidemiological inputs to YLD estimates such as prevalence have been released for only
                                 40 sequelae. The most important limitation of both the GBD 1990 and 2000 efforts is that
                                 YLDs have not been estimated with uncertainty. Uncertainty can come from many sources,
                                 including heterogeneity in the empirical data that are available and uncertainty in the indirect
Author Manuscript

                                 estimation models used to make predictions for populations with little or no data. Because
                                 the empirical basis for estimating prevalence or incidence is much weaker for some sequelae
                                 than it is for others, uncertainty is likely to vary substantially across sequelae and across
                                 countries and regions for the same sequelae.8,28

                                 The Global Burden of Diseases, Injuries, and Risk Factors Study 2010 (GBD 2010)
                                 provided an important opportunity to address the key limitations of past burden of disease
                                 assessments, including a more standardised approach to evidence synthesis, epidemiological

                                        Lancet. Author manuscript; available in PMC 2019 January 29.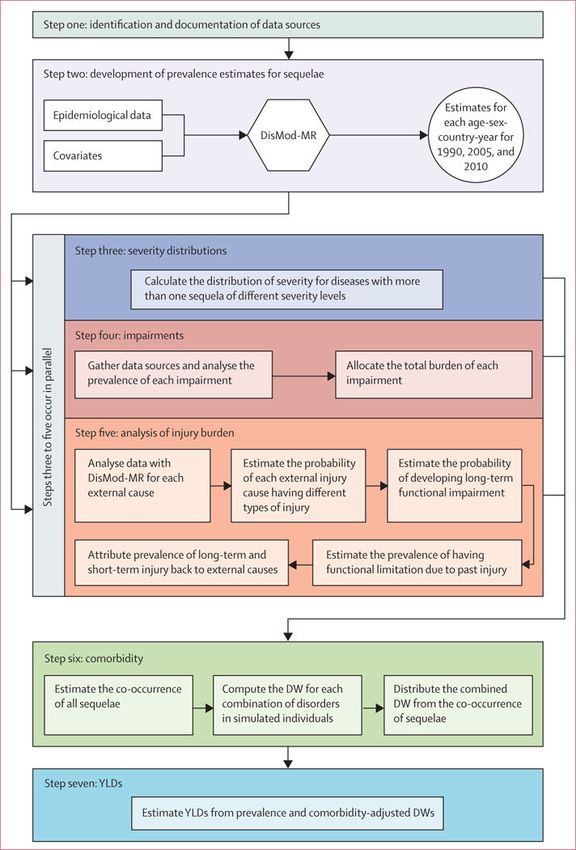
Vos et al.                                                                                              Page 4

                                   estimation with uncertainty, and assessment of comorbidity. In this Article, we describe the
Author Manuscript

                                   approach to undertaking these analyses with the available evidence, and discuss key
                                   comparative results. Subsequent disease-specific and injury-specific papers are planned that
                                   will provide much more detail on data, methods, and results for various disorders of interest.

                        Methods
                        Overview
                                   Details of the GBD 2010 hierarchical cause list, the 21 epidemiological regions (and
                                   combinations of these into seven super-regions), the 20 age groups, and the relation between
                                   different components of GBD 2010 are published elsewhere.29 For the GBD 2010, YLDs are
                                   computed as the prevalence of a sequela multiplied by the disability weight for that sequela
                                   without age weighting or discounting. The YLDs arising from a disease or injury are the
                                   sum of the YLDs for each of the sequelae associated with that disease. Across the 291
Author Manuscript

                                   diseases and injury causes in the study, 289 cause disability—for these causes there were
                                   1160 sequelae that captured the major outcomes of these diseases and injuries.29,30 The key
                                   analytical task for the study was to estimate the prevalence with uncertainty of each of the
                                   1160 sequelae for 20 age groups, both sexes, and 21 regions for 1990, 2005, and 2010. See
                                   panel for terminology used in GBD 2010.

                                   For each disease or injury, we identified the key sequelae from that cause. Sequelae could
                                   include the disease itself, such as diabetes, or the outcomes associated with that disease such
                                   as diabetic foot, neuropathy, or retinopathy. Some clinical disorders were classified as a
                                   disease but also can be a consequence of another disease—eg, chronic kidney disease
                                   secondary to diabetes is a consequence of diabetes but was classified as a disease. Any given
                                   outcome appears in the GBD cause and sequela list only once to avoid double counting of
Author Manuscript

                                   the associated burden. Across the 1160 sequelae, we identified 220 unique health states,
                                   representing a parsimonious list providing enough detail to describe the large variations
                                   between health states while still a manageable number for which we were able to derive
                                   disability weights by survey. In principle, we estimated YLDs at the level of an individual
                                   and then assigned individual health loss to all the contributing sequelae present in an
                                   individual. The analysis can be divided into seven specific steps (figure 1) which are briefly
                                   described below.

                                   Identification and documentation of data sources—The analysis for each sequela
                                   began with the identification and documentation of sources of data for incidence, prevalence,
                                   remission, duration, and excess mortality. We used nine types of data sources. First,
                                   contributors to the GBD have undertaken systematic reviews for disease sequelae. For
Author Manuscript

                                   example, for epilepsy we retrieved: 230 prevalence studies from 83 countries in all 21 world
                                   regions, a further 97 studies of incidence, 25 studies of the mortality risk in people with
                                   epilepsy, and only one study on remission meeting inclusion criteria. For other disease
                                   sequelae, only a small fraction of the existing data appear in the published literature, and
                                   other sources predominate such as local surveys of schistosomiasis prevalence or antenatal
                                   clinic serosurveillance for HIV/AIDS. Second, reports to governments of cases have been
                                   used for African trypanosomiasis, measles, pertussis, tuberculosis, leprosy, dengue, cholera,

                                          Lancet. Author manuscript; available in PMC 2019 January 29.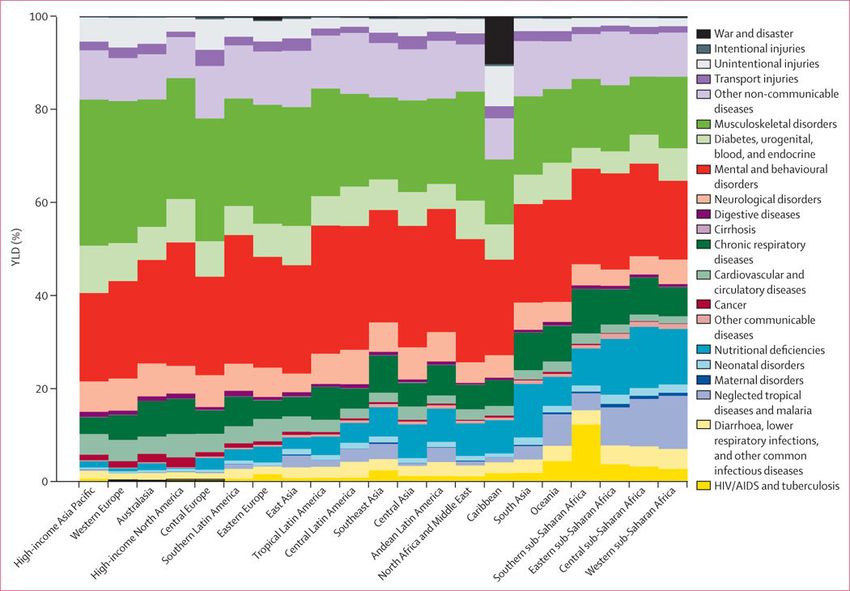
Vos et al.                                                                                               Page 5

                                 and yellow fever. Use of these data for burden of disease assessment required explicit
Author Manuscript

                                 modelling of the case detection rate for every disease. Third, we used population-based
                                 disease registry data for cancers,32‒40 chronic kidney diseases, multiple sclerosis,41
                                 Parkinson’s disease,42,43 and congenital anomalies.44 Cancer registries have been
                                 established in many developed countries and are being rapidly established in developing
                                 countries. For example, by the end of 2010, cancer registries had expanded in China to 149
                                 registries covering 31 provinces;45 India now has 23 registries.46 Fourth, many countries, in
                                 collaboration with UNAIDS and WHO, have established networks of antenatal clinics that
                                 test women presenting for antenatal care for HIV, syphilis, and other disorders. Fifth, for 43
                                 countries, we obtained hospital discharge data coded to ICD9 or ICD10. Use of these data
                                 required an explicit model of selection bias to take into account variations in access to care.
                                 Additionally, for chronic diseases, we had to estimate the average number of admissions to
                                 hospital per person per year with a disease to interpret the results. We analysed datasets with
Author Manuscript

                                 unique identifiers for every patient for seven US states from 2003 to 2007 for cirrhosis and
                                 pneumoconiosis. Hospital discharge data were an important source for acute disorders such
                                 as stroke, myocardial infarction, appendicitis, or pancreatitis, and for injuries. Sixth, for skin
                                 diseases and other mental and behavioural disorders, outpatient data collected in health
                                 systems with nearly complete or at least representative samples of ambulatory data47‒55
                                 have also been used after taking into account selection bias. Seventh, we used interview
                                 questions, direct measurements (eg, hearing, vision, and lung function testing), serological
                                 measurements, and anthropometry from the re-analysis of multiple household surveys.
                                 Surveys of selected populations such as school children for intellectual disability,56 nursing
                                 home residents for dementia,57 or mental health clinic attendees for schizo-phrenia58 have
                                 also been used after taking into consideration selection bias. Eighth, re-analysis of cohort or
                                 follow-up studies has been used for some causes such as impairment due to injury. We also
                                 used cohort studies to provide information about remission rates, duration, and mortality
Author Manuscript

                                 risks for many chronic disorders. Finally, we used indirect prevalence studies as an input to
                                 estimate the total number of drug users.59 These estimates were produced from a
                                 combination of multiplier, capture-recapture, and back- projection methods combining data
                                 from treatment centres, police records, court records, and survey data.

                                 Developing prevalence estimates for sequelae—Meta-analysis or meta-regression
                                 of descriptive epidemiological studies60‒63 poses many challenges. First, for many regions
                                 and for many sequelae data are scarce. Predictions of prevalence need to take advantage of
                                 relations with covariates in a meta-regression or default to the average of a region, super-
                                 region, or the world. Second, in settings with multiple measurements, study results can be
                                 highly heterogeneous because of much non-sampling error. Sources of non-sampling error
                                 include selection bias in the population studied, study design, implementation issues in data
Author Manuscript

                                 collection, widely varying case definitions across studies, and the use of different diagnostic
                                 technologies or laboratory techniques. Third, available studies have often used diverse age
                                 groups like 17–38 years or 15 years and above. Fourth, data for various disorders were
                                 collected for many different outcomes such as incidence, prevalence, remission, excess
                                 mortality, or cause-specific mortality. The mix of data varies across diseases and across
                                 regions for a disease. All of these sources provide some relevant information for the
                                 estimation of prevalence. Fifth, within regions or countries, the true prevalence of a sequela

                                        Lancet. Author manuscript; available in PMC 2019 January 29.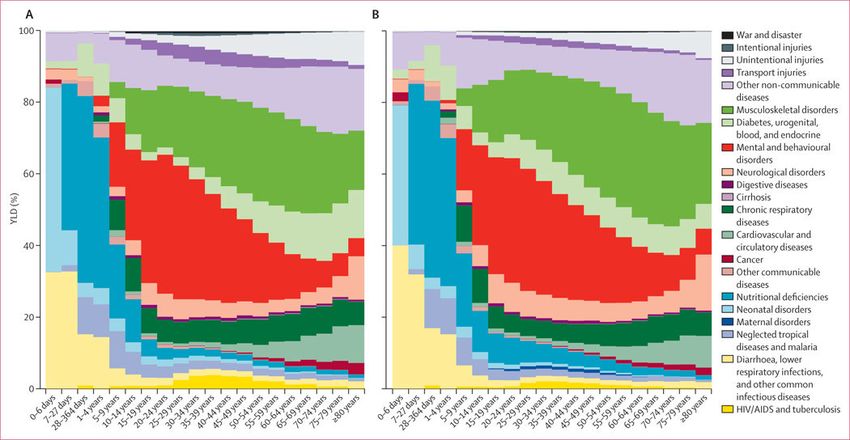
Vos et al.                                                                                            Page 6

                                 can vary enormously. Sixth, on the basis of biology or clinical series, there might be strong
Author Manuscript

                                 prior views on the age pattern of incidence or prevalence for a disorder that should be
                                 reflected in the results. For instance, we would not expect prevalence of Alzheimer’s disease
                                 before age 40 years and diagnostic rules stipulate that the onset of attention deficit and
                                 hyperactivity disorder cannot occur before age 4 years or after age 8 years.64

                                 To address these challenges, we have developed a Bayesian meta-regression method,
                                 DisMod-MR, which estimates a generalised negative binomial model for all epidemioiogical
                                 data. The model includes the following: covariates that predict variation in true rates;
                                 covariates that predict variation across studies because of measurement bias; super-region,
                                 region, and country random intercepts; and age-specific fixed effects. When appropriate, the
                                 rates were assumed to have been constant over time, which allowed data for incidence,
                                 prevalence, excess mortality, and cause-specific mortality to inform prevalence estimates.
                                 The differential equations governing the relation between the parameters of incidence,
Author Manuscript

                                 remission, mortality, prevalence, and duration are well charac-terised.65,66 DisMod-MR can
                                 use data reported for any age group to inform the maximum likelihood estimate. We used a
                                 large set of 179 covariates that have been appropriately imputed so that the data provide a
                                 complete time series for all 187 countries in the analysis (see the appendix for details of the
                                 estimation equations used for DisMod-MR and the approach to numerical solution, as well
                                 as an example of its application).29

                                 For cancer incidence and prevalence, we used the approach applied by Forouzanfar and
                                 colleagues67 to breast and cervical cancers. We estimated the mortality- to-incidence ratio
                                 for each cancer for all country, age, and sex groups using data from all high-quality
                                 registries that reported on both incidence and mortality. We developed separate models for
                                 both sexes. Cause of death estimates for each cancer by country, year, age, and sex68 were
Author Manuscript

                                 divided by the predicted mortality-to-incidence ratio to generate incidence estimates. To
                                 estimate the prevalence of each of four sequelae of cancer including: diagnosis or treatment
                                 phase, remission, recurrence, and terminal phase, we estimated the natural history of
                                 incident cases using a calculated 5 year survival and relative duration of each cancer phase.
                                 We also used a variant of this approach to estimate incidence and prevalence for visceral
                                 leishmaniasis.

                                 We used four sets of alternative methods for some disorders because of variation in the types
                                 of data available and the complexity of their spatial and temporal distributions (see appendix
                                 for further details). For HIV/ AIDS, we used the UNAIDS natural history model developed
                                 with the Spectrum platform.69,70 Detailed estimates of prevalence and mortality with
                                 uncertainty by age and sex have been provided based on the 2012 revision of HIV/AIDS
Author Manuscript

                                 epidemiology. We developed natural history models for measles and pertussis. For
                                 ascariasis, trichuriasis, hookworm, and schistosomiasis, prevalence of the disease has been
                                 estimated with geospatial estimation methods.71‒73 For diphtheria, tetanus, and rabies, we
                                 have used systematic reviews of data for case-fatality rates with estimates of mortality to
                                 estimate incidence—the mortality estimates for these diseases are described elsewhere.68
                                 For these disorders, DisMod-MR was used as a meta-regression method to estimate the case-
                                 fatality rate by age, sex, and region. For tuberculosis and dengue, the key source of
                                 information was registered cases. We developed statistical models that simultaneously model

                                        Lancet. Author manuscript; available in PMC 2019 January 29.
Vos et al.                                                                                             Page 7

                                 the expected rates as a function of covariates and the undercount of cases as a function of
Author Manuscript

                                 health system access.

                                 Severity distributions—For 41 diseases, the sequelae of the disease have been linked to
                                 more than one health state including stroke, anxiety, major depressive disorder, symptomatic
                                 heart failure, and chronic obstructive pulmonary disease (COPD). After analysing the
                                 prevalence of the overall disorder, we estimated the distribution of these prevalent cases
                                 across severity levels. Disability weights were measured in population surveys30 for
                                 individuals without comorbidity. Two estimates are needed to calculate YLDs: the disability
                                 weight for individuals with a single sequela and the disability weight for individuals with
                                 multiple sequelae, which is a common occurrence. The prevalence of comorbid disorders
                                 can be estimated with micro-simulation. However, we needed to estimate the distribution of
                                 severity controlling for comorbidity, otherwise the severity distribution would be
                                 systematically biased towards more severe symptoms caused by comorbidity. For example,
Author Manuscript

                                 if individuals with depression are also likely to have anxiety and substance-use disorders, the
                                 reported distribution of functional health status would be shifted towards the more severe
                                 end.

                                 Data for severity distributions are often scarcer and of poorer quality than are data for
                                 prevalence of disorders, with some exceptions.74,75 Approaches to severity classification are
                                 inconsistent across disorders.76 Because of the heterogeneity of the available evidence for
                                 disease severity, we supplemented disease specific reviews with an analysis of three data
                                 sources: the US Medical Expenditure Panel Survey (MEPS) 2000–09,77 the US National
                                 Epidemiological Survey on Alcohol and Related Conditions (NESARC) 2000–01 and 2004–
                                 05,78 and the Australian National Survey of Mental Health and Wellbeing of Adults (AHS)
                                 1997.79 These sources allow the assessment of the severity distributions taking into account
Author Manuscript

                                 co morbidity (see appendix for more details of this analysis). For some diseases for which
                                 data are available for the distribution of severity by age, sex, and region, we pooled
                                 proportions in each health state using DisMod-MR or simple meta-analysis methods.

                                 Impairments—For selected impairments, we have constrained the estimates for sequelae
                                 related to that impairment to sum to estimates of the impairment prevalence from
                                 independent sources of data. For example, nine dis orders have blindness as a sequela. We
                                 have analysed all available blindness survey data and we constrain the prevalence of all
                                 blindness sequelae to sum to blindness prevalence. We did this impairment prevalence
                                 analysis for anaemia, blindness, low vision, hearing impairment, infertility, heart failure,
                                 epilepsy, and intellectual disability (appendix).
Author Manuscript

                                 Analysis of injury burden—The analysis of YLDs from injuries needed careful
                                 consideration because injuries are classified in the cause list according to the external cause
                                 such as a road injury, animal bite, or drowning, whereas the functional limitations after
                                 injury are determined by the nature of injury such as brain trauma, femur fracture, or spinal
                                 cord transection. We did the injuries analysis in five steps, which are briefly outlined here
                                 with further details in the appendix. First, we analysed household survey and hospital
                                 discharge data using DisMod-MR for each external cause to generate estimates of incidence
                                 by age, sex, country, and year. Survey data included recall of injuries warranting admission

                                        Lancet. Author manuscript; available in PMC 2019 January 29.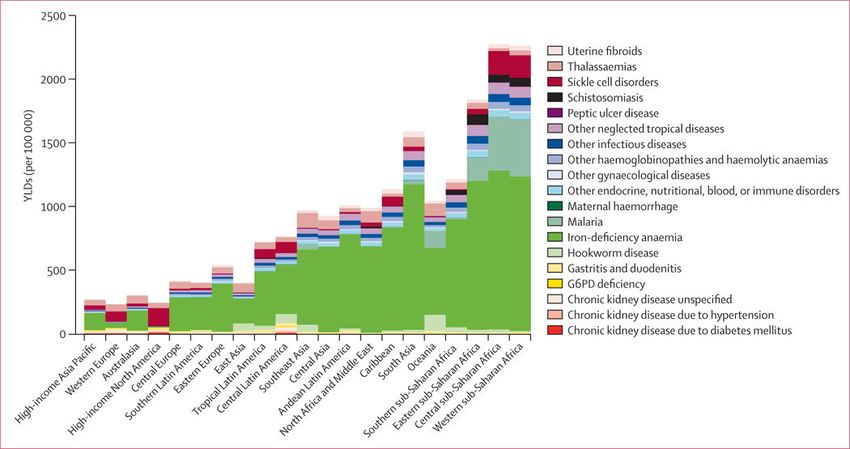
Vos et al.                                                                                            Page 8

                                 to hospital as well as injuries that warranted medical attention but not admission to hospital.
Author Manuscript

                                 The metaregression included a covariate for whether an individual was admitted to hospital
                                 or not, which we used to generate predictions both for injury warranting hospital admission
                                 and injury warranting outpatient care. Second, we analysed hospital data from 28 countries
                                 that had dual coding of discharges by external cause and nature of injury after ICD9 and
                                 ICD10, using negative binomial models to estimate the probability of different groups of
                                 nature of injury as a function of age, sex, and an indicator variable for developed versus
                                 developing countries. Separate models were created for injury warranting hospital admission
                                 and injury warranting other health care. Third, for each nature of injury we estimated the
                                 probability of individuals developing long-term functional impairment. We re-analysed
                                 follow-up data from four studies using data from the Dutch Injury Surveillance system
                                 (LIS),80 the South Carolina Traumatic Brain Injury Follow-up Registry (SCTBIFR),81 the
                                 National Study on Costs and Outcomes of Trauma (NSCOT),82 and MEPS.77 Fourth, we
Author Manuscript

                                 used DisMod-MR to estimate the prevalence of individuals in the population who are likely
                                 to have functional limitation because of a previous injury. Prevalence was estimated from
                                 incidence assuming zero remission and a relative risk of death compared with the general
                                 population based on available studies. In the fifth step, the YLDs due to prevalent cases of
                                 long-term injury were attributed back to external causes in proportion with the contributions
                                 of these causes to every type of injury.

                                 Comorbidity—Comorbidity was taken into account in the calculation of YLDs, which
                                 needed three analytical steps (appendix). First, we estimated the co-occurrence of all the
                                 sequelae for each age, sex, country, and year. Co-occurrence is a function of the prevalence
                                 of each sequela and whether the probabilities of co-occurrence are independent of, or
                                 dependent on, each other.83 We could not identify sufficiently large datasets to estimate
                                 these dependent probabilities reliably within age groups. We therefore adopted the
Author Manuscript

                                 simplifying assumption of independence. For each age-sex-country-year, we used a Monte
                                 Carlo simulation of 20 000 individuals to estimate the cooccurrence of sequelae. To capture
                                 uncertainty in the prevalences of each of the sequelae, for each age-sex- country-year, we
                                 ran 1000 different micro-simulations of 20 000 individuals.

                                 Second, we calculated the combined disability weight for the estimated individuals with
                                 every combination of disorders. For all combinations of disorders generated in the micro-
                                 simulation, the combined disability weight for a simulated individual with two or more
                                 disorders is one minus the product of one minus each disability weight. Tests on real data
                                 such as MEPS as well as other studies suggest that this multiplicative model was the most
                                 appropriate.84,85 To propagate uncertainty in disability weights into the YLD estimates, each
                                 computation was based on a draw from the uncertainty distribution of each disability weight.
Author Manuscript

                                 Third, the combined disability weight from the co-occurrence of sequelae was apportioned
                                 to each of the contributing sequelae in proportion to the disability weight of a sequela on its
                                 own.

                                 We tested the validity of our assumption of independence within an age-sex-country-year
                                 using the MEPS data (described above), which includes both individual-level measurement
                                 of functional status using SF‒12 and ICD‒ coded diagnoses. We applied the GBD
                                 approach assuming multiplicative disability weights and independent disorder probabilities

                                        Lancet. Author manuscript; available in PMC 2019 January 29.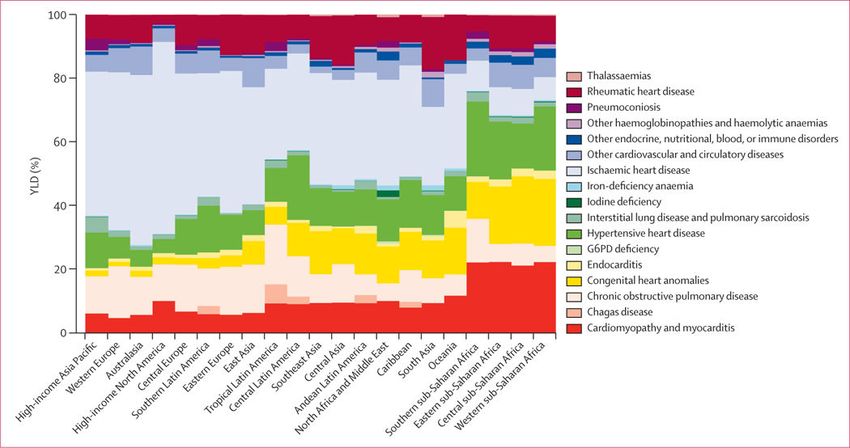
Vos et al.                                                                                                 Page 9

                                    to estimate YLDs and we computed directly from the MEPS data taking into account actual
Author Manuscript

                                    comorbid patterns at the individual level. The correlation coefficient for the two approaches
                                    was 0.999.

                        YLDs from residual categories
                                    There are nine causes on the cause list such as other neglected tropical diseases, other
                                    neurological disorders, or other congenital anomalies that are groupings of a large number of
                                    often rare disorders. We approximate the YLDs for these disorders using the ratio of YLDs
                                    to YLLs for similar or related disorders to then estimate YLDs for these residual categories
                                    from YLLs that have been directly estimated.68

                        Ranking lists
                                    For the presentation of leading causes of YLDs, the level at which causes are ranked is
Author Manuscript

                                    subject to debate. We have opted to use the level of disaggregation that seems most relevant
                                    for public health decision making. For example, we have chosen to include diarrhoeal
                                    diseases, lower respiratory infections, maternal disorders, stroke, liver cancer, cirrhosis, drug
                                    use, road injury, exposure to mechanical forces, animal contact, interpersonal violence, and
                                    congenital anomalies in the ranking list.

                        Decomposing changes in YLDs into demographic and epidemiological factors
                                    To help understand the drivers of change in the number of YLDs by cause or region, we
                                    have estimated the proportion of the change from 1990 to 2010 due to growth in total
                                    population, change in population age-structure and sexstructure, and change in age-specifi c
                                    and sex-specifi c rates. We computed two counterfactual sets of YLDs. First, a population
                                    growth scenario computed as the number of YLDs expected in 2010 if only total population
Author Manuscript

                                    numbers increased to the level of 2010 but the age-sex structure of population stayed the
                                    same as in 1990 and age-sex specifi c rates remained at 1990 levels. Second, a popu lation
                                    growth and population ageing scenario computed as the number of YLDs expected in 2010,
                                    using 1990 age-specifi c and sex-specifi c rates and 2010 age-specifi c and sexspecific
                                    population numbers. The diff erence between 1990 numbers and the population growth
                                    scenario is the change in YLDs due strictly to the growth in total population. The change
                                    from the population growth scenario to the population growth and ageing scenario is the
                                    number of YLDs due to ageing of the population. The diff erence between 2010 YLDs and
                                    the population growth and ageing scenario is the difference in YLDs due to epidemiological
                                    change in age-specific and sex-specific YLDs per person. Each of these three differences is
                                    also presented as a percentage change with reference to the 1990 YLD estimate. Further
                                    details about the data and methods used for specific causes of YLDs are available on request
Author Manuscript

                                    from the corresponding author.

                        Role of the funding source
                                    The sponsor of the study had no role in study design, data collection, data analysis, data
                                    interpretation, or writing of the report. The corresponding author had full access to all of the
                                    data in the study and the final responsibility to submit for publication.

                                           Lancet. Author manuscript; available in PMC 2019 January 29.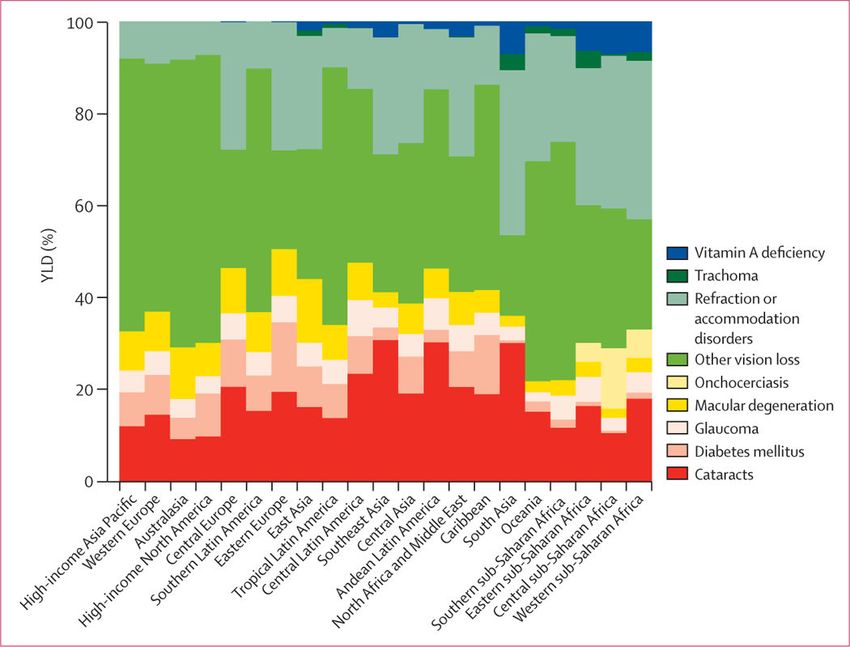
Vos et al.                                                                                            Page 10

                        Results
Author Manuscript

                                  Global prevalence for all ages combined in 2010 across the 1160 sequelae varied from fewer
                                  than one case per 1 million people to 350 000 cases per 1 million people. 58 sequelae each
                                  affected more than 1% of the global population. Table 1 shows the global prevalence of the
                                  50 most common sequelae in 2010. Of these sequelae, four were oral health disorders
                                  (dental caries of permanent teeth, chronic periodontitis, dental caries of baby teeth, and
                                  edentulism). Four skin diseases were also very common: fungal skin disease, acne vulgaris,
                                  pruritus, and eczema; collectively these disorders affected 2·1 billion individuals (table 1).
                                  The number of individuals affected by tension-type headaches or migraine was also very
                                  large—these neurological causes respectively ranked as the second and third most common.
                                  Low back pain, neck pain, other musculoskeletal, and osteoarthritis of the knee were also
                                  very common (table 1). Hearing loss affected 1·3 billion people and vision loss affected 661
                                  million people. Two mental and behavioural disorders, anxiety and major depressive
Author Manuscript

                                  disorder, were in the top 30 most common causes. Two respiratory disorders, COPD and
                                  asthma, were also highly prevalent. Although prevalences varied substantially across
                                  communities, iron-deficiency anaemia affected 14·9% and infection with schistosomiasis
                                  affected 3·5% of the world’s population. Five of the top 50 most common sequelae affected
                                  only one sex: genital prolapse, uterine fibroids, benign prostatic hyperplasia, premenstrual
                                  syndrome, and polycystic ovarian disease. Table 1, however, shows prevalences at the level
                                  of only sequelae and not at the level of disease or injuries. Disorders such as chronic kidney
                                  diseases (CKD) does not appear in the top 30 causes because, at the sequelae level, we have
                                  separate estimates for CKD from hypertension, CKD from diabetes, and CKD from other
                                  causes.

                                  We detected a huge range of severity across sequelae with similar prevalence when
Author Manuscript

                                  comparing prevalence rate per 100 000 individuals on a log scale for each sequela compared
                                  with the average disability weight (appendix p 36). In general, more severe disorders were
                                  less common than less severe disorders, but there were notable exceptions. The variation in
                                  prevalence across disorders extended by more than a factor of 100 000. A weak relation
                                  exists when the more common sequelae are milder than the less common sequelae
                                  (correlation coefficient –0·37). The lack of a strong association between prevalence and
                                  severity plus the substantial number of highly prevalent, but mild, disorders draws attention
                                  to why consideration of prevalence of disorders alone is insufficient in quantifying burden of
                                  disease. To understand which causes contribute the greatest burden, we need to take into
                                  account both prevalence and severity of the health states. The disability weights collected
                                  from the general public provide the mechanism by which the highly diverse set of sequelae
                                  can be compared by adjusting for severity.30
Author Manuscript

                                  In 2010, there were a total of 777 million YLDs globally, implying an average health loss of
                                  0·11 years per person. By sex, the YLD rate was 10 819 per 100 000 male individuals and 11
                                  755 per 100 000 female individuals, with female individuals accounting for 51·6% of all
                                  YLDs globally. Disaggregated into three broad cause groups, 15·3% of YLDs in 2010 were
                                  due to communicable, maternal, neonatal, and nutritional disorders, 78·6% to non-
                                  communicable diseases, and 6·1% to injuries. The heavy preponderance of YLDs from non-

                                         Lancet. Author manuscript; available in PMC 2019 January 29.
Vos et al. Page 11
communicable diseases is substantially different from the distribution of years of life lost
because of premature mortality (YLLs; 42·8%).68
Author Manuscript
We detected a characteristic pattern of the prevalence of disease adjusted for severity by age
and sex at the global level in 2010 (figure 2). This figure provides an analysis using the 21
mutually exclusive and collectively exhaustive cause categories at the second level in the
GBD cause list for male and female individuals. In children younger than 5 years, leading
causes of YLDs included neonatal disorders, nutritional deficiencies, diarrhoea, lower
respiratory infections, other infectious diseases, and neglected tropical diseases and malaria.
Beginning at age 10 years and extending to age 65 years, mental and behavioural disorders
were a major cause, contributing as much as 36% at age 20–29 years. Nearly as important
but with an older age distribution, the other dominant cause was musculoskeletal disorders.
The third most important factor in adults was other non-communicable diseases, which
includes congenital anomalies, skin diseases, sense organ disorders, and oral disorders
Author Manuscript
(figure 2). Diabetes, urogenital, blood, and endocrine diseases made a progressively larger
contribution with age. Neurological disorders (Alzheimer’s disease and Parkinson’s disease
in particular) started to make a major contribution in individuals aged 80 years or older.
Chronic respiratory disorders made a substantial contribution in individuals aged 10 years
and older, whereas cardiovascular diseases seemed progressively more important at older
ages. The long-term cumulative disability from unintentional injuries is also an important
factor. This age-sex pattern of the leading causes was very different from the pattern for
mortality by cause, which was dominated by causes such as cancers, cardiovascular diseases,
HIV and tuberculosis, diarrhoea, pneumonia, and other infectious diseases.68
The GBD 2010 includes the assessment of 1160 sequelae, of which 600 are 40 different
nature of injury sequelae (such as hip fracture or traumatic brain injury) for each of the 25
Author Manuscript
external causes of injury (such as falls or road injury). For simplicity of presentation, table 2
shows YLD estimates for all non-fatal health outcomes and some select groupings of
sequelae. For example, we estimated YLDs for mild, moderate, and severe anaemia from a
variety of causes but the table shows YLDs from all three forms of anaemia. For injuries we
show only the YLDs by external cause without giving details for each nature of injury.
Furthermore, we show results for both sexes combined for summary age groups (table 2) and
the full age and sex detail for 2010 and 1990 (appendix pp 37–270). A substantial number of
causes contribute to the overall YLDs at the global level (appendix pp 37–270). The leading
causes were low back pain, which contributed 10·7% of total YLDs, and major depressive
disorder, which contributed 8·1% of total YLDs. Within the broad category of
communicable, maternal, neonatal, and nutritional disorders, the most important causes of
YLDs included iron-deficiency anaemia, which accounted for 5·5% of all YLDs. Other
Author Manuscript
causes within this group that caused 4 million or more YLDs included tuberculosis, HIV,
diarrhoeal diseases, otitis media, malaria, intestinal nematodes, and neonatal disorders.
Several neglected tropical diseases caused between 1 million and 4 million YLDs, including
schistosomiasis, lymphatic filariasis, and food-borne trematodiases. Although major
contributors to YLLs, the entire list of cancers caused a total of 4·5 million YLDs.
Cardiovascular and circulatory diseases accounted for 2. 8% of all YLDs with ischaemic
heart disease and stroke accounting for 60% of the total for the cardiovascular category and
the rest distributed across a wide range of causes. Chronic respiratory diseases accounted for
Lancet. Author manuscript; available in PMC 2019 January 29.Vos et al. Page 12
6·3% of global YLDs with the largest contributor being COPD (29·4 million YLDs)
Author Manuscript
followed by asthma with 13·8 million YLDs. YLD rates for COPD have risen since 1990
whereas asthma rates have decreased marginally in this period. Neurological disorders
accounted for another 42·9 million YLDs—migraine accounted for more than half of these
YLDs.
Mental and behavioural disorders accounted for 22·7% of all YLDs. YLDs for the category
as a whole have increased by 37% from 1990 to 2010 from 129 million to 177 million and
rates have also increased slightly by 5% over the two decades (from 2440 per 100 000
people to 2564 per 100 000 people). Within this category, six disorders or clusters of
disorders accounted for more than 10 million YLDs each. The largest category was
depressive disorders: major depressive disorder caused 63 million YLDs and dysthymia
caused 11 million YLDs—together accounting for 9·6% of all YLDs. Schizophrenia, alcohol
use disorders, drug use disorders, and bipolar disorder accounted for 12·9–16·4 million
Author Manuscript
YLDs. Anxiety disorders were also a major global cause, contributing 3·5% of all YLDs.
Another important category of diseases causing YLDs was diabetes, urogenital, blood, and
endocrine diseases, which accounted for 56·9 million YLDs. Major causes included diabetes
mellitus (20·8 million YLDs), benign prostatic hyperplasia (6·8 million YLDs),
gynaecological disorders (10·0 million YLDs), and haemoglobinopathies and haemolytic
anaemias (10·2 million YLDs). Together, musculoskeletal disorders caused 21·3% of all
YLDs. The main contributors were low back pain (83·1 million YLDs), neck pain (33·6
million YLDs), osteoarthritis (17·1 million YLDs), and the other musculoskeletal category
(28·2 million YLDs). Osteoarthritis of the knee accounted for 83% of the total osteoarthritis
burden. We included the assessment of 13 separate skin diseases. Collectively they caused
33·7 million YLDs, with the largest cause being eczema followed by acne vulgaris. Many of
the skin diseases have low disability weights but because of very high prevalences, they still
Author Manuscript
accounted for a substantial number of YLDs. Oral disorders combined caused 15·0 million
YLDs, with about equal shares caused by dental caries, periodontal disease, and edentulism.
Injuries collectively caused 6·1% of global YLDs. Falls accounted for 41% of the total
YLDs caused by injuries. The other major contributors were road injuries, causing 13·5
million YLDs.
Between 1990 and 2010, the total number of YLDs increased by 194 million—a 33·3%
increase. We have decomposed this change into three components (table 3): growth in total
population, ageing of the global population, and changes in the YLD rates. We have
decomposed change both for YLDs from all causes and also for the three broad cause
groups. For YLDs from all causes, population growth alone led to a 30·1% increase in YLDs
and population ageing led to a further 10·9% increase in YLDs. Reductions in age-sex
Author Manuscript
specific prevalence rates would have reduced YLDs by 7·7%, leading to an overall increase
of about a third. Examination of change by the three broad groups shows distinct patterns.
Age-specific and sex-specific YLD rates for communicable, maternal, neonatal, and
nutritional disorders have decreased, and alone would have led to a 27·9% decrease in
YLDs. Overall, YLDs from this cluster of causes increased, slightly, by 4·6% because of
population growth, which increased more in the regions with the highest YLDs from these
causes. For non-communicable diseases, the overall increase has been 40·3%, but this
increase was driven by both population growth and population ageing, with very small
Lancet. Author manuscript; available in PMC 2019 January 29.Vos et al. Page 13
decreases in prevalence rates. For injuries we saw a similar pattern, except that the decrease
Author Manuscript
in age-sex specific rates would have caused a 9·1% decline.
For all causes of YLDs combined, the small decrease expected because of changes in age-
specific and sex- specific YLDs per person of 7·7% shown in table 3 can also be seen in
figure 3, which shows age-specific YLDs per person in 1990 and 2010 for both sexes.
Values in figure 3 can be interpreted as the fraction of health lost to short-term and long-term
disabling sequelae in each age group. As expected, the YLDs per person rose with age;
YLDs per person aged 5 years were 5·4%, rising to28·6% (28·2% for women; 29·4% for
men) for individuals aged 80 years. Female YLDs per person were higher than male YLDs
for individuals aged 10–60 years at the global level; the difference is highest for individuals
aged 30 years, when YLDs per woman were 1·4 percentage points higher than YLDs per
man. The decrease in overall YLDs per person over the 20 year period (between 1990 and
2010) was much smaller than the approximate 20% decrease in mortality.68
Author Manuscript
Faster rates of increase in YLDs for non-communicable diseases led to their share of total
YLDs increasing from 74·6% in 1990 to 78·6% in 2010. Causes are ordered by their mean
rank across 1000 draws. The order based on the mean rank across draws is not the same as
the order based on the mean value of YLDs. The 25 most common causes in 1990 and 2010
are shown in figure 4. Non-communicable diseases were the most common cause of YLDs
(figure 4); 21 of the 25 leading causes are from non-communicable diseases, up from 19 of
the 25 most common in 1990. The four leading causes in 2010 were also the four leading
causes in 1990: low back pain, major depressive disorder, iron-deficiency anaemia, and neck
pain. COPD increased from sixth to fifth, and anxiety and migraine retained the same
ranking as in 1990 (figure 4). Other notable changes over the time period include the drop in
the ranking of asthma, although the number of YLDs it caused increased by 28%. Road
Author Manuscript
injury YLDs also increased but to a lesser extent than the increase in many of the non-
communicable diseases, meaning that it also dropped in the rank list. We detected larger
decreases in the rank of diarrhoea and tuberculosis than the other 25 most common causes in
1990.
The appendix (pp 280–88) shows YLDs per person by age and sex for the 21 GBD regions
in 2010 and 1990. In general, in almost all age groups, the lowest YLDs per person were in
the high-income Asia Pacific and east Asia regions. Western Europe and Australasia had the
next lowest levels of YLDs per person, with rates of YLDs typically 10·15% lower than in
high-income North America for most age groups. We estimate that the highest levels of
YLDs per person were in the Caribbean, Oceania, and sub-Saharan Africa, particularly in
the age groups affected by HIV in southern sub-Saharan Africa. The ratio of YLDs per
Author Manuscript
person, comparing regions with the highest rates to the lowest rates, ranges from 9·71 in
post-neonatal boys to 1·39 in men aged 80 years or older. This range is much smaller than
we saw for YLLs across the same region-age-sex groups (the highest being 84·90 in male
individuals aged 1–4 years and the lowest being 2·04 in male individuals aged 80 years or
older).
Figure 5 shows how the broad composition of the causes of YLDs varied by region in 2010.
At the 21 cause-group level, which is level 2 in the GBD cause hierarchy,29 we detected a
Lancet. Author manuscript; available in PMC 2019 January 29.Vos et al. Page 14
clear association between the demographic and epidemiological transition. Mental and
Author Manuscript
behavioural, musculoskeletal, other non-communicable, and chronic respiratory causes were
consistently important in all regions. Some causes played a much more important part in
regions that are less advanced in the demographic and epidemiological transition as
measured by the mean age of death.86 HIV/AIDS and tuberculosis, neglected tropical
diseases, and nutritional deficiencies stand out as being the most variable. For example,
neglected tropical diseases and malaria ranged from 11·4% of total YLDs in western sub-
Saharan Africa to less than 0·01% in high- income North America. Injuries have made a
greater contribution to overall disability, in percentage terms, in those regions that are more
advanced in the demographic and epidemiological transition. The contribution of stroke and
diabetes, urogenital, blood, and endocrine diseases also increased with the demographic and
epidemiological transition. Cardiovascular diseases did not contribute more than 5% of
YLDs. The large fraction in the Caribbean attributable to war and disaster in 2010 is related
Author Manuscript
to the Haiti earthquake.
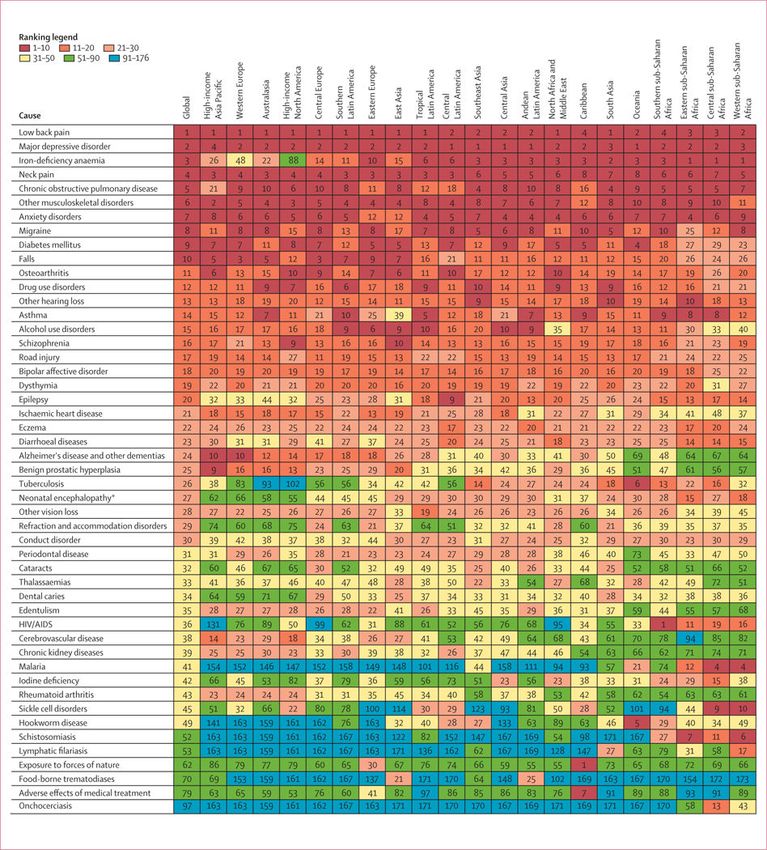
Figure 6 shows how the leading causes of YLDs varied by region in 2010. Causes were
included if they were in the 25 most common globally or in the 25 most common for any
region. By contrast with a similar analysis for YLLs,68 we recorded much consistency in the
ranking of causes of YLDs for the 15 most common causes, with the exception of iron-
deficiency anaemia, which was the third most common cause globally. Iron-deficiency
anaemia ranged from the most common cause in sub-Saharan Africa (western, eastern, and
cent ral) to the 88th most common cause in high-income North America. Other causes that
were highly variable across regions included malaria, cataracts, hookworm disease, sickle
cell anaemia, thalassaemia, lymphatic filariasis, onchocerciasis, and schistosomiasis. The
consistency of ranks for most major causes is related to the comparatively small variation in
the prevalence of major mental and behavioural disorders and musculoskeletal disorders
Author Manuscript
across different regions of the world.
Injuries accounted for a total of 47·2 million YLDs in 2010, up from 34·1 million in 1990.
Table 2 provides the results of YLDs for each external cause of injury (see appendix pp 37–
270 for more detailed results by age and sex). In terms of external causes, falls and road
injuries combined accounted for more than two-thirds (69·8%) of all YLDs due to injuries.
YLDs from injuries stem from the nature of the injury rather than the external cause. Figure
7 shows the global breakdown of the nature of injury by age. In terms of the nature of injury
that health services should address, 52·3% of YLDs were accounted for by the following:
lacerations, multiple wounds, other dislocations, and eye injuries; fractures of the patella,
fibula, tibia, or ankle; and moderate-to-severe traumatic brain injury. The number of YLDs
from lacerations, multiple wounds, other dislocations, and eye injuries stemmed from the
Author Manuscript
large numbers of people who had this type of injury and the evidence from follow-up studies
that some individuals have long-term decreases in functioning. More severe injuries such as
spinal cord injury are much less common according to the hospital and non-hospital data for
external cause and nature of injury, even though they have more severe long-term
consequences for individuals affected. The age pattern shows a slow rise by age of the
fraction of the nature of injury due to fractures of the sternum, face, and pelvis. The
percentage due to burns decreased with age as did moderate to severe brain trauma. (figure
7).
Lancet. Author manuscript; available in PMC 2019 January 29.Vos et al. Page 15
An important innovation in GBD 2010 was the assessment of selected impairments overall
Author Manuscript
as well as their attribution by cause. The results of the impairment analysis are not easily
discernible in table 2 because the burden is distributed across multiple disease or injury
sequelae. Anaemia was perhaps the most important of these disorders in terms of its overall
contribution to global YLDs. The burden of anaemia overall was large—68·2 million YLDs
or almost a tenth (8·8%) of all YLDs worldwide, showing the high prevalence as well as the
moderately severe disability weight especially for severe anaemia. By far the most important
contributor to this health loss was iron-deficiency anaemia, which accounted for 62·2% of
anaemia YLDs globally. However, our assessment of iron-deficiency anaemia was based on
the results of iron supplementation trials which by their nature will capture both iron
deficiency anaemia due to inadequate dietary intake but also some anaemia due to blood loss
that is iron sensitive. The second leading specific cause of anaemia YLDs was thalassaemia
(6·7% of total anaemia YLDs) followed by malaria (4·9%). Hookworm and sickle cell
Author Manuscript
anaemia together account for a further 7·2%. Figure 8 shows the YLD rate per 100 000
individuals across regions; YLD rates varied from nearly 2300 in central sub-Saharan Africa
to less than 300 in high-income North America. The cause composition of anaemia YLDs
also varied across regions. In sub-Saharan Africa, higher anaemia rates were caused mainly
by malaria, hookworm, schistosomiasis, sickle cell anaemia, and higher iron-deficiency
anaemia. South Asia had the highest rates after sub-Saharan Africa, with the largest
contributor being iron-deficiency anaemia. Although in absolute terms not a major cause of
global anaemia, chronic kidney diseases accounted for a substantial proportion of anaemia
burden in high-income regions.
Left-side and right-side heart failure was another impairment that was included in the GBD
cause-sequelae list in many locations. Worldwide, we recorded an estimated 37·7 million
cases of prevalent heart failure in 2010, leading to 4·2 million YLDs. This assessment of
Author Manuscript
heart failure includes only symptomatic heart failure and does not include the large number
of individuals with pre-symptomatic disease. For those with symptoms, the average
disability weight was 0·12, although severity varies widely between individuals. Heart
failure was distributed across 17 causes (figure 9). Slightly more than two-thirds (68·7%) of
heart failure globally was due to four causes: ischaemic heart disease, COPD, hypertensive
heart disease, and rheumatic heart disease. The pattern varied by region: ischaemic heart
disease and COPD caused proportionally more YLDs in developed regions, whereas
hypertensive heart disease, rheumatic heart disease, and cardiomyopathy and myocarditis
made a larger contribution in some developing regions.
Another important cause of global YLDs is blindness and low vision. Overall, visual
impairment accounted for 21·1 million YLDs or 2·7% of the global total. Figure 10 shows
Author Manuscript
the main causes of low vision and blindness. The largest global cause of YLDs from vision
impairment globally was other vision loss (mainly from trauma, occupational exposures, and
idiopathic disorders), which accounted for 29·5% of the total number of vision-loss YLDs.
Uncorrected refractive error was the second most common cause and accounted for 26·5%
of vision impairment. Cataracts were the third largest contributor (22·4% of vision-loss
YLDs). Glaucoma and macular degeneration together accounted for a further 10·7%, with
trachoma and onchocerciasis accounting for 2·1% of YLDs from vision loss in 2010. Most
blindness and low vision YLDs were in individuals aged 45 years or older. We recorded a
Lancet. Author manuscript; available in PMC 2019 January 29.You can also read