HAMILTON A COMMUNITY EXEMPLIFYING ONTARIO'S ROAD SAFETY - PEO
←
→
Page content transcription
If your browser does not render page correctly, please read the page content below
HAMILTON   A COMMUNITY EXEMPLIFYING ONTARIO’S ROAD SAFETY

Despite recent sensationalist news coverage to the
contrary, Ontario has one of the safest road networks
                                                            Hamilton, Ontario, is a city of contradictions. The city’s
in North America. Traffic and vehicular engineering
                                                            nearly 537,000 inhabitants occupy a geographically large
have allowed the number of fatalities and injuries on       area—over 1100 square kilometres—giving it a deceptively
Ontario’s roads to drop significantly in the past four      low density compared to other large cities in southern
                                                            Ontario. This, no doubt, is a result of the provincial govern-
decades, despite the exponential growth in vehicular        ment’s January 2001–imposed amalgamation of the former
traffic and population. We use Hamilton—a large             Regional Municipality of Hamilton-Wentworth with its six
Ontario city with significant urban and rural areas—        lower-tier municipalities, all of which had versatile char-
                                                            acteristics. The old city of Hamilton, as densely populated
to explore Ontario’s embrace of Vision Zero principles to   as parts of Toronto, was crisscrossed with one-way streets
bring even more safety to our roads.                        devoted to the car and was historically reliant on heavy
                                                            industry for jobs, while nearby Dundas was a bedroom com-
                                                            munity with a thriving arts scene; Flamborough, located on
                                                            the Niagara Escarpment, was largely agricultural and dis-
                                                            sected by the Bruce Trail; and Stoney Creek, located on Lake
                                                            Ontario near Niagara wine country, was a small town with
                                                            large portions devoted to fruit farms.
                                                                It’s been 18 years since amalgamation, and Hamilton is
                                                            still a city of contrasts. As recently as September 2018, the
                                                            Waterloo Region Record reported that “Dark pine forests
                                                            fringes with wildflowers are all you see on southbound
                                                            Highway 6 as the sign tells you you’re inside the city limits.

BY ADAM SIDSWORTH

34   Engineering Dimensions                                                                           January/February 2019
And for the next 20 kilometres, as farm and gas stations week-old baby. An 18-year-old passenger of the Ford
give way to light industry and garden centres, until you was also injured. The Ford’s driver was charged with
get to the tangle of highways at the edge of Lake Ontario, four counts of dangerous driving causing bodily harm.
Hamilton is a city that doesn’t look like a city.” But things
are changing: Hamilton is the country’s eighth-largest city. Although Ontario media, notably in urban areas, where
Its downtown core, long the sight of empty storefronts vehicles and vulnerable road users (notably pedestrians
and boarded-up windows, is now gentrifying, complete and bicyclists) interact more often, have recently focused
with a three-kilometre bike lane, improved lighting and on traffic safety and fatalities, Ontario is one of the saf-
beautifying projects and 20 proposed residential towers, est jurisdictions in North America. In 2015, the Ministry
some over 20 storeys. And former agricultural areas, such as of Transportation of Ontario (MTO) declared: “In 2014,
Waterdown and Flamborough, are witnessing quickly built Ontario’s fatality rate of 0.53 per 10,000 licensed drivers was
residential areas. The city has $1.3 billion in development, the lowest ever recorded in Ontario (matching a record low
and Metrolinx has sunk $100 million into a proposed $1 billion in 2011). It was the second lowest in all of North America,
light rapid transit line that will connect Stoney Creek, down- behind only Prince Edward Island. In 2014, the number of
town Hamilton and McMaster University. traffic fatalities on Ontario roads was 517, which is the
Hamilton’s urban, suburban and rural areas have unique second-lowest number of fatalities since 1944.”
traffic demands, no doubt presenting a challenging balance Consider that in its Ontario Road Safety Annual Report
between planning of traffic engineering and safety and 2014, MTO reported that:
future civic growth. Consider these recent headlines: • Between 1995 and 2014, the number of licensed dri-
• On February 7, 2017, the Ontario Provincial Police (OPP) vers grew by 37 per cent, yet fatalities in real numbers
reported that two people died after two vehicles col- dropped by 48 per cent;
lided in a deadly crash on Eastport Drive, just south of • There was a 75 per cent increase in large trucks regis-
the lift bridge near Burlington Bay, close to a heavily tered in Ontario between 1995 and 2014, yet by 2014,
industrial part of Hamilton. One vehicle struck a wall, they were responsible for 40 per cent less deaths;
rolled over and burst into flames. No causes were • Between 1995 and 2014, the number of pedestrian
reported. deaths from collisions dropped by 13 per cent, and seri-
• On November 9, 2018, a vehicle heading north on High- ous injuries dropped by 48 per cent; and
way 6, between Maddaugh Road and Gore Road, in a
rural part of Hamilton, rolled into the west ditch. The
lone male occupant had to be extricated. No causes
were reported.
• On September 15, 2018, in the community of Glan-
brook, five people were injured in a two-vehicle
collision. A 17-year-old driver of a stolen Ford vehicle
tried to pass another car by entering the oncoming
lane. The vehicle struck an oncoming Honda, injuring
its 29-year-old driver, her two-year-old child and three-
www.peo.on.ca Engineering Dimensions 35• By contrast, the number of fatalities from inattentive
driving increased by 85 per cent between 1995 and
2014, and the number of injuries from inattentive driv-
ing increased by 88 per cent. This may be due largely to
living in the era of the personal electronic device.
In 2014, vulnerable users resulted in a small minority of
injuries and deaths. There were 4053 pedestrian injuries and
110 pedestrian fatalities, and 1785 bicyclists injured and 16
bicyclists killed. Compare that to drivers and passengers,
who experienced 45,857 injuries and 322 deaths. However,
vulnerable road users, if hit, are more likely to sustain seri-
ous injury or death.
MTO has also released its Preliminary 2016 Ontario Road
Safety Annual Report Selected Statistics, and although not
a complete report (the final numbers will vary), the report
indicates a continuing trend of increasingly safe streets
and decreasing fatalities and serious injuries, despite the
increased number of drivers, vehicles and total number of
kilometres travelled. The total number of persons killed was
down to 0.49 per 10,000 licensed drivers—483 in real num-
bers—and the number of pedestrians killed dropped to 96,
and driver and passenger deaths decreased to 308.
It seems too early to assess the numbers for 2017,
although both CBC and Global News cite statistics released
by the OPP reporting that 2017 witnessed a five-year high
for the number of fatalities on OPP-patrolled roads. Inat-
tentive- and speed-related factors played major roles (as did
animal collisions). However, despite this surge, Ontario roads
remain safe.
VEHICLE AND ROAD DESIGN IMPROVEMENTS
Kevin Bentley, P.Eng., executive director and chief engi-
neer of MTO’s provincial highways management division,
told Engineering Dimensions, “Engineering factors, both
in vehicle and road design, have played significant roles
in saving lives.” MTO’s statistics, for example, state that in
1964, there were only roughly 2.7 million licensed drivers in
Ontario, with over 111,000 collisions, over 1400 killed and
almost 55,000 injured. Yet in 2014—50 years later—there
were more than 9.7 million drivers, but the number of colli-
sions had only doubled, to roughly 217,000, with 517 killed
and roughly 54,000 injured. According to MTO: “Over the
10-year period from 2006–2015, the number of licensed
drivers in Ontario grew by 11 per cent, while the fatality
rate decreased by 40 per cent, and the injury rate by 26 per
cent. In fact, the number of licensed drivers in Ontario has
Top and middle: An example of inconsistently designed bicycle facilities. doubled since 1980, while the fatality rate has decreased by
The use of bicycles has become increasingly popular, and Ontario’s roads 81 per cent in the same time period.” Bentley noted that
are ill equipped to safely accommodate bicycles. the large safety improvements are likely due to:
Photos: Alexandre Nolet, P.Eng. • effective legislation, regulation and evidence-based
policy and programs;
Bottom: A section of Hamilton’s three-kilometre bicycle lane, implemented • effective tools for law enforcement;
as part of Hamilton’s bid to beautify the city and improve vulnerable road • targeted public education campaigns; and, importantly,
users’ safety. The city used MTO’s Ontario Traffic Manual Book 18 as a • significant improvements in vehicle technology and
guideline. Photo: City of Hamilton road infrastructure.
Bentley acknowledges that the improvements “target not
only highway design but also other factors, including driver
36 Engineering Dimensions January/February 2019Ontario’s roads
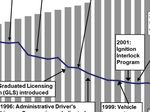
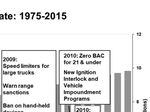
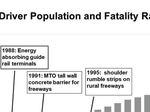
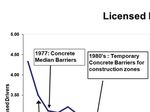
Licensed Drivers Fatality Rate have witnessed
dramatically
decreased fatality
rates over the
past four decades,
despite the increased
number of people
on the road. This
graph demonstrates
the improved safety
on Ontario’s roads,
along with key
safety regulations
in Ontario.
Graph: MTO
behaviours such as impaired driving road safety, Nolet uses wide suburban roads as an example. “If you don’t change
and speeding.” However, according the environment on a six-lane road, things won’t change,” he says. “You’ll still
to forensic engineer Alexandre Nolet, have motorists at 70 [kilometres per hour]. When we reduce speed, we also have
P.Eng., a senior associate with True to make physical changes in the road and its surroundings. You should need to
North Safety Group, road design and look for the posted speed sign to determine a comfortable speed to travel at, but
behaviour go hand in hand. Nolet the environment should dictate the speed.” Nolet cites effective visual cues such
provides independent legal opin- as traffic calming, curb extensions and buildings and trees closer to the roadway.
ion to issues related to the design, Although Ontario’s roadways are safe, there are ambiguous and inconsistent
construction, operations and main- road designs that Nolet would like to see improved. One big concern is road
tenance of transportation facilities, construction sites, where the layout and signs used to guide road users through
including intersections, interchanges, temporary work zones is often not intuitive and leads to driver errors. Bentley,
highways and railway crossings. Nolet however, asserts that MTO has “best practices for traffic control for work on pro-
has experience working with MTO vincial highways…as well, individuals or agencies that perform on any street or
and many Ontario municipalities and highway open to the public in Ontario should follow [specific] fundamental safety
notes that their engineering safety principles and guidelines,” such as traffic protection plans for workers and appro-
and traffic engineering are improv- priate police enforcement and construction staging plans.
ing. “The biggest hurdles are our Nolet also cites the confusing design of right-turn channels—the islands that
politicians,” Nolet says. “The practice allow pedestrians to stand on the road at an intersection as cars turn right behind
had been to meet our design stan- them. Pedestrians will cross without looking for traffic, not realizing that vehicles
dards: follow the standards, that’s it. actually have the right of way. And new innovations, such as mid-block cross-
Now it’s more proactive: We are con- ings for pedestrians and pedestrian crossings with the flashing lights above the
sistently screening our road network street may not be effective if motorists don’t realize they must come to complete
to determine where improvements stops. And although bicycling is rapidly gaining popularity, Ontario’s roads are
can be implemented for the great- not equipped to accommodate them, and the wide-ranging bicycle facilities being
est impact on safety to be achieved. implemented is a concern to Nolet.
There’s a higher level of standard.” At delineating conflict locations, multiple treatments are interchangeably
And road design is improving, used, including green pavement markings, sharrows, dashed white edge lines and
Nolet notes, with Ontario embracing continuous white edge lines. “Although their differences may be obvious to traf-
conservation, especially for vulnerable fic engineers, they can be confusing to the layperson,” Nolet says. He is hopeful,
road users; however, the road network though, because Ontario is updating its province-wide design manual for bicycle
is still designed for vehicles. “More facilities, which should hopefully result in more uniform implementation. Nolet
and more attention is going to infra- adds that the province and municipalities should consider alternatives to ensure
structure for pedestrians and cyclists,” all road users are properly educated on the rules of road sharing. To accent this
Nolet points out. “For too long, it confusion, Nolet points to the implementation of roundabouts: “They function
had not been the case. The concepts well in Europe because they’ve been there so long, but we cannot expect their
of growth aren’t new, we’re just still safety benefits to be immediate in Ontario,” he says. “It requires major educa-
learning how to effectively design for tional campaigns and drivers to gain experience before we see comparable safety
anything other than vehicles.” Noting levels to Europe.” However, MTO is developing a province-wide design manual
the huge factor that speed plays in that, although not mandatory, will be available to all municipalities.
www.peo.on.ca Engineering Dimensions 37An example of the Ministry of Transportation of Ontario’s
integration of roundabouts on Ontario’s highways, used to help
calm traffic. This roundabout is at Holt Road and Highway 401
in Clarington, Ontario. Photo: MTO
Bentley notes that “urban conditions differ from
rural conditions with respect to speed, number of
intersections, traffic congestion, parking and com-
peting lights.” Bentley was speaking specifically
about signage, stating: “Sign design must take into
account these differences. These conditions will
determine requirements for letter size, the selection
of font, contrast, retroreflectivity, spacing and bor-
ders, message layout and reading time, as well as
sign spacing and placement.”
This, undoubtedly, may be a challenge for a
municipality like Hamilton, with both urban and
rural areas, for Hamilton must meet the challenge
USE OF BEST-PRACTICES GUIDELINES of uniformity of its traffic design while addressing
Nolet adds that MTO and most municipalities use similar network the safety issues in its vastly different areas.
screening methods to record their collisions to determine location Transport Canada published its Road Safety in
and network design priorities, with a shift towards one of conserva- Canada in 2011, in which it stated that “contrib-
tion, especially for vulnerable users accessing a network designed uting [safety] factors are impaired driving (i.e.
largely for vehicles. alcohol, drugs, distraction and fatigue), speed and
MTO uses a six-step method to assess the provincial highway net- aggressive driving and occupant protection,” an
work, including network screening, diagnosis and prioritization of assertion that is backed up by MTO statistics.
projects in its continuing quest to maintain the province’s commit- Speeding and aggressive driving have become
ment to safety. “The ministry regularly reviews the safety performance a major focus for Ontario municipalities, and
of provincial highways using historical collision data collected from Hamilton is no different. Consider the case of
police services and utilizes a proactive approach to make improve- Hamilton’s one-way streets. In 1956, the city con-
ments,” Bentley asserts. “MTO has been progressively implementing verted a significant amount of its main arteries to
new roadside safety hardware that meets the American Association one-way streets, a decision that the Hamilton Spec-
of Highway Transportation Officials’ Manual for Assessing Safety tator called in a December 23, 2015, editorial “to
Hardware and is one of the leading jurisdictions.” meet the needs of an increasingly car-dependent
Planning and preliminary engineering for highway expansion society.” The paper, which was frustrated at the
occurs decades in advance; however, MTO has a multi-year pro- city’s slow-moving 15-year attempt to convert the
gram for the rehabilitation of the existing road network, with the streets back to two-way traffic, noted that one-
preliminary design three to five years before construction begins, way streets “are debatably less safe because it is
and engineering two to three years prior to construction. MTO uses generally agreed that motorists drive faster…[and
numerous best-practices manuals, including Transportation Associa- they] are difficult to navigate and cost money for
tion of Canada’s Geometric Design Guide for Canadian Roads, MTO business and taxpayers and tourist outlets.” How-
Roadside Design Manual, Highway Safety Manual and Ontario Traffic ever, Edward Soldo, P.Eng., Hamilton’s director
Manual. MTO engineers must consider: of roads and traffic, states: “In the past 10 years,
• traffic operation; the number of one-ways have dropped, and it’s
• active transportation (pedestrians and bicyclists); had a direct correlation to safety. We’re no longer
• rural versus urban locations; focusing on moving the automobile. We’re slow-
• construction staging; ing down traffic. Two-way conversions are a really
• terrain; good approach in terms of moving all modes.”
• human factors; and
• access management. ADOPTING A VISION ZERO APPROACH
Soldo is also the president of the Canadian Insti-
Bentley echoes Nolet’s concern on uniformity, stating that for traffic tute of Transportation Engineers (CITE), which
signs, “simplicity in design, position and application are crucial. Unifor- consists of over 2000 traffic engineers, planners,
mity in sign design includes sign shape, colour, dimensions, symbols, technologists and students from across the country
wording, lettering and retro-reflectivity or illumination…approved by and is dedicated to the “safe and efficient move-
the national Committee on Uniform Traffic Control Devices for Canada ment of people and goods.” CITE embraces the
after a thorough review of various designs used in Canada, supple- values of Vision Zero, a Swedish-born approach to
mented by test studies.” traffic safety that CITE describes as “built on the
38 Engineering Dimensions January/February 2019basis that traffic deaths and severe injuries are to be a little higher.” Soldo admits that although the number of inju-
preventable. Launched in 1997, Vision Zero empha- ries is going down, collisions are actually going up, a phenomenon he
sizes a safe systems approach, which acknowledges attributes to Hamilton’s population growth.
that people make mistakes and focuses on “influ- Soldo attributes Hamilton’s ability to successfully lower its injury rate
encing system-wide practices, policies and designs to a number of factors, although “it’s difficult to pin it down on one
to lessen the severity of crashes.” thing,” he says. “When you think about red-light cameras, that has had
The traditional approach to safety says that an impact, especially on right-angled collisions, which tend to be a bit
traffic deaths are inevitable, attempts to make more severe. Of those safety measures, they’re starting to take effect.
individuals responsible for collisions and states that Enforcement is important because it changes the behaviour of people.
saving lives is expensive. Vision Zero, on the other Education is important, but the main thing you can do to reduce injuries
hand, looks at a systems approach and states that from an engineering perspective is to make those design changes to
traffic deaths are preventable and that saving lives reduce the impact.” Hamilton’s design changes so far include:
is not expensive. On a practical level, a Vision Zero • Developing its cycling infrastructure to include barrier separation
approach assures that “complete streets concepts and identifying specific conflict points to include design modifi-
are integrated into community-wide plans through cations to increase cyclists’ safety;
projects to encourage a safe, well-connected trans- • Extending crosswalk times for pedestrians at intersections and
portation network for people using all modes of implementing curb radius modifications;
transportation” and that “travel speeds are set and • Effectively identifying that residential roadways are the sights of
managed to achieve safe conditions for the specific concern, and including traffic calming, traffic controls, narrowing
roadway context and to protect all roadway uses, of streets to encourage neighbourhood livability; and
particularly those most at risk in crashes.” • Designing and engineering streets to be forgiving if a collision
Hamilton is one of many Ontario municipalities occurs and to encourage slower speeds.
that have actively embraced Vision Zero, which is
also embraced by MTO’s Vision Zero and is a focal “[We] are taking ownership of collision patterns rather than spe-
point of Canada’s Road Safety Strategy 2025. Using cifically focusing on the motorists’ actions and behaviour,” Soldo
the Vision Zero approach, Hamilton recognizes that notes. With the city now focusing on killed serious injury values,
between 2011 and 2015: Soldo notes: “Traditionally, traffic engineering has focused on rank-
• There averaged over 7900 collisions a year; ing collisions completed through a network safety performance
• Vehicle-only collisions accounted for 95 per function; however, in this traditional evaluation tool, locations with
cent of collisions; high numbers of injuries could be missed. Now the system works in
• There were fatalities or injuries in 20 per cent tandem to ensure traffic safety professionals are addressing locations
of vehicle-only collisions with high injury trends.” To help do this, Hamilton has developed
• When a pedestrian or cyclist was involved in a neighbourhood committees to address local residential roadways
collision, there was a fatality or injury 87 per using a holistic approach rather than as one-off locations.
cent of the time; But given Hamilton’s diverse urban and rural characteristics, speed
• There were on average 16 fatalities a year appears to be the most pressing concern for Soldo, who mentioned
(0.2 per cent of collisions) and 1824 non-fatal the province’s May 30, 2017, passing of the Safer School Zones Act,
injuries (23 per cent of collisions); and which allows municipalities to expand their community safety zones,
• 60 per cent of Hamiltonians have been in a introduce speed restrictions and, importantly, use automated speed
collision, with 48 per cent resulting in a mild enforcement (ASE). The technology, similar to red light cameras,
injury. records speeding vehicles and mails the owner a fine. Hamilton has
been working with MTO, the attorney general, the Ontario Traf-
The period of 2013 to 2017 reported very similar fic Council and other municipalities to implement the technology,
numbers of fatalities and non-fatal injuries, and which will be used only on municipal roads, where MTO notes that
Hamilton reported that they represented “96 per three-quarters of every speed-related collision occurs. Although the
cent of the total collision cost to society.” technology isn’t currently available, Soldo will be asking city council
The numbers are improving still, Soldo reports. to implement it when it is.
“In 2014, we created a Hamilton Strategic Commit- Soldo adds that there is a direct correlation between speed and
tee, and that was an initiative done with Hamilton safety: “The greater the speed, the greater the impact, the more
Police Services, Hamilton Public Health, Public Works severe the impact,” he explains. “By reducing the speed, it reduces
and Engineering Services, and through our col- the severity of the collisions and consequently the severity to pedes-
laborations, we’ve seen a drop in injuries starting trians.” Other municipalities, including many in the United States as
in 2016, and we’re trending towards a 15 per cent well as Calgary and Toronto, have implemented lower speeds, and
[drop],” Soldo says. “It’s good news because we’re Hamilton is considering lowering its municipal standard of maximum
focusing on injuries and fatal collisions, and we’re speed from 50 km/hr to 40. With its commitment to design and com-
starting to see a result. Fatal collisions are a little munity building, Hamilton may prove to be a model for traffic safety
more difficult to control, and we haven’t seen a in Ontario. e
trend in the past five years. We find that they tend
to be related to rural issues, where the speeds tend
www.peo.on.ca Engineering Dimensions 39You can also read


