Half Year Update Consumer Products & E-commerce Business - (ASX: PTL) February 2022 - AFR
←
→
Page content transcription
If your browser does not render page correctly, please read the page content below

Half Year Update
Consumer Products & E-commerce Business
               February 2022
                (ASX: PTL)
Delivering on Our Strategy
      Profit guidance upgraded: now forecasting FY22 underlying EBIT of $10.5m - 11.0m (up 29-35% YoY)1

         Driving Sales                            Develop  New
                                                   Develop New             Expand Export                                       Continuous
         through Key                              Products  and
                                                  Products and                                      New Projects
                                                                                                    New Projects              Manufacturing
                                                                              Markets
            Brands                                  Channels
                                                    Channels                                                                  Improvement

         White King                               Developing              Grow New Zealand        Explore further          Sustainability projects
                                                  e-commerce                                      potential acquisitions
         Jiffy Fire Lighters                                              Continue to sell into                            Waste and energy
                                                  Products
                                                                          China                   Scale up Hampers         reduction
         Softly
                                                  Bondi Soap                                      with Bite                New technology
         Country Life                                                     Explore other
                                                  Grow margin             Asian markets           New customers            New product capabilities
                                                  contribution                                    Value packs              Drive down costs

1   Excluding impact of HWB acquisition related costs of $1.033 million
2    I    Pental Half Year Update February 2022
Pental Ltd (ASX: PTL)

        FY22 H1 Highlights and Financial Results

3   I   Pental Half Year Update February 2022
Pental FY22 H1 Business Highlights
    Pental has delivered strong performance across its diverse Company-owned branded product portfolio

                                                 Successfully completed acquisition              HWB synergies and cross-selling
                                                 of Hampers with Bite effective                  opportunities with traditional brands
                                                 1 September 2021                                to be realised in FY22 H2

                                                 Smooth integration of the HWB
                                                 e-commerce business under the                   Developing new HWB seasonal
                                                 Pental umbrella                                 growth strategies to be implemented
                                                                                                 from January 2022

                                 Sales growth of 12.1% in                                        Successfully raised $10.05
                                 New Zealand market                                              million (net of costs) in capital
                                                                                                 for HWB acquisition

                                                                                                 Increased input cost of commodities
                                                 First to market launch of White King,           and freight impacted consumer
                                                 Country Life and Velvet value packs             products business margins in FY22 H1
                                                                                                 – recovery plan executed in early H2

                                                 Successful launch of premium Bondi              Successful upgrade of fire protection
                                                 Soap brand in e-commerce channel                systems at Shepparton facilities resulting
                                                                                                 in significant reduction in insurance
                                                                                                 premiums effective 1 December 2021

4    I   Pental Half Year Update February 2022
FY22 H1 Financial Report Card

         1. Total revenue                                          $66.375m- up 2.7%                          • Acquisition of Hampers with Bite has
                                                                                                                brought Pental an online channel
                                                                                                                customer base, improved scale, e-
         2. Underlying EBITDA                                      $9.513m – up 55.6%                           commerce expertise, revenue
                                                                                                                synergies and new product
                                                                                                                capabilities
         3. Underlying EBIT                                        $7.555m – up 78.3%
                                                                                                              • Higher e-commerce sales mix of
                                                                                                                HWB significantly improves
                                                                                                                underlying EBITDA margins
         4. Owned brands revenue                                         EBIT– down
                                                                   $25.901m    $m or3.29%
                                                                        10.0% of GSV                          • Strong HWB growth while under
                                                                   $24.987m – up 56.3% on same 4 -month         Pental ownership has offset reduced
         5. HWB Net Sales (from 1 Sep to 26 Dec)
                                                                   periodChannel
                                                                          1      Mix                            revenues following May 2021
                                                                        < 70% FMCG                              changes to Duracell distributorship
                                                                                                                agreement
         6. Cash position                                          $12.9m in cash with $4.7m in debt
                                                                                                              • Owned brand revenue down mainly in
                                                                         ROIC 10%+
                                                                                                                Q1 – returned to growth in Q2
         7. Underlying earnings per share                          3.36 cents per share – up 58.5%
                                                                                                              • Strong balance sheet position to
                                                                       Gearing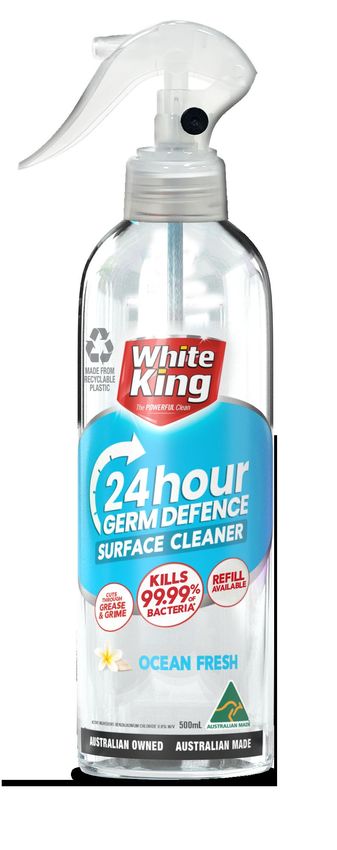
E-Commerce Highlights
    Hampers with Bite going from strength to strength, providing a diversified driver of rapid growth

                                                                190,000+
                                                                                                        13,000+ social
                                                                  email
                                                                                                        media followers
                                                               subscribers
                                                                                                         (up 225% on
                                                              (up 280% on
                                                                                                           Dec 20)
                                                                 Dec 20)

                                                          Successful launch of
                                                          premium Bondi Soap
1,535,000+                                                brand in e-commerce
                                                                 channel                                 Strong B2C
  website                                                                                                 revenue
   visits                                                                                                 growth of
(up 128%)                                                                                               180% on PCP

6     I   Pental Half Year Update February 2022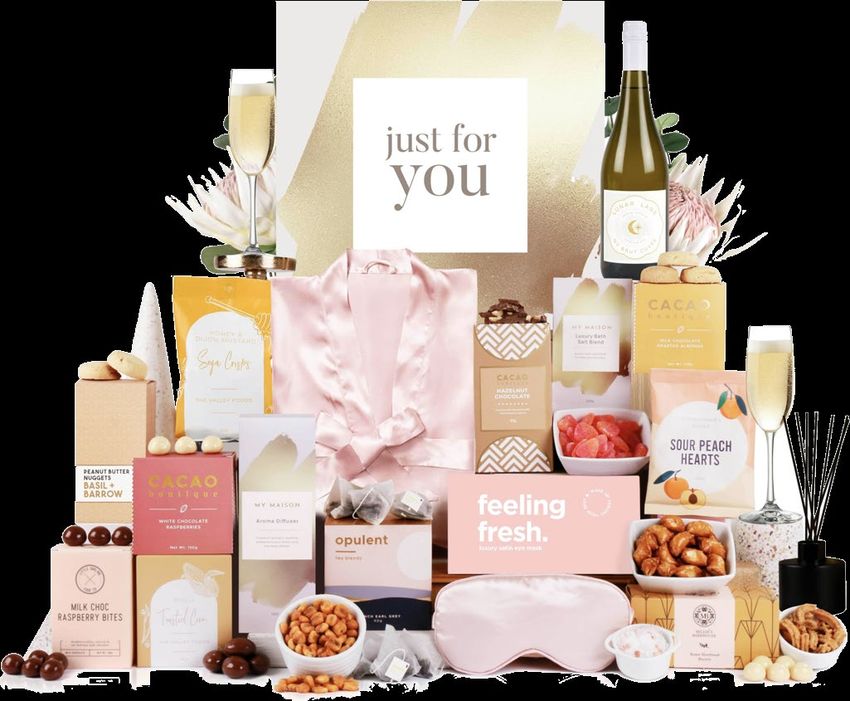
HWB E-Commerce Business
    Hampers With Bite (HWB) performing strongly in FY22 H1

     Significant                                              Strong B2B                    Strong 4                      $25
        B2C                                                     Market                      months                       Million
       Growth                                                                            (under Pental ownership)

       180% growth in revenue*                                B2B revenue up 30.5%*         Sales performance       revenue contribution from
                                                              9,400+ active customers#   exceeded the entire FY21     1 September 2021 to
                                                                                            sales performance*            26 Dec 2021

    *includes unaudited figures from pre-acquisition period
                                                                                                                                            7
    # Active customer = invoiced in last 12 months

7      I Pental Half Year Update February 2022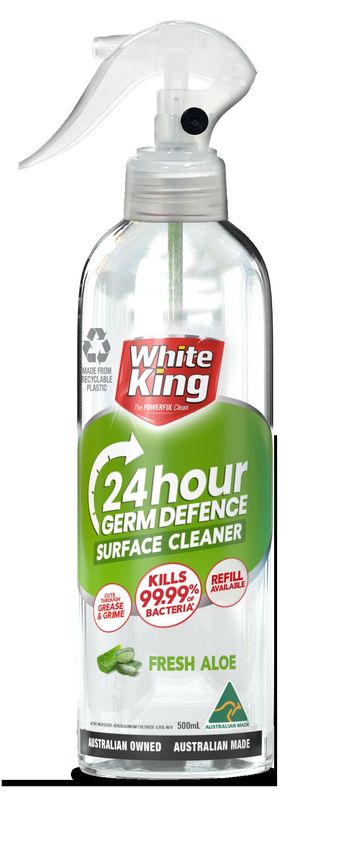
Financial Performance
    Key Consolidated Income Statement Items                                                                                      • Pental successfully completed acquisition of
                                                                                                                                   Hampers with Bite (HWB) on 1 September 2021 –
                      $’000                               Dec 21           Dec 20 Change                   %                       within 2 weeks of entering agreement to acquire

Net Sales                                                  66,375            64,632          1,743             2.7%              • Net sales up on PCP by 2.7% as strong HWB
Underlying EBITDA1                                           9,513            6,113          3,400           55.6%                 revenue contribution of $25m offset decline of
                                                                                                                                   Duracell sales following changes to distribution
Underlying EBITDA margin on Net Sales1                       14.3%             9.5%           4.9%                                 agreement
Depreciation                                               (1,958)          (1,875)            (83)            4.4%
                                                                                                                                 • EBITDA margins improved significantly impacted
                                                                                                                                   by strong margins from HWB e-commerce
Underlying EBIT1                                             7,555            4,238          3,317           78.3%
                                                                                                                                   business
Underlying EBIT margin on Net Sales1                         11.4%             6.6%           4.8%
                                                                                                                                 • Pental successfully developed and launched new
Underlying Net profit after tax1                             5,272            2,889          2,383           82.5%                 Bondi Soap range and bundle packs under White
                                                                                                                                   King, Country Life and Velvet brands
Reported Profit after tax                                    4,239            2,889          1,350           46.7%
                                                                                                                                 • Consumer products business margins impacted
                                                                                                                                   by approximately $1.5m due to rising input cost of
Underlying Basic earnings per
                                                              3.36              2.12          1.24           58.5%
                                                                                                                                   raw materials & freight. Successful recovery in
share in cents1                                                                                                                    place for H2

Reported basic (loss) / earnings per
                                                              2.70              2.12          0.58           27.4%               • Underlying EPS of 3.36 cents per share up on
share in cents
                                                                                                                                   PCP by 58.5% after considering the impact of
                                                                                                                                   new shares issued in FY22 H1 to facilitate
Interim Dividend Per Share in cents                           1.30              1.00          0.30           30.0%                 acquisition of HWB

1 FY22   H1 underlying results exclude impact of $1.033m costs relating to HWB acquisition (net of tax). No abnormal items in FY21 H1 results.
8    I    Pental Half Year Update February 2022
Financial Performance
    Key Statement of Financial Position Items
                        $’000                               Dec-21*             Jun-21           Change                     • Strong cash position as a result of strong
 ASSETS                                                                                                                       operating cash flow of $10.557 million
 Cash                                                               12,917           12,702             215
                                                                                                                            • Pental remains effectively debt free as at
 Trade and other receivables                                        14,010           14,096            (86)
                                                                                                                              reporting date i.e. cash in excess of
 Inventories                                                        17,324           16,053          1,271
                                                                                                                              borrowings
 Property, plant and equipment                                      19,680           19,301             379
 Leased assets                                                        1,404              928            476
                                                                                                                            • Working capital position lower than June 21
 Brandnames and other intangible assets                             41,350           12,181         29,169
                                                                                                                              due to unwinding of Duracell related debtors
 Other                                                                1,228              333            895
                                                                                                                              and inventories
 Total Assets                                                      107,913           75,594         32,319

 LIIABILITIES                                                                                                               • Strong collection and management of debtors
 Trade and other payables                                           16,773           12,291          4,482
                                                                                                                              with minimal overdues
 Current tax payable                                                  1,283              449            834
 Lease liabilities                                                    1,336              978            358
                                                                                                                            • Key brand values remain strong supported by
                                                                                                                              strong marketing investment e.g. White King
 Employee and other provisions                                        6,854            2,685         4,169
 Borrowings                                                           4,675                  -       4,675
                                                                                                                            • Strong balance sheet to maintain a healthy
 Other financial liabilities                                                -              81          (81)
                                                                                                                              dividend and pursue further growth
 Deferred Tax Liabilities                                             5,161            2,363         2,798
                                                                                                                              opportunities
 Total Liabilities                                                  36,082           18,847         17,235

 NET ASSETS                                                         71,831           56,747         15,084

*HWB acquisition related balances have been recorded on a provisional basis (in line with AASB 3) and are subject to changes / revision within 12-month period from acquisition date.

9    I   Pental Half Year Update February 2022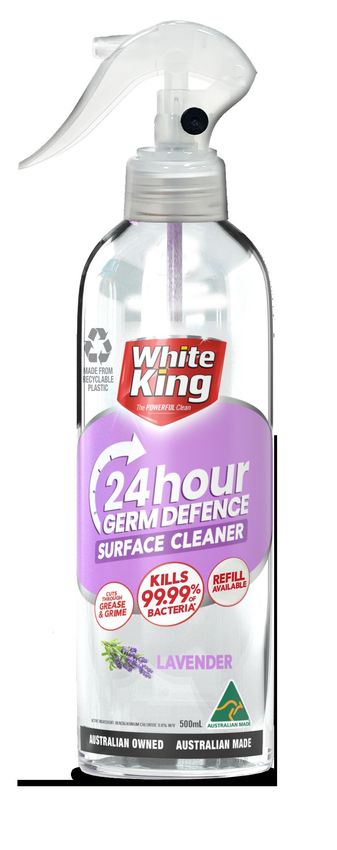
Financial Performance
     Key Consolidated Statement of Cash Flows Items
                             $’000                     Dec 21    Dec 20    Change      • Working capital down on PCP by $4.357
 Profit after Tax                                       4,239     2,889       1,350
                                                                                         million predominantly due to unwinding of
                                                                                         Duracell related debtors and inventories
 Add noncash items (impairment, depreciation,
                                                        2,027     1,954          73
 amortisation and employee share options expense)                                      • Operating cash flow remains strong excluding
 Add Acquisition related expenses (not operating in                                      the release of Duracell working capital
                                                        1,033          -      1,033
 nature)
 Change in net working capital                          4,245     (112)       4,357
                                                                                       • The Group successfully completed acquisition
 Movement in income tax liabilities                     (306)     (987)         681      of HWB on 1 September 2021 with cash
 Other balance sheet movements                          (681)     (444)       (237)
                                                                                         consideration of $21.121 million and costs of
                                                                                         $1.033 million offset by cash acquired at HWB
 Net cash provided / (used) by operating activities    10,557     3,300       7,257      of $1.555 million
 Capital Expenditure                                   (1,587)    (816)       (771)
                                                                                       • Pental successfully raised $10.046 million in
 Acquisition of HWB (net of cash and costs)           (20,599)         -    (20,599)     capital through placement and share purchase
 Lease liabilities repaid                               (393)     (280)       (113)      plan to facilitate acquisition of HWB
 Repayment of supplier payment facility                   (84)    (129)          45
                                                                                       • The Company remains effectively debt free as
 Proceeds from issue of shares (net of costs)          10,046          -     10,046      at reporting date (cash in excess of borrowings
 Borrowings (net of repayments)                         4,675          -      4,675      and other financial liabilities)
 Dividend Paid                                         (2,400)   (2,998)        598
                                                                                       • Dividend paid during the reported period lower
 Net increase/(decrease) in cash                          215     (923)       1,138      than prior year due to special dividend paid in
 Net cash position at the beginning of the period      12,702     3,668       9,034      prior year

 Net cash position at the end of the period            12,917     2,745      10,172

10   I   Pental Half Year Update February 2022
FY22 Full-Year Forecast
Business Outlook
11 I Pental Half Year Update February 2022Pental Forecast
4th continuous year of profitability growth expected in FY22, with EBIT margins significantly improving
Delivering Profit Growth
$’millions Transformational change
Revenue and profit growth trend over 5 years with HWB acquisition
12.0 significantly improving 140.0
126.5 124.9 EBIT margins
120.0
10.0
100.4 115
100.0
8.0 7.4
75.7
80.0
6.0 5.6
5.0
60.0
4.0 3.5
2.6 40.0
2.0
20.0
3.8 5.0 7.4 8.1 10.7
0.0 0.0
FY18 FY19 FY20 FY21 FY22F*
Underlying NPAT Underlying EBIT Net Sales Revenue
(LHS) (LHS) (RHS)
• 4th continuous year of profitability growth expected in FY22
• FY22 revenue drop due to changes in Duracell distributorship agreement
• FY22 EBIT margins significantly improving due to addition of B2C and B2B channels through HWB acquisition
• FY 22 forecast Includes HWB figures only for 10 months of the financial year (acquisition completed 1 September 2021)
*FY22 forecast at mid-point of the range and underlying results exclude impact of $1.033m costs relating to HWB acquisition (net of tax).
1211 I Pental Half Year Update February 2022 12
I Pental Half Year Update February 2022Hampers with Bite Outlook
Aggressive
Growth Plans
13 I Pental Half Year Update February 2022HWB Expands into Wellness Gifting
50% Continued Revenue Growth All
Year Round: 12 Month Provider
Demand in Employee Wellness and Recognition
• Employers (HWB customers) making budget allowances for
employee recognition and welfare is a pivotal driver of HWB’s
recent growth
• A recent survey from Melbourne University found that 70% of
Australians who have work from home during the pandemic would
like to continue doing so
• Through range diversification and technology, HWB will continue
to expand product offerings to keep its extensive B2B database
connected and engaged
14 I Pental Half Year Update February 2022HWB New Wellness Brand
Realisation of HWB cross-selling opportunities with Pental's brands
Pental Production - HWB New
Wellness Brand
Pental is set to produce 10 - 15% of HWB
product in its rapidly expanding wellness
10-15% range. The global wellness economy is
now valued at $4.4 trillion, representing
HWB Product to be
Pental Produced 5.1% of global economic output in 2020
Pental is expected to reach an annualised growth target of $1 million through supply
of bar soaps, hand wash, body wash, bed and
linen spray and air freshener
15 I Pental Half Year Update February 2022HWB Growth Opportunity
Employee wellness growth statistics
6% 31% 52%
EXPECTED GROWTH IN LESS TURNOVER IN STAFF WANT TO RECEIVE
2022 FOR CORPORATE ORGANISATIONS WITH MORE RECOGNITION
WELLNESS SERVICES RECOGNITION PROGRAMS FROM MANAGEMENT
ibis Worldwide, 2022 Forbes, 2022 Quantium Research, 2022
16 I Pental Half Year Update February 2022 16HWB Moves Beyond Seasonal Business Model
Year-Long Growth, Jan-Sep Vs Oct-Dec
FY19/20 FY20/21 FY21/22
385% Revenue Growth 133% Revenue Growth
2019 JAN-SEP
2020 JAN-SEP 2021 JAN-SEP
12% 34% 48%
Overall Sales
Overall Sales Overall Sales
49% Revenue Growth 23% Revenue Growth
2019 OCT-DEC
2020 OCT-DEC 2021 OCT-DEC
88% 66% 52%
Overall Sales
Overall Sales Overall Sales
17 I Pental Half Year Update February 2022HWB Growth Strategies in H2 FY22
Aggressive
Forecasting 50% Focusing on
growth plans
Year on Year Employee
with a full
Revenue Growth Wellness
calendar of
events
HWB to become a New Value- Pental Shepparton
year-round business Added Hampers producing
products for HWB
Growth through Professional Always progressing
range trained sales team with new
diversification building B2B technology
clientele
18 I Pental Half Year Update February 2022Pental
Consumer
Products
Business
19 I Pental Half Year Update February 2022 19White King’s Growth Drivers
OBJECTIVE 1 OBJECTIVE 2 OBJECTIVE 3 OBJECTIVE 4
Enter multi purpose Value added existing product Growth strategies within Develop the next generation of
segment with innovative development for bathroom e-commerce and alternate White King (non bleach)
new product development and bleach portfolio channels with product cleaning products
(NPD) bundle packs
• Sustainable packaging • Innovative pipeline in:
• Market first innovation • Higher efficacy • Costco • Toilet
• New sustainable • On trend inclusions • Big W • Cleaners
products • Premium NPD • E-retailers • Stain removers
20 I Pental Half Year Update February 2022Refills
White King’s
new product
development
• RPET Bottles
• Biodegradable formula
• Continuous protection from germs for up to 24 hours
• Concentrated refills means less plastic
21 I Pental Half Year Update February 2022Country Life New Product Direction
Innovation to offer a greener, cleaner and fuller future for new consumers
New direction appeal targeting under 40 year old demographic
Refillable, Reusable and Recyclable Packaging
A cohesive new product look with colours representative of the Australian
landscape, perfect for every house proud consumer
22 I Pental Half Year Update February 2022Jiffy Firelighters FY22 Outlook
Growth drivers:
Jiffy continues to be the #1 brand of firelighters
Success of NPD: Ensure
Jiffy Firelighters experiencing 8.5% dollar growth and 4.2% growth of recently ranged
unit growth . Jiffy is the #1 Firelighter brand on the market NPD (including growth of
with 31% Market Share* NPD last year)
• ‘Winning Winter’
• Maintain current market
share and #1 status
* Source: IRI: Firelighters, AU Grocery Scan, MAT 09/01/22
Source – IRI: Firelighters, AU Grocery
Scan, MAT 09/01/22
23 I Pental Half Year Update February 2022Sales Growth FY22 Outlook
NPD to generate 3% growth in H2 Bundle packs –
FY22 and 12% growth for the full Tradies, Velvet & White King
FY23
Through the 5 new ranged
products in Bunnings stores,
targeting $1 million in sales
24 I Pental Half Year Update February 2022FY22
Sustainability Projects
Waste reduction
Natural products (Bondi)
Paper wrappers
Reduction in packaging
Develop new specific sustainable products
Non-chemical formulations
Less plastic
Reduction in water usage
25Consumer Products Business Outlook for H2
Full price E-commerce
Forecasting 5% growth with Bondi
branded growth in recovery on H1
material costs & White King
consumer products
business
Continued search for Continued Pental Shepparton
another acquisition strong cash continue to
position control costs
Ranging of new Country Life new
products in major Full six months of
product direction growth in Bunnings
retailers
1 Cash on hand to be in excess of Debt
26 I Pental Half Year Update February 2022Outlook Summary
Continuing Strategic
Sustainability Export Marketing
Innovation Acquisitions &
Partners Support
Pipelines Partnerships
• Natural products • New Hampers • Enhancing our • Digital marketing • New products and
(Bondi) export footprint: categories
• New Employee • Invest in ranging
• Recyclable packaging Wellness Gifting New Zealand • Invest in shelf • Shareholder value
• Reduce packaging • Satisfy consumer China presence • Increasing scale
• Non-bleach cleaners needs Other Asian • Driving sales with • Procell/Duracell
• Manufacturing waste • Be quick and nimble markets Australian Made / • Bunnings
reduction Australian Owned
• New distributors
platform
• Energy usage
monitoring
27 I Pental Half Year Update February 2022Pental Outlook Summary
The Company expects the full financial year underlying EBIT profit
result will be in the range of $10.5 to $11 million - 29% to 30% growth
$’millions Transformational change
Revenue and profit growth trend over 5 years with HWB acquisition
12.0 significantly improving 140.0
126.5 124.9 EBIT margins
10.0 120.0
100.4 115
100.0
8.0 7.4
75.7
80.0
6.0 5.6
5.0
60.0
4.0 3.5
2.6 40.0
2.0 20.0
3.8 5.0 7.4 8.1 10.7
0.0 0.0
FY18 FY19 FY20 FY21 FY22F*
Underlying NPAT Underlying EBIT Net Sales Revenue
(LHS) (LHS) (RHS)
Key Drivers:
• Full raw material price recovery from the market effective February 2022
• Aggressive monthly growth from HWB
• Consumer products business expected to grow by 5%
• Operational cost control
*FY22 forecast at mid-point of the range and underlying results exclude impact of $1.033m costs relating to HWB acquisition (net of tax).
2811 I
I
Pental Half Year Update February 2022
Pental Half Year Update February 2022Important Notice and Disclaimer
This presentation has been prepared by Pental Limited ACN 091 035 353 (Company). This presentation contains summary information about the Company, its subsidiaries and the entities, businesses and assets they own
and operate (Group) and their activities current as at 18 February 2022 unless otherwise stated and the information remains subject to change without notice. This presentation contains general background information and
does not purport to be complete. It has been prepared by the Company with due care but no representation or warranty, express or implied, is provided in relation to the accuracy, reliability, fairness or completeness of the
information, opinions or conclusions in this presentation.
Not an offer or financial product advice: The Company is not licensed to provide financial product advice. This presentation is not and should not be considered, and does not contain or purport to contain, an offer or an
invitation to sell, or a solicitation of an offer to buy, directly or indirectly, in any member of the Group or any other financial products (Securities). This presentation is for information purposes only.
Financial data: All dollar values are in Australian dollars ($ or A$). Any financial data in this presentation is unaudited.
Effect of rounding: A number of figures, amounts, percentages, estimates, calculations of value and fractions in this presentation are subject to the effect of rounding. Accordingly, the actual calculation of these figures may
differ from the figures set out in this presentation.
Underlying financial information: Any reference to underlying financial information in this presentation is a result of excluding impact of non-recurring income and expenditure based on the Company’s judgement. A
reconciliation between the Underlying financial information and Pental’s statutory financial information is included within the Financial Report. The statutory results in this Report are based on the Final Financial Report
which has been audited by the Group’s auditors.
Past performance: The operating and historical financial information given in this presentation is given for illustrative purposes only and should not be relied upon as (and is not) an indication of the Company's views on its
future performance or condition.
Actual results could differ materially from those referred to in this presentation. You should note that past performance of the Group is not and cannot be relied upon as an indicator of (and provides no guidance as to)
future Group performance.
Future performance: This presentation contains certain "forward-looking statements". The words "expect", "anticipate", "estimate", "intend", "believe", "guidance", “propose”, “goals”, “targets”, “aims”, “outlook”,
“forecasts”, "should", "could", “would”, "may", "will", "predict", "plan" and other similar expressions are intended to identify forward-looking statements. Any indications of, and guidance on, future operating performance,
earnings and financial position and performance are also forward- looking statements. Forward-looking statements in this presentation include statements regarding the Company’s future financial performance, growth
options, strategies and new products . Forward-looking statements, opinions and estimates provided in this presentation are based on assumptions and contingencies which are subject to change without notice, as are
statements about market and industry trends, which are based on interpretations of current market conditions.
Forward-looking statements, including projections, guidance on future operations, earnings and estimates (if any), are provided as a general guide only and should not be relied upon as an indication or guarantee of future
performance. No representation is given that the assumptions upon which forward looking statements may be based are reasonable. This presentation contains statements that are subject to risk factors associated with the
Group's industry. These forward-looking statements may be affected by a range of variables which could cause actual results or trends to differ materially, including but not limited to earnings, capital expenditure, cash flow
and capital structure risks and general business risks. No representation, warranty or assurance (express or implied) is given or made in relation to any forward-looking statement by any person (including the Company). In
particular, but without limitation, no representation, warranty or assurance (express or implied) is given that the occurrence of the events expressed or implied in any forward-looking statements in this presentation will
actually occur. Actual operations, results, performance or achievement may vary materially from any projections and forward-looking statements and the assumptions on which those statements are based. Any forward-
looking statements in this presentation speak only as of the date of this presentation. Subject to any continuing obligations under applicable law, the Company disclaims any obligation or undertaking to provide any updates
or revisions to any forward-looking statements in this presentation to reflect any change in expectations in relation to any forward-looking statements or any change in events, conditions or circumstances on which any such
statement is based. Nothing in this presentation will under any circumstances create an implication that there has been no change in the affairs of the Group since the date of this presentation.
Non-IFRS terms: This presentation contains certain financial data that has not been prepared in accordance with a definition prescribed by Australian Accounting Standards or International Financial Reporting Standards,
including the following measures: EBITDA, EBITDA margin, EBIT, maintenance capital expenditure and growth capital expenditure or performance improvement capital expenditure. Because these measures lack a
prescribed definition, they may not be comparable to similarly titled measures presented by other companies, and nor should they be considered as an alternative to financial measures calculated in accordance with
Australian Accounting Standards and International Financial Reporting Standards. Although the Company believes that these non-IFRS terms provide useful information to recipients in measuring the financial performance
and the condition of the business, recipients are cautioned not to place undue reliance on such measures.
No liability: The Company has prepared this presentation based on information available to it at the time of preparation, from sources believed to be reliable and subject to the qualifications in this document. To the
maximum extent permitted by law, the Company and its affiliates, related bodies corporate (as that term is defined in the Corporations Act), shareholders, directors, employees, officers, representatives, agents, partners,
consultants and advisers accept no responsibility or liability for the contents of this presentation and make no recommendations or warranties. No representation or warranty, express or implied, is made as to the fairness,
accuracy, adequacy, validity, correctness or completeness of the information, opinions and conclusions contained in this presentation. To the maximum extent permitted by law, the Group does not accept any responsibility
or liability including, without limitation, any liability arising from fault or negligence on the part of any person, for any loss whatever arising from the use of the information in this presentation or its contents or otherwise
arising in connection with it.
2911 I
I
Pental Half Year Update February 2022
Pental Half Year Update February 2022Thank You
Contact Us
Investor queries:
Oliver Carton, Company Secretary
tel: +61 3 9251 2311
Media queries:
Tim Dohrmann, NWR Communications
I Pental Half Year Update February 2022 email: tim@nwrcommunications.com.auYou can also read