Half Year Results 2021 - Westfield Chermside, QLD - Scentre Group
←
→
Page content transcription
If your browser does not render page correctly, please read the page content below
Half Year Results
2021

                    Westfield Chermside, QLD
Half Year Results
30 June 2021

                                       6 months to     6 months to
$million
                                       30 Jun 2021    30 Jun 2020    Growth %

Operating Profit                            $460.1         $360.8
Cents per security                           8.88c           6.94c    28.0%

Funds From Operations (FFO)                $463.4           $361.9
Cents per security                           8.94c           6.96c    28.4%

Receipts in the course of operations      $1,383.9        $1,059.4    30.6%

Net Operating Cashflow Surplus              $487.7         $228.7     113.2%
Cents per security                            9.41c          4.40c

Distribution per security               7.00 cents               -

                                                                                Half Year Results 2021   2
Half Year Overview
Our Westfield Living Centre platform is essential to people,            Capital Management
communities and businesses                                              The Group currently has available liquidity of $5.7 billion, sufficient to cover
During the 6 months to June 2021 we experienced a strong                all debt maturities to early 2024.
operating performance even though there were a number of                - The Group repaid $1.2 billion of debt
government lockdowns:                                                   - S&P, Fitch and Moody’s upgraded the Group’s outlook to Stable
-   Total sales through our platform were $11.2 billion                 Projects
-   Total sales excluding cinemas and travel exceeded the first half    Notwithstanding the recent government restrictions:
    of 2019                                                             - The $55 million entertainment, leisure and dining precinct development
Demand for space in our Westfield Living Centres is strong                  at Mt Druitt is progressing and is expected to open in the first quarter of
                                                                            2022
-   We completed 1,515 new leasing deals including 619 new
                                                                        - Works on behalf of Cbus Property to design and construct the
    merchant deals, with occupancy of 98.5%
                                                                            residential and commercial tower in Sydney’s CBD are also progressing,
-   We welcomed 139 new brands to the portfolio                             with completion expected in 2023
We have made significant progress on our strategic initiatives          We are a responsible, sustainable business
- Our Westfield Plus membership program now has more than 1.9           - We released our 2020 Responsible Business Report
  million members, increasing by 1.4 million since June last year       - We have completed our pathway to achieve net zero emissions by
- We are on track to launch our aggregated ‘click and collect’              2030. This includes a plan to reduce our emissions by more than 50%
  platform in the second half of 2021, building on a successful pilot       by 2025.
  last year                                                             - Our New Zealand portfolio will be powered by 100% renewable
                                                                            electricity from January 2022

                                                                                                                                        Half Year Results 2021   3
1.
20
120
0
80
40
140
60
100
20
120
0
80
40
60
100
Legend
Jan-20 Jan-20
Feb-20 Feb-20
Mar-20 Mar-20
Apr-20 Apr-20
May-20 May-20
Jun-20 Jun-20
Jul-20 Jul-20
Aug-20 Aug-20
Denotes lockdown period
Sep-20 Sep-20
Oct-20 Oct-20
SA
Nov-20 Nov-20
ACT
Dec-20 Dec-20
Jan-21 Jan-21
Feb-21 Feb-21
Mar-21 Mar-21
Apr-21 Apr-21
May-21 May-21
Weekly customer visits versus 2019, indexed to 100
Jun-21 Jun-21
Jul-21 Jul-21
Aug-21 Aug-21
20
120
0
80
40
140
60
100
20
120
0
80
40
60
100
20
120
0
80
40
60
100
Jan-20 Jan-20 Jan-20
Feb-20 Feb-20 Feb-20
Mar-20 Mar-20 Mar-20
Apr-20 Apr-20 Apr-20
May-20 May-20 May-20
Jun-20 Jun-20 Jun-20
Jul-20 Jul-20 Jul-20
Aug-20 Aug-20 Aug-20
Sep-20 Sep-20 Sep-20
Oct-20 Oct-20 Oct-20
NZ
WA
QLD
Nov-20 Nov-20 Nov-20
Dec-20 Dec-20 Dec-20
Jan-21 Jan-21 Jan-21
Feb-21 Feb-21 Feb-21
Mar-21 Mar-21 Mar-21
Apr-21 Apr-21 Apr-21
May-21 May-21 May-21
Jun-21 Jun-21 Jun-21
Jul-21 Jul-21 Jul-21
Customer Visits by Region
Aug-21 Aug-21 Aug-21
1
20
120
20
120
0
80
0
80
40
40
60
100
60
100
Jan-20 Jan-20
Feb-20 Feb-20
Mar-20 Mar-20
Apr-20 Apr-20
May-20 May-20
Jun-20 Jun-20
We have experienced a strong rebound in visitation as soon as government restrictions were eased
Jul-20 Jul-20
Aug-20 Aug-20
Sep-20 Sep-20
Oct-20 Oct-20
VIC
Nov-20 Nov-20
NSW
Dec-20 Dec-20
Jan-21 Jan-21
Feb-21 Feb-21
Mar-21 Mar-21
Apr-21 Apr-21
May-21 May-21
Jun-21 Jun-21
Jul-21 Jul-21
Aug-21 Aug-21
4 Half Year Results 2021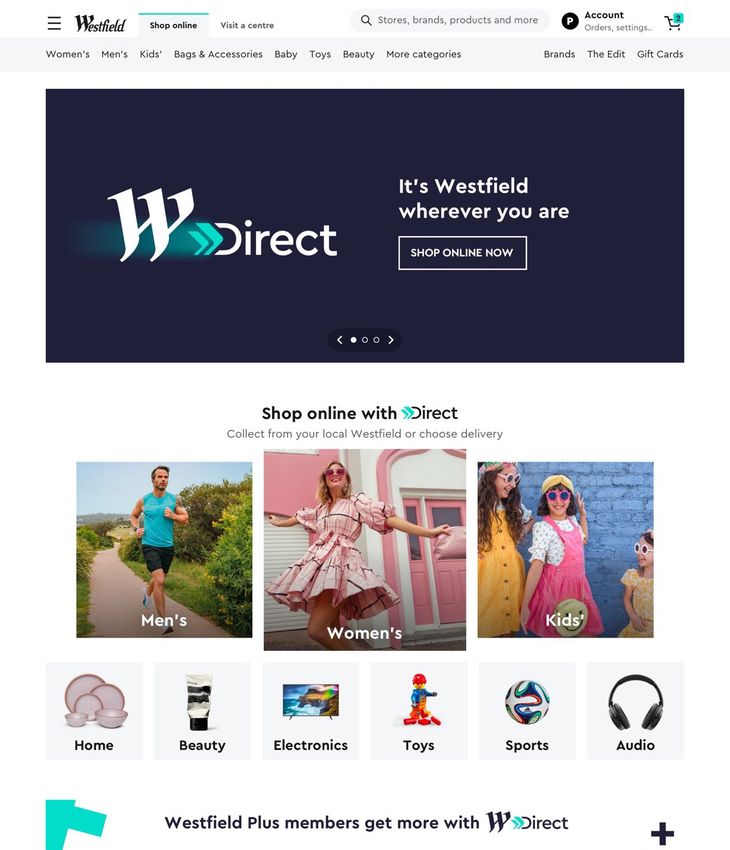
Total Sales                                              1

Our business partners experienced a strong rebound in sales as soon as government restrictions were eased

 Retailer In-Store Sales

          $11.8b
            $0.8b
                                                                    $11.2b   When restrictions are removed, customers want to return
                                                                     $0.1b
                                                                             to our centres to purchase and consume goods, services
                                       $9.8b                                 and experiences
                                         $0.4b
                                                                             During the first half of 2021, total sales excluding cinemas
                                                                             and travel exceeded the first half of 2019
          $11.0b                                                    $11.1b
                                       $9.4b

             H119                        H120                        H121

               Cinema & Travel              Total excl Cinema & Travel

1.   Inclusive of all stores, majors, mini-majors and specialties                                                                Half Year Results 2021   5
Total Sales by Region 1
Our business partners experienced a strong rebound in sales as soon as government restrictions were eased
SA - No Lockdown Days 2 NZ - 7 Days 2 NSW - 15 Days 2
$0.8b $0.7b $0.8b $0.7b $0.7b $0.9b $4.6b $3.7b $4.4b
H119 H120 H121 H119 H120 H121 H119 H120 H121
ACT - No Lockdown Days 2 QLD - 8 Days 2 VIC - 19 Days 2
$0.4b $0.4b $0.4b $1.7b $1.5b $1.8b $1.9b $1.6b $1.9b
H119 H120 H121 H119 H120 H121 H119 H120 H121
WA - 10 Days 2
$0.9b $0.8b $0.9b
H119 H120 H121
1. Total Sales excluding Cinemas and Travel Half Year Results 2021 6
2. Number of days of government lockdown restrictions in the first six months of 2021Leasing Activity
We have experienced strong demand for space
Leasing Deals New Leases Renewals Demand for space in our Living Centres is strong
1,515
1,189 During the first half, we have completed 1,515 leasing deals,
619 including 619 new merchant deals
576 596
613
293 896 We have welcomed 139 new brands to the portfolio including
H119
303
H120 H121
a number of first to market brands
H119 H120 H121
− First to portfolio brands include the Miele Experience
Centre at Westfield Doncaster and StyleRunner, Rebecca
New Brands Welcomed Vallance and Allkinds at Westfield Miranda
139 − At Westfield Newmarket in New Zealand, first to market
118 brands include Moncler, Saint Laurent, Balenciaga,
Alexander McQueen, Burberry and Jimmy Choo
56
H119 H120 H121
Half Year Results 2021 7Gross Rent Cash Collections
The Group collected $1.2 billion of gross rent during the first half of 2021
250
1st Half 2020: $875 million 1st Half 2021: $1.2 billion
200
$200m $200m $200m $199m $202m $201m $198m $200m
$174m
$168m
150
100
$74m
50 $59m
-
January February March April May June January February March April May June
Half Year Results 2021 8Long-Term Growth in Total Rental Income
Total Portfolio1
Space (GLA square metres) Our leading platform, expertise and focus on curating an
offer that our customers want has delivered long-term
3.9m growth
3.6m
Since 2010, we have consistently grown rental income. This
3.4m has been achieved through both the:
- Addition of space, and
2010 2015 2021 - Growth in total rent per square metre
We have added space through more than 25
redevelopments across the portfolio and the strategic
Total Rent Per Square Metre acquisition of two high quality shopping centres
$822 Our lease structure has remained constant with contractual
$785
rental escalations. The growth in rent per square metre
includes the completion of more than 25,000 leasing deals
$667
since 2010
2010 2015 2021
1. This is inclusive of all stores, majors, mini-majors and specialties Half Year Results 2021 9Scentre Group Overview
Our Purpose Extraordinary platform of 42 Living Centres,
Creating extraordinary places, connecting and enriching communities ownership of 7 of the top 10 centres in Australia and 4 of
the top 5 in New Zealand
Our Plan Essential social infrastructure, strategically located in close
proximity to where 20 million people live
We will create the places more people choose to come, more often, for longer
Well positioned to extend our leadership position, build on
our core strengths and grow from being important to
Our Ambition essential for people, communities and the businesses that
Is to grow the business by becoming essential to people, their communities and interact with them
businesses that interact with them
Customer focussed strategy, focused on delivering what
customers want
We are a responsible sustainable business
Delivering the first choice platform for business partners to
connect and interact with customers
Community People Environment Economic
Performance
Half Year Results 2021 10Strategic Locations
The strategic locations of our portfolio enables businesses to efficiently connect with more customers
With a total population of 30 million, there is further opportunity for the business and platform to reach more people
20
people million
live within close proximity to a
people live
Westfield withinCentre
Living close proximity to a
Westfield Living Centre
Brisbane 6 CENTRES
Sydne Australia &
y New Zealand Portfolio
Perth Adelaide Sydney
4 CENTRES 3 CENTRES 15 CENTRES
Canberra
Auckland
42 468m
2 CENTRES
Melbourne
7 CENTRES
Westfield Customer
Living Centres visits
NZ 12 months to June 2021
5 CENTRES
Christchurch
Half Year Results 2021 11Customer Initiatives
Enhancing Customer “tbd”
Engagement PETER ALLEN CEO
We continue to give customers more reasons to
engage, more often and for longer
We’re expanding the Westfield ecosystem – creating more
opportunities for interaction between Scentre Group, our
customers and business partners
Half Year Results 2021 12Scan to Join
Westfield Plus
Introducing Westfield Plus
Our membership program
Designed to drive value for our customers by removing friction in
centre, personalising communications and rewarding engaged
members with exclusive benefits
Live in all 42 Westfield Living Centres
1.9 million members
We have welcomed an additional 1.4 million new
members with high levels of member engagement.
“I love the new Westfield Plus App, everything I need to know at my “So so so happy with the number of customers coming in for the offer.
fingertips. There are some great offers as well” I'm glad I finish at 4pm, because it's going to be really busy tonight with the offer”
Westfield Bondi Junction member Westfield North Lakes Retailer Half Year Results 2021 13
Half Year Results 2021 13Westfield Direct
Aggregated Click & Collect
Following the successful pilot during 2020, we
are on track to launch Westfield Direct in the
second half of 2021.
Designed as an extension of the Westfield in-centre
experience
Offering customers aggregated click & collect
through our Living Centres from a wide range of
businesses
Integrated with Westfield Plus to offer members a
range of benefits
Half Year
Full Year Results
Results2020
2021 14
Half Year Results 2021 14Development Activity
Total Completion
Project Cost SCG Share
$m $m
Active Projects
Mt Druitt 55 28 Q1 2022
Total Projects 55 28
3rd Party Design and Construction
101 Castlereagh Street residential and commercial project on behalf of Cbus Property 2023
Total Special Projects 25 25
Future Developments > 4,500
Half Year Results 2021 15Future Developments
Albany (NZ)
> $4.5bn
1
2 Barangaroo (NSW)
3 Booragoon (WA) Future Developments
4 Doncaster (VIC)
5 Eastgardens (NSW)
6 Knox (VIC)
7 Liverpool (NSW)
8 Marion (SA)
1
10
3 9
9 Sydney (NSW) 8 7
2
5
10 Warringah Mall (NSW) 4
6
Half Year Results 2021 16We are a Responsible, Sustainable Business
Open & Safe Delivered $4.88 million Customer First
Westfield living centres remain open, first vaccination hub in Westfield donated to Westfield Local Heroes Leveraged customer listening tools (CX
operating with COVID Safe protocols. Chermside with provider Aspen programs since inception in 2018, Loop; Westfield IQ) and community
Our Community Medical. directly benefitting more than 489 consultation to test concepts as part of
community organisations. Donated to reimagining Westfield Knox.
Westfield Local Heroes program since
its inception in 2018, directly
benefitting more than 489 community
Employer of Choice Gold Employer Attract & Retain
organisations. Donated to Westfield
Local Heroes program since its
Invested
for Gender Equality by WGEA for the Recognised our LGBTI+ AWEI status as We continue
inception to focus
in 2018, on attracting
directly and
benefitting in our culture and capabilities by
Our People fourth consecutive year. a ‘Gold’ employer, one of 20 in retaining diverse and
more than 489 community high performing piloting and implementing “Thrive” a
Australia. talent; Candidate NPS > 80%; retention
organisations. series of new leadership and talent
of key talent 100%. programs.
Committed Plan Our NZ Portfolio Leadership Global Sector Leader
to reduce carbon emissions by 50% by will be powered by 100% renewable band of CDP investor survey, A-. for Development in GRESB survey.
Our 2025 and 10% incrementally to 2030. electricity from January 2022
Environmental
Impact
Provided Signatory Cash surplus Improved
cash flow support to our small and of the Australian Supplier Payment $488 million for the 6-month period, our ESG credentials.
Our Economic medium businesses impacted by Code, paying all suppliers within 30 with net operating cashflows growing ACSI rated our quality of reporting as
Performance COVID lockdowns. days of receiving a correct invoice. 113.2 per cent on same period last year. ‘leading’. MSCI Rating Improved to A.
Sustainalytics Rating in Top 1 per cent
globally.
Half Year Results 2021 17Operating Profit and FFO
6 months to 6 months to Change
Funds From Operations
30 Jun 2021 30 Jun 2020
$m
Property revenue 1,136.6 1,139.9
Property expenses (258.9) (249.4)
Expected Credit Charge (44.5) (232.1)
Net Operating Income 833.2 658.4 26.5%
Management income 23.1 20.9
Income 856.3 679.3 26.1%
Overheads (40.4) (41.9)
EBIT 815.9 637.4 28.0%
Net interest (excluding subordinated notes coupon) (215.6) (250.0)
Tax (22.3) (11.6)
Minority interest (19.4) (15.0)
Subordinated notes coupon (98.5) -
Operating Profit 460.1 360.8
Operating Profit per security (cents) 8.88 6.94 28.0%
Project income 4.6 1.6
Tax on Project income (1.3) (0.5)
Project Income after Tax 3.3 1.1
Funds From Operations 463.4 361.9
Funds From Operations per Security (cents) 8.94 6.96 28.4%
Weighted average number of securities (million) 5,184.2 5,196.0
Half Year Results 2021 18Assets Under Management
The Group manages 42 Westfield Living Centres, with $50 billion
of assets under management including $16 billion of 3rd party funds
$15.8b
JV Partners Scentre Group has perpetual management rights on these assets.
The total annual management fees are approximately $160 million
$50.1b
Total AUM The value of these property management fees at the average
capitalisation rate of the portfolio is $3.27 billion
$34.3b
SCG
Half Year Results 2021 19Financial Position
$m 30 Jun 2021 31 Dec 2020
Total Balance Sheet Assets1 35,241.2 35,285.3
Borrowings2 (9,397.8) (9,253.8)
Other (2,089.4) (2,326.2)
Minority Interest (787.4) (778.7)
Subordinated Notes3 (4,109.6) (4,109.6)
Net Balance Sheet Assets - attributable to ordinary securityholders 18,857.0 18,817.0
Net Balance Sheet Assets – per security4 $3.64 $3.63
Value of Property Management 5 3,270 3,270
Net Asset Value – per security4 $4.27 $4.26
1. Total assets excluding cash, short term deposits at bank and currency derivative receivables
2. Adjusted for cash, short term deposits at bank and net currency derivatives
3. Adjusted for net currency derivatives
4. No value has been ascribed to the Westfield Brand and the Development, Design & Construction platform
Half Year Results 2021 20
5. Property management fees valued at the capitalisation rate of each asset, this is not included in the Balance Sheet of the GroupFunding
30 June 2021
Funding
Borrowings $9.4bn 3.3x $5.7bn
Gearing 27.9% Interest Cover Liquidity
Weighted average debt maturity 4.5 years
Subordinated notes $4.1bn
Liquidity
Weighted average interest rate1
$5.7bn
4.8%
12.0% 55%
Interest rate exposure hedged percentage 55% FFO to Debt Interest
rate hedged
Investment grade credit ratings
5.5x
Standard & Poor’s A (Stable)
Fitch A (Stable)
Moody’s A2 (Stable)
Debt to EBITDA
Half Year Results 2021 21
1. Reflects net debt and subordinated notesFunding
Available liquidity of $5.7 billion, sufficient to cover all debt maturities to early 2024
Debt Maturity Profile1 % $bn
$ billion Senior Bonds
3.5 USD 22% 4.3
3.0 EUR 20% 3.9
GBP 8% 1.5
2.5 HKD 1% 0.1
2.0 Total 51% 9.8
Bank Facilities
1.5 Drawn 5% 0.9
Undrawn 23% 4.5
1.0
Total 28% 5.4
0.5 Total Debt Facilities 79% 15.2
Subordinated Notes
0.0
2021 2022 2023 2024 2025 2026 2027 2028 2029 2030 + USD 21% 4.1
Total Funding 100% 19.3
Senior Bonds Bank Undrawn Facilities
Less Drawn Facilities (14.8)
4.5 years weighted average debt maturity
Plus Cash and Short Term Deposits
Total Liquidity
1.2
5.7
Half Year Results 2021 22
1. Does not include the subordinated notes given their equity-like characteristicsOutlook
The Group continues to target a distribution of 14 cents per security for the year to 31 December 2021.
This is based on the assumption that the current government restrictions substantially ease by the end of
October 2021.
Half Year Results 2021 23Appendices
Westfield Coomera, QLDProfit & FFO
Statutory Profit FFO Financial
Reconciliation from Profit to FFO 6 months to FFO 6 months to Statement
$m 30 Jun 2021 Adjustments1 30 Jun 2021 Notes
1. The Group’s measure of FFO is based upon the
A B C=A+B National Association of Real Estate Investment Trusts’
(NAREIT, a US industry body) definition, adjusted to
Property revenue2 1,109.3 27.3 1,136.6 Note 2(iii) reflect the Group’s profit after tax and non controlling
interests reported in accordance with the Australian
Property expenses (258.9) - (258.9) Note 2(iii) Accounting Standards and International Financial
Expected Credit Charge (44.5) - (44.5) Note 2(iii) Reporting Standards and excludes straightlining of
rent. FFO adjustments relate to property revaluations,
Net Operating Income 805.9 27.3 833.2 mark to market of interest rate and currency
derivatives, mark to market of other financial liabilities,
Management income3 23.1 - 23.1 modification gain or loss on refinanced borrowing
facilities, tenant allowance amortisation, straightlining
Income 829.0 27.3 856.3 of rent, deferred tax expense/benefit and gain or loss
Overheads (40.4) - (40.4) Note 2(v) in respect of capital transactions.
2. Property revenue of $1,109.3m (Note 2(iii)) plus
Revaluations 41.0 (41.0) - Note 2(v) amortisation of tenant allowances of $31.2m (Note
EBIT 2(iii)) less straightlining of rent of $3.9m (Note 2(iii)) =
829.6 (13.7) 815.9
$1,136.6m.
Net interest (excluding subordinated notes coupon)4 (267.9) 52.3 (215.6) 3. Management income $28.7m (Note 2(v)) less
management expenses $5.6m (Note 2(v)) = $23.1m.
Currency derivatives (14.4) 14.4 - Note 2(v)
4. Financing costs $385.6m (Note 2(v)) offset by interest
Tax (25.2) 2.9 (22.3) Note 2(v) income $3.5m (Note 2(v)), less coupon on
subordinated notes of $98.5m (Note 12), interest
Minority interest5 (26.5) 7.1 (19.4) expense on other financial liabilities $14.8m (Note 12),
Subordinated notes coupon (98.5) - (98.5) Note 2(v) net fair value loss on other financial liabilities of
$0.9m (Note 12), mark to market loss on interest rate
Operating Profit 397.1 63.0 460.1 derivatives of $50.3m (Note 12) and net modification
loss on refinanced borrowing facilities of $2.0m (Note
Project income6 4.6 - 4.6 12) = $215.6m.
Tax on Project income (1.3) - (1.3) Note 2(v) 5. Gain attributable to minority interest $10.8m (Note
2(v)) less non-FFO items of $6.2m, plus interest
Project income after tax 3.3 - 3.3 expense on other financial liabilities $14.8m (Note 12)
= $19.4m.
Statutory Profit / Funds From Operations 400.4 63.0 463.4
6. Project income $56.5m (Note 2(v)) less project
expenses $51.9m (Note 2(v)) = $4.6m.
Half Year Results 2021 25Cash Flow
Cash flows from operating activities – proportionate Equity 6 months to 6 months to
$m Consolidated Accounted 30 Jun 2021 30 Jun 2020
Receipts in the course of operations (including GST) 1,257.7 126.2 1,383.9 1,059.4
Payments in the course of operations (including GST) (379.2) (36.8) (416.0) (431.8)
Net operating cash flows from equity accounted entities 65.8 (65.8) - -
Income and withholding taxes paid (32.3) (6.0) (38.3) (21.1)
GST paid (92.8) (7.9) (100.7) (110.4)
Payments of financing costs (excluding interest capitalised) (335.0) (9.7) (344.7) (269.3)
Interest received 3.5 - 3.5 1.9
Net cash flows from operating activities - proportionate 487.7 - 487.7 228.7
Half Year Results 2021 26Balance Sheet
Balance Sheet – Proportionate1
Equity Debt
$m Consolidated Accounted 30 Jun 2021 Reclassification 30 Jun 2021
1. Period end AUD/NZD exchange rate
A B C = A +B 1.0741 at 30 Jun 2021
Cash 406.8 27.0 433.8 (433.8) - 2. Includes $613.6m of Property Linked
Short term deposits at bank 805.9 - 805.9 (805.9) - Notes shown in minority interest given
Property Investments their equity characteristics, and $173.8m
relating to Carindale Property Trust
– Shopping centres 30,818.1 2,820.2 33,638.3 - 33,638.3
– Development projects and construction in progress 563.2 71.0 634.2 - 634.2
Total Property Investments 31,381.3 2,891.2 34,272.5 - 34,272.5
Equity accounted investments 2,765.1 (2,765.1) - - -
Deferred tax assets 25.3 0.9 26.2 - 26.2
Currency derivative receivables 329.3 - 329.3 (329.3) -
Other assets 932.5 10.0 942.5 - 942.5
Total Assets 36,646.2 164.0 36,810.2 (1,569.0) 35,241.2
Borrowings (10,638.2) - (10,638.2) 1,240.4 (9,397.8)
Lease liabilities (125.5) (0.3) (125.8) - (125.8)
Deferred tax liabilities (87.1) (82.5) (169.6) - (169.6)
Currency derivative payables (449.9) - (449.9) 449.9 -
Other liabilities (1,712.8) (81.2) (1,794.0) - (1,794.0)
Minority interest 2 (787.4) - (787.4) - (787.4)
Subordinated notes (3,988.3) - (3,988.3) (121.3) (4,109.6)
Net Assets – attributable to members of Scentre Group 18,857.0 - 18,857.0 - 18,857.0
Half Year Results 2021 27Interest Rate Hedging
30 June 2021
Hedge Maturity Profile Interest Rate Hedging
$ billion
$bn Fixed Rate
8.0
2.06%
Borrowings 9.40
1.96% 1.72%
Subordinated notes 4.11
6.0 1.48%
1.40% Fixed Rate Debt
4.0 1.11%
$ Fixed rate debt1 0.03 3.81%
2.0 1.22% Derivatives
$ Swap payable 7.44 2.06%
0.0
Jun-21 Dec-21 Dec-22 Dec-23 Dec-24 Dec-25 Dec-26 Dec-27
$ Swap Payable $ Fixed Rate Debt
Total Hedged 7.47 2.06%
3.7 Years weighted average hedge maturity 55% Hedged at 30 June 2021
1. Excludes borrowing margin Half Year Results 2021 28Retailer In-Store Sales
Growth over 20191
Total Majors and Specialty in-store sales were up 0.9% for the 6 months to June and 0.8% lower for the year compared to 20191, 2
Specialty in-store sales were up 2.3% for the 6 months and 0.8% lower for the year.
Majors in-store sales were 1.3% lower for the 6 months and 0.6% lower for the year.
Total Portfolio 6 months to 12 Months to
Days of Govt Sales by Category 30 Jun 2021 30 Jun 2021
Total Portfolio Restrictions to 6 months to 12 Months to Retail Services 12.9% 14.7%
Sales by Region 30 Jun 20213 30 Jun 2021 30 Jun 2021
Leisure & Sports 15.4% 13.2%
NSW 15 (4.6%) (4.3%) Food Retail (3.7%) (3.6%)
Dining (4.3%) (10.6%)
QLD 8 6.9% 9.0%
Health & Beauty (1.3%) (3.5%)
VIC 19 (5.2%) (18.1%) Fashion 1.5% (2.0%)
Footwear (4.4%) (7.8%)
WA 10 5.4% 9.2% Jewellery 0.7% (2.3%)
SA 0 6.1% 6.5% Technology & Appliances 9.7% 6.3%
General Retail (8.0%) (11.6%)
ACT 0 6.4% 4.9% Homewares 6.7% 5.3%
NZ 7 24.6% 23.3% Supermarkets (2.5%) 1.1%
Department Stores (6.3%) (12.5%)
Total 0.9% (0.8%) Discount Department Stores 6.8% 7.8%
1. Excludes Cinemas and Travel categories, which continue to be affected by COVID restrictions.
2. Including Cinemas and Travel, total in-store sales were 5.1% lower for the 6 months to June and 6.5% lower for the year
3. For the six months to Jun 2021 Half Year Results 2021 29Property Valuations
30 June 2021
AUSTRALIA (A$m) Ownership Book Value Retail Cap Rate Economic Yield AUSTRALIA (A$m) Ownership Book Value Retail Cap Rate Economic Yield
AUSTRALIAN CAPITAL TERRITORY VICTORIA
Belconnen 100% 772.0 5.75% 6.14% Airport West 50% 182.5 5.85% 6.77%
Woden 50% 305.0 5.75% 6.53% Doncaster 50% 1,115.5 4.50% 5.09%
Fountain Gate 100% 1,920.0 4.50% 4.81%
NEW SOUTH WALES Geelong 50% 213.0 6.00% 6.96%
Bondi Junction 100% 3,105.2 4.25% 4.50% Knox 50% 425.0 5.50% 6.41%
Burwood 50% 522.8 4.75% 5.41% Plenty Valley 50% 250.0 5.25% 6.09%
Chatswood 100% 1,295.6 4.50% 4.80% Southland 50% 712.5 5.00% 5.70%
Eastgardens 50% 592.5 4.50% 5.08%
Hornsby 100% 1,055.4 5.25% 5.60% WESTERN AUSTRALIA
Hurstville 50% 406.5 5.25% 6.00% Booragoon 50% 475.0 5.00% 5.70%
Kotara 100% 870.0 5.50% 5.87% Carousel 100% 1,405.0 4.75% 5.10%
Liverpool 50% 487.7 5.25% 5.97% Innaloo 100% 291.0 6.00% 6.52%
Miranda 50% 1,165.5 4.50% 5.07% Whitford City 50% 250.0 6.00% 7.01%
Mt Druitt 50% 303.5 5.50% 6.29%
TOTAL AUSTRALIA 32,182.1 4.83%1 5.28%
Parramatta 50% 1,016.9 4.50% 5.14%
Penrith 50% 650.0 5.00% 5.68% NEW ZEALAND (NZ$m)
Sydney 100% 4,039.4 4.30% 4.57% Albany 51% 286.9 6.00% 6.85%
Tuggerah 100% 720.0 5.63% 6.01% Manukau 51% 188.7 6.75% 7.75%
Warringah Mall 50% 840.0 5.00% 5.64% Newmarket 51% 589.7 5.50% 6.03%
Riccarton 51% 289.7 6.75% 7.65%
QUEENSLAND
St Lukes 51% 209.1 6.38% 7.29%
Carindale 50% 750.1 5.00% 5.69%
Chermside 100% 2,521.0 4.50% 4.78% TOTAL NEW ZEALAND (NZ$m) 1,564.1 6.10%1 6.86%
Coomera 50% 195.0 5.75% 6.57%
Garden City 100% 1,490.0 5.00% 5.34% TOTAL SCENTRE GROUP (A$m) 33,638.3 4.89%1 5.35%
Helensvale 50% 195.0 6.00% 6.87%
North Lakes 50% 460.0 5.00% 5.71%
SOUTH AUSTRALIA
Marion 50% 638.0 5.25% 6.06%
1. Weighted average cap rate including non-retail assets
Tea Tree Plaza 50% 348.0 5.50% 6.42%
West Lakes 50% 197.5 6.25% 7.32%
Half Year Results 2021 30Important Notice
All amounts in Australian dollars unless otherwise specified. The financial information included in SCENTRE GROUP LIMITED
ABN 66 001 671 496
this document is based on the Scentre Group’s IFRS financial statements. Non IFRS financial
information included in this document has not been audited or reviewed. This document contains
SCENTRE MANAGEMENT LIMITED
forward-looking statements, including statements regarding future earnings and distributions that ABN 41 001 670 579 AFS Licence No: 230329
are based on information and assumptions available to us as of the date of this document. Actual as responsible entity of Scentre Group Trust 1
ARSN 090 849746
results, performance or achievements could be significantly different from those expressed in, or
implied by, these forward-looking statements. These forward-looking statements are not
RE1 LIMITED
guarantees or predictions of future performance, and involve known and unknown risks, ABN 80 145 743 862 AFS Licence No: 380202
uncertainties and other factors, many of which are beyond our control, and which may cause actual as responsible entity of Scentre Group Trust 2
ARSN 146 934 536
results to differ materially from those expressed in the statements contained in this document. You
should not place undue reliance on these forward-looking statements. Except as required by law or
RE2 LIMITED
regulation (including the ASX Listing Rules) we undertake no obligation to update these forward- ABN 41 145 744 065 AFS Licence No: 380203
looking statements. as responsible entity of Scentre Group Trust 3
ARSN 146 934 652
Half Year Results 2021 31You can also read