GWAS identifies an ortholog of the rice D11 gene as a candidate gene for grain size in an international collection of hexaploid wheat - Nature
←
→
Page content transcription
If your browser does not render page correctly, please read the page content below
www.nature.com/scientificreports
OPEN GWAS identifies an ortholog
of the rice D11 gene
as a candidate gene for grain
size in an international collection
of hexaploid wheat
Honoré Tekeu1,2,5, Eddy L. M. Ngonkeu4,5, Sébastien Bélanger2,3, Pierre F. Djocgoué5,
Amina Abed1,2, Davoud Torkamaneh1,2,6, Brian Boyle2, Patrick M. Tsimi5, Wuletaw Tadesse7,
Martine Jean1,2 & François Belzile1,2*
Grain size is a key agronomic trait that contributes to grain yield in hexaploid wheat. Grain length and
width were evaluated in an international collection of 157 wheat accessions. These accessions were
genetically characterized using a genotyping-by-sequencing (GBS) protocol that produced 73,784
single nucleotide polymorphism (SNP) markers. GBS-derived genotype calls obtained on Chinese
Spring proved extremely accurate when compared to the reference (> 99.9%) and showed > 95%
agreement with calls made at SNP loci shared with the 90 K SNP array on a subset of 71 Canadian
wheat accessions for which both types of data were available. This indicates that GBS can yield a large
amount of highly accurate SNP data in hexaploid wheat. The genetic diversity analysis performed
using this set of SNP markers revealed the presence of six distinct groups within this collection. A
GWAS was conducted to uncover genomic regions controlling variation for grain length and width. In
total, seven SNPs were found to be associated with one or both traits, identifying three quantitative
trait loci (QTLs) located on chromosomes 1D, 2D and 4A. In the vicinity of the peak SNP on
chromosome 2D, we found a promising candidate gene (TraesCS2D01G331100), whose rice ortholog
(D11) had previously been reported to be involved in the regulation of grain size. These markers will be
useful in breeding for enhanced wheat productivity.
The grain size, which is associated with yield and milling quality, is one of the essential traits that have been
subject to selection during domestication and breeding in hexaploid w heat1. During the domestication process
from ancestral (Einkorn) to common wheat (Triticum aestivum L.) going through tetraploid species, wheat
abruptly changed, from a grain with greater variability in size and shape to grain with higher width and lower
length2,3. However, grain yield is determined by two components namely, the number of grains per square meter
and grain weight. Following, grain weight is estimated by grain length, width, and area, which are components
showing higher heritability than mainly yield in wheat4.
Larger grains may have a positive effect on seedling vigor and contribute to increased yield5. Geometric
models have indicated that changes in grain size and shape could result in increases in flour yield of up to 5%6.
Consequently, quantitative trait loci (QTLs) or genes governing grain shape and size are of interest for domesti-
cation and breeding p urposes7,8. Many genetic mapping studies have reported QTLs for grain size and shape in
wheat cultivars1,2,8–10 and some studies have revealed that the D genome of common wheat, derived from Aegilops
tauschii, contains important traits of interest for wheat breeding11,12.
1
Département de Phytologie, Université Laval, Quebec City, QC, Canada. 2Institut de Biologie Intégrative et des
Systèmes, Université Laval, Quebec City, QC, Canada. 3Donald Danforth Plant Science Center, St. Louis, MO,
USA. 4Institute of Agricultural Research for Development, Yaoundé, Cameroon. 5Department of Plant Biology,
University of Yaoundé I, Yaoundé, Cameroon. 6Department of Plant Agriculture, University of Guelph, Guelph,
ON, Canada. 7International Center for Agricultural Research in the Dry Areas (ICARDA), Beirut, Lebanon. *email:
francois.belzile@fsaa.ulaval.ca
Scientific Reports | (2021) 11:19483 | https://doi.org/10.1038/s41598-021-98626-0 1
Vol.:(0123456789)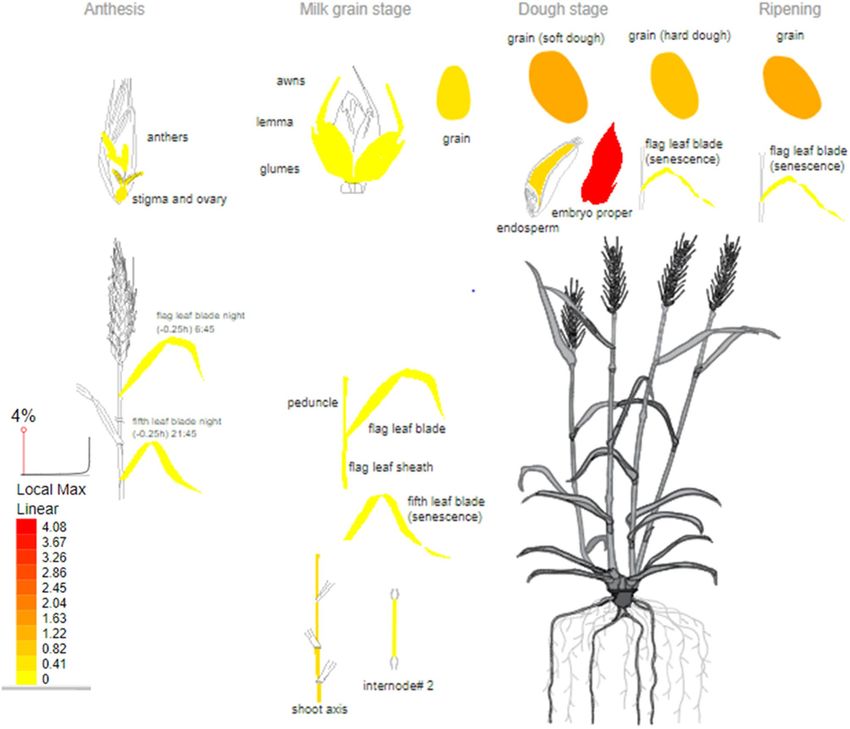
www.nature.com/scientificreports/
Range F-values
Traits Unit Min Max Mean ± SD h2 Genotype (G) Environment (E) G×E
Gle mm 1.22 8.55 3.28 ± 1.42 90.6 10.7*** 36.9 1.1
Gwi mm 0.45 3.45 1.77 ± 0.88 97.9 48.6*** 11.5 1.3
Gwe g 6.25 117.38 36.17 ± 21.7 61.6 30.9*** 15.7** 2.6*
Gyi t/ha 0.42 7.83 2.30 ± 1.44 56.0 66.3*** 174.9*** 2.2*
Table 1. Descriptive statistics, broad sense heritability (h2) and F-value of variance analysis for four agronomic
traits in a collection of 157 wheat lines. SD Standard deviation, h2 Broad sense heritability, Gle Grain length,
Gwi Grain width, Gwe 1000-grain weight, Gyi Grain yield. ***, ** and *: significant at p < 0.001, p < 0.01, and
p < 0.05, respectively.
At the genomic level, Okamoto et al.13 performed QTL analyses for grain size and shape-related traits using
four synthetic wheat F2 populations to identify the genetic loci responsible for grain size and shape variation in
hexaploid wheat and found QTLs for grain length and width on chromosomes 1D and 2D. This is particularly
interesting as the tenacious glume gene Tg-D1 on chromosome 2D is a well-known locus that has been recruited
for the domestication of wheat grain size and shape. During allohexaploid wheat speciation, a dramatic change
in grain shape occurred due to a mutation in the Tg-D1 gene14. Furthermore, Yan et al.15 reported a genomic
region associated with grain size on chromosome 2D.
New advances in genomics technologies has revolutionized research in plants by developing new high
throughput genotyping methods to increase knowledge of the genetic basis of diversity in large core collection
of genetic materials through genome-wide association studies (GWAS). Based on such high-density SNP mark-
ers, GWAS can be used for the description and high-resolution mapping of genetic variance from collections of
genetic ressources that have derived from several historical recombination c ycles16. Furthermore, Genotyping-
by-sequencing (GBS) is a Next-Generation Sequencing (NGS) technology for high-throughput and cost-effective
genotyping, that provides a great potential for applying GWAS to reveal the genetic bases of agronomic traits in
wheat17. Arora et al.18 conducted GWAS in a collection of Ae. tauschii accessions for grain traits, using SNP mark-
ers based on GBS. They identified a total of 17 SNPs associated with granulometric characteristics distributed
over all seven chromosomes, with chromosomes 2D, 5D, and 6D harboring the most important marker-trait
associations. On the other hand, most studies on germplasm of hexaploid wheat have focused on understanding
the genetic and morphological diversity of this species. No studies have used GWAS based on GBS for economi-
cally important and essential grain yield components traits such as grain length and width in an international
collection of hexaploid wheat. The present investigation aimed to identify QTLs and candidate genes governing
grain length and width in an international collection of hexaploid wheat using a GBS-GWAS approach.
Results
Phenotypic characterization of grain yield components. To explore components of grain yield
in wheat, we measured four phenotypes: grain length (Gle), grain width (Gwi), 1000-grain weight (Gwe) and
grain yield (Gyi) over two years at two sites. Those phenotypes are referring only to the international panel of
wheat and do not include the Canadian accessions. As shown in Table 1, means (± standard deviation) observed
for these traits corresponded to: 3.28 mm (± 1.42) for grain length, 1.77 mm (± 0.88) for grain width, 36.17 g
(± 21.77) for 1000-grain weight and 2.30 t/ha (± 1.44) for grain yield. The broad-sense heritability estimates were
90.6% for grain length, 97.9% for grain width, 61.6% for 1000-grain weight and 56.0% for grain yield. An analysis
of variance revealed significant differences due to genotypes (G) for all traits and, for two traits (Gwe and Gyi),
the interaction between genotype and environment (GxE) proved significant. A correlation analysis showed a
high significant positive correlation between grain yield and grain weight (r = 0.94; p < 0.01) and also between
grain length and grain width (r = 0.84; p < 0.01). Also, significant positive correlations were identified between
grain yield and grain length (r = 0.50; p < 0.01) and between grain yield and grain width (r = 0.43; p < 0.01). Inter-
estingly, a bimodal distribution was observed for grain length and width (Fig. 1). Together, these results suggest
that a major gene controls two important characters related to grain size with a high heritability within this
collection.
In examining the relationship between 1000-grain weight and grain length/width using bagplots on the col-
lection of 159 accessions, no outliers were found when considering the relationship between grain weight and
width. In contrast, two accessions (Attila3, Babax8) were indeed detected as outliers when comparing grain
weight and length (Supplementary Fig. S1). In the later steps (analysis of population structure and GWAS) we
excluded these two accessions considered to be outliers.
Genome‑wide SNP marker discovery and validation. To genetically characterize our wheat collec-
tion and study the genetic determinants of grain size, we used a double digestion (PstI/MspI) GBS approach
to genotype this collection. Overall, 77,124 and 73,784 SNPs were discovered for the set of 71 Canadian wheat
accessions and 157 exotics wheat accessions, respectively.
To assess the reproducibility and accuracy of genotypes called via the GBS approach, we genotyped 12 differ-
ent plants of CS (i.e. biological replicates), which were added to the set of 288 wheat samples for SNP calling and
bioinformatics analysis. Sequence reads of the full set of 300 wheat samples obtained from GBS were analyzed
following the standard steps of SNP calling and bioinformatics analysis described below. This yielded a total of
Scientific Reports | (2021) 11:19483 | https://doi.org/10.1038/s41598-021-98626-0 2
Vol:.(1234567890)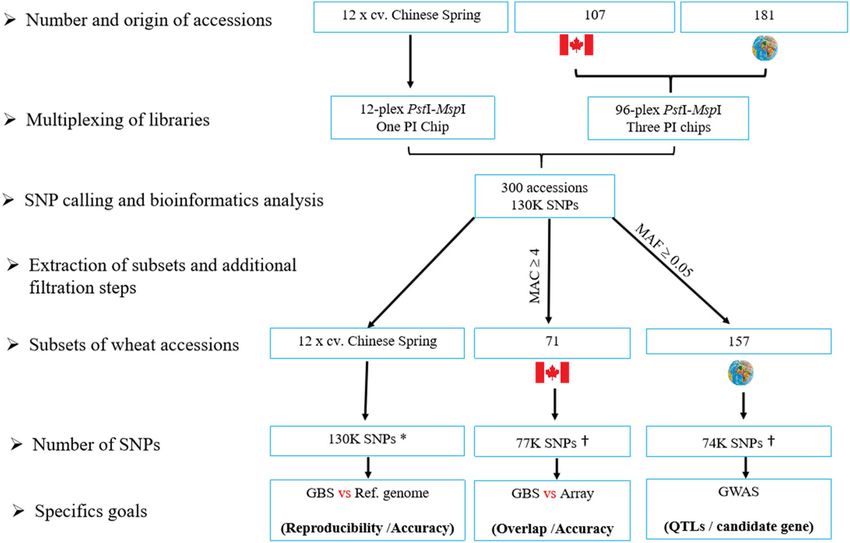
www.nature.com/scientificreports/

                                  Figure 1.  Distribution of phenotypes for grain length (upper left), grain width (upper right), grain weight
                                  (bottom left) and grain yield (bottom right). Histograms are based on the average trait value of each wheat line
                                  across the different environments. The bars under the histograms represent the density of individuals. Those
                                  phenotypes are referring only to the international panel of wheat and do not include the Canadian accessions.

                                  129,940 loci that were used for the assessment of accuracy and reproducibility of SNP calls. For each individual
                                  plant of CS, the GBS calls were compared between replicates and with the Chinese Spring reference genome (at
                                  the corresponding positions).
                                      On the non-imputed data, we detected a very high level of concordance (99.9%) between the genotypes of
                                  each CS individual and the reference alleles for the 1,196,184 called genotypes ([130 K SNPs × 12 samples]—miss-
                                  ing data; Supplementary Fig. S2). Among those 12 biological replicates of CS, we found a very high reproduc-
                                  ibility of genotype calls, as the pairwise identity of genetic distance calls varied from 1.56E−04 to 5.08E−04, with
                                  an average of 2.86E−04. In order to ensure about identity of each CS plant, we have found that this value between
                                  the individual w56_Guelph (Canadian wheat variety) and each of the CS plant is greater than 0.1.
                                      After imputation of the missing genotype calls, we observed a mean concordance of 93.8% between the CS
                                  individuals and the CS reference genome. Furthermore, 76.7% of genotypes were called initially and 23.3% of
                                  genotypes were imputed. It should be noted that the accuracy rate for imputing missing data is 73.4%. More
                                  details of SNP data set are provided in supplementary Table S1.
                                      As a further examination of data quality, we compared the genotypes called using both GBS and a SNP array
                                  on a subset of 71 Canadian wheat accessions that had been previously genotyped using the 90 K SNP array.
                                  A total of 77,124 GBS-derived and 51,649 array-derived SNPs were discovered in these 71 accessions (Sup-
                                  plementary Table S2). Of these, only 135 SNP loci were common to both platforms and among these potential
                                  9,585 datapoints (135 loci × 77 lines), only 8,647 genotypes could be compared because the remaining 938
                                  genotypes were missing in the array-derived data. As shown in Fig. 2, a high level of concordance (95.1%) was
                                  seen between genotypes called by both genotyping approaches. To better understand the origin of discordant
                                  genotypes (4.9%), we inspected the set of 429 discordant SNP calls and observed that: (1) 3.5% of discordant
                                  calls corresponded to homozygous calls of the opposite allele by the two technologies; and (2) 1.4% of discord-
                                  ant calls were genotyped as heterozygous by GBS while they were scored as homozygous using the 90 K SNP
                                  array. More details are provided in Supplementary Table S3. From these comparisons, we conclude that GBS is a
                                  highly reproducible and accurate approach for genotyping in wheat and can yield a greater number of informa-
                                  tive markers than the 90 K array.

Scientific Reports |   (2021) 11:19483 |               https://doi.org/10.1038/s41598-021-98626-0                                                    3

                                                                                                                                               Vol.:(0123456789)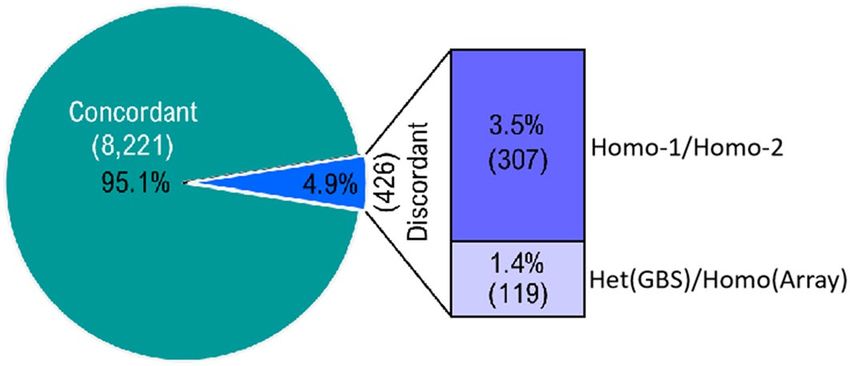
www.nature.com/scientificreports/
Figure 2. Concordance of genotype calls made using both marker platforms (GBS and 90 K SNP Array). GBS-
derived SNP genotypes were compared to the genotypes called at loci in common with the 90 K SNP Array for
the same 71 wheat samples.
Wheat genome
Chromosomes A (*) B (*) D (*) Total
1 6099 (0.36) 8115 (0.48) 2607 (0.15) 16,821 (0.13)
2 8111 (0.35) 11,167 (0.48) 3820 (0.17) 23,098 (0.18)
3 6683 (0.33) 10,555 (0.53) 2759 (0.14) 19,997 (0.15)
4 6741 (0.58) 4007 (0.34) 913 (0.08) 11,661 (0.09)
5 6048 (0.38) 8015 (0.51) 1719 (0.11) 15,782 (0.12)
6 5995 (0.33) 10,040 (0.55) 2191 (0.12) 18,226 (0.14)
7 10,429 (0.43) 9945 (0.41) 3981 (0.16) 24,355 (0.19)
Total 50,106 61,844 17,990 129,940
Table 2. Distribution of SNP markers across the A, B and D genomes. *Proportion of markers on a
homoeologous group of chromosomes that were contributed by a single sub-genome.
Genome coverage and population structure. For the full set of accessions, a total of 129,940 SNPs was
distributed over the entire hexaploid wheat genome. The majority of SNPs were located in the B (61,844) and A
(50,106) sub-genomes compared to the D (only 17,990 SNPs) sub-genome (Table 2). Although the number of
SNPs varied two to threefold from one chromosome to another within a sub-genome, a similar proportion of
SNPs was observed for the same chromosome across sub-genomes. Typically, around half of the markers were
contributed by the B sub-genome (47.59%), 38.56% by the A sub-genome and only 13.84% by the D sub-genome.
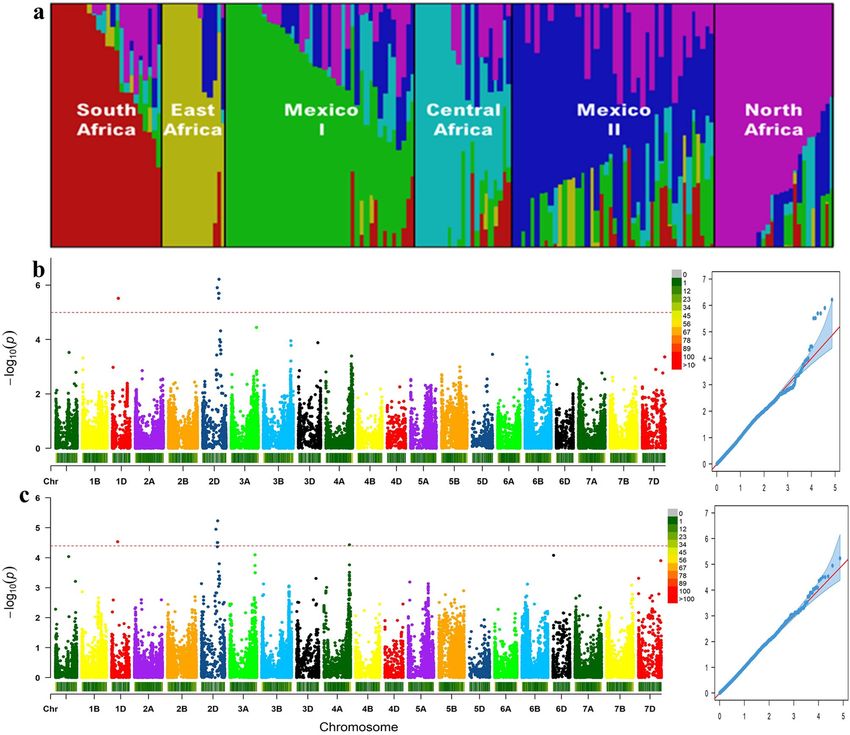
The analysis of population structure for the accessions of the association panel showed that K = 6 best cap-
tured population structure within this set of accessions and these clusters largely reflected the country of origin
(Fig. 3). The number of wheat accessions in each of the six subpopulations ranged from 6 to 43. The largest
number of accessions was found in northwestern Baja California (Mexico) represented here by Mexico 1 (43)
and the smallest was observed in East and Central Africa (6).
GWAS analysis for marker‑trait associations for grain size. To identify genomic loci contributing to
grain size in wheat, we performed a GWAS analysis on 157 accessions (excluding the two accessions considered
to be outliers) and 73,784 SNPs. As seen in Fig. 3, both Q–Q plots suggest that the confounding effects of popu-
lation structure and relatedness were well controlled. For both traits, the greatest marker-trait associations were
detected at the end of chromosome 2D, while another weaker association was shared at the beginning of chro-
mosome 1D. For grain width only, a marker-trait association was detected on chromosome 4A. In total, seven
SNPs were found to be associated with one or both traits, with respectively one, five and one significant SNPs
being located on chromosomes 1D, 2D and 4A. Except for two SNPs (chr2D:442798939 and chr4A:713365388),
all other SNPs were significant for both grain length and grain width. The SNP at 4A:713365388 was significant
only for grain width while the SNP at 2D:442798939 was significant only for grain length.
The most significant association was observed on chromosome 2D and contributed to both grain length and
grain width (Table 3, Fig. 3). For this QTL, a total of four SNPs was observed and the SNP most significantly asso-
ciated to both traits was located at position 2D:452812899. A fifth SNP located at 2D:442798939 was significantly
associated to grain length only, but was just below the significance threshold (p-value = 4.34E−05) for grain width.
A high degree of LD was detected among some of the seven SNPs from chromosome 2D displaying asso-
ciation with grain traits. These formed one discontinuous linkage block as the LD between markers belong-
ing to this block was higher (mean of r 2 = 0.90). For this reason, we considered these to define one quanti-
tative trait locus (QTL) on chromosome 2D (Supplementary Fig. S3). This QTL included 5 SNP markers
(chr2D:403935865, chr2D:442798939, chr2D:444560418, chr2D:452644656 and chr2D:452812899) and the peak
SNP (chr2D:452812899) explained between 7 and 13% of the phenotypic variation for grain length and width.
Scientific Reports | (2021) 11:19483 | https://doi.org/10.1038/s41598-021-98626-0 4
Vol:.(1234567890)www.nature.com/scientificreports/
Figure 3. Population structure of 157 hexaploid wheat cultivars and genome-wide association studies of grain
traits (a). Manhattan and Q–Q plots indicate the degree of association between SNPs and grain length (b) or
grain width (c). Population structure plot and Manhattan/Q-Q plots were generated using fastSTRUCTURE
version 1.0 (https://rajanil.github.io/fastStructure/) and GAPIT version 2 (https://pubmed.ncbi.nlm.nih.gov/
27898829/), respectively.
The minor allele frequency (MAF) at this locus was 0.31 and exerted an allelic effect from − 0.81 to − 0.35 mm
(Table 3).
On chromosome 1D, the SNP marker chr1D:166874041 defined a QTL for both grain length and width.
The percentage of phenotypic variation explained by this marker for grain length and width was 11% and 6%
respectively, with a MAF of 0.30 and allelic effects of 0.76 and 0.33 mm for grain length and width, respectively.
Furthermore, a high degree of interchromosomal LD was observed among the peak SNPs between chromosomes
1D and 2D ( r2 = 0.94) displaying association with grain traits. In addition, almost all accessions which have the
major allele on chromosome 1D are the same which have the major allele on chromosome 2D. Thus, the com-
bined impact of these two loci could explain the observed bimodal distribution.
On chromosome 4A, the SNP marker chr4A:713365388 defined a QTL for grain width only and it explained
6% of the variation, had a MAF of 0.14 and exerted an allelic effect of 0.36 mm. However, we reported a very
weak LD between this peak SNP marker and the two others on chromosomes 1D and 2D.
In summary, a total of three QTLs significantly associated with grain length and/or width were identified on
chromosomes 1D, 2D and 4A.
Candidate gene detection for grain size. To identify candidate genes contributing to grain size within
the studied wheat collection, we investigated the genes residing in the same linkage block as the peak SNP for
each QTL. On chromosome 2D, the QTL with the largest number of associated SNPs (chr2D:403935865 to
Scientific Reports | (2021) 11:19483 | https://doi.org/10.1038/s41598-021-98626-0 5
Vol.:(0123456789)www.nature.com/scientificreports/
Loci Chr Grain traits P value MAF R2 Allelic effect Alleles
Length 3.07E−06 0.30 0.11 0.76
chr1D:166874041 1D T/C
Width 2.94E−05 0.30 0.06 0.33
Length 1.25E−06 0.29 0.12 0.79
chr2D:403935865 2D T/C
Width 1.12E−05 0.29 0.07 0.34
chr2D:442798939 2D Length 3.07E−06 0.29 0.11 − 0.77 A/G
Length 2.02E−06 0.28 0.11 − 0.80
chr2D:444560418 2D A/G
Width 3.12E−05 0.28 0.06 − 0.34
Length 2.02E−06 0.28 0.11 − 0.80
chr2D:452644656 2D A/G
Width 3.12E−05 0.28 0.06 − 0.34
Length 6.15E−07 0.31 0.13 − 0.81
chr2D:452812899 2D A/G
Width 5.89E−06 0.31 0.07 − 0.35
chr4A:713365388 4A Width 3.74E−05 0.14 0.06 0.36 A/G
Table 3. Details of loci associated with grain size traits identified via a genome-wide association study in a
collection of 157 hexaploid wheat lines. Chr Chromosome, MAF Minor allele frequency, R2 R square of model
with SNP, calculated by R2 of model with SNP minus R2 of model without SNP48.
chr2D:452811303) included a total of 315 high-confidence genes of which 66 genes are expressed during embry-
ogenesis and grain development in wheat. On chromosomes 1D and 4A, the linkage blocks harboring SNP
markers chr1D:166874041 and chr4A:713365388, each defining a QTL, did not include high-confidence genes.
Upon examination of the annotations and gene expression profile for the candidate genes, the most promising
appears to be the TraesCS2D01G331100 gene in the QTL on chromosome 2D, which is most highly expressed in
the developing embryo during embryogenesis and grain development in wheat (Fig. 4). As well, it is expressed in
both endosperm and pericarp, and was found to encode a cytochrome P450 (CYP724B1), which showed homol-
ogy to enzymes involved in brassinosteroid biosynthesis, indicating the mechanism by which seed size may be
regulated in wheat. It is an ortholog of the rice CYP724B1 gene, commonly known as the D11 gene. The D11
gene was previously reported as being involved in the regulation of internode elongation and seed development
due to its role in the synthesis of brassinosteroids, key regulators of plant growth promoting the expansion and
elongation of cells. More details are provided in Supplementary Table S4.
Haplotypes at the wheat orthologue of the rice D11 gene and their phenotypic effects. To
provide a useful breeding tool for the main QTL identified in this research, we defined SNP haplotypes around
our candidate gene. Using HaplotypeMiner, we identified two SNPs (chr2D:423365752 and chr2D:425474599,
Supplementary Fig. S4) that best captured the SNP landscape in the vicinity of the candidate gene. These mark-
ers reside in the same haplotype block as the SNP markers, but were not individually found to be significantly
associated with grain width and length. These SNP markers define three haplotypes (AT, CT or CC) around
the candidate gene, with 99, 18 and 40 individuals carrying these haplotypes, respectively. To investigate the
phenotypes associated with these haplotypes, we analyzed the trait value for each haplotype. Interestingly, we
observed that for all traits, the mean values of accessions with haplotype AT were significantly larger (p < 0.001)
than those obtained for the other haplotypes. As shown in Fig. 5, accessions carrying haplotype AT showed
mean values of 3.76 mm for grain length, 2.02 mm for grain width, 40.87 g for grain weight and 2.55 t/ha for
grain yield, compared to 2.16 mm, 1.05 mm, 26.87 g and 1.75 t/ha (respectively for grain length, width, weight
and yield) for accessions carrying haplotype CC and 1.65 mm, 0.78 mm, 26.89 g and 1.69 t/ha (respectively for
grain length, width, weight and yield) for accessions carrying haplotype CT. Furthermore, the relation between
the 3 haplotypes and the 6 groups found in the population analysis showed that the haplotype AT predominates
in the populations of Mexico 1 and North Africa (Supplementary Fig. S5, Supplementary Table S5). To conclude,
we suggest that SNP markers corresponding to haplotype AT will provide a useful tool in marker-assisted breed-
ing programs to improve wheat productivity. Therefore, we point out that the relationship between yield and
haplotypes around the D11 gene would allow the selection of high-yielding wheat lines in a breeding program.
Discussion
The goal of our study was to identify genomic regions controlling variation for grain size in an international
collection of 157 hexaploid wheat accessions through a GWAS approach. Thus, we collected the phenotypes for
three grain traits (length, width, weight) in addition to grain yield. A statistical analysis revealed that the genotype
was a major source of variance for all traits and that these exhibited a high heritability. In agreement with Arora
et al.18 in Ae. tauschii and Rasheed et al.19 in wheat, we observed that grain length, grain width and grain weight
were positively correlated to grain yield. Interestingly, a bimodal distribution was observed for both the grain
length and width phenotypes, suggesting that one to a few major genes control these traits in our collection.
To assess the reproducibility and accuracy of genotypes called via the GBS approach, we genotyped 12 dif-
ferent plants of Chinese Spring (i.e. biological replicates), which were added to the set of 288 wheat samples for
SNP calling and bioinformatics analysis, which yielded a total of 129,940 loci. Among the 12 biological repli-
cates of CS, we found a very high reproducibility (~ 100%) in our genotype calls. Firstly, we verified the quality
of our SNP data by investigating the reproducibility and accuracy of GBS-derived SNPs calls, and found that
Scientific Reports | (2021) 11:19483 | https://doi.org/10.1038/s41598-021-98626-0 6
Vol:.(1234567890)www.nature.com/scientificreports/
Figure 4. Expression profile of TraesCS2D01G331100 gene based on transcriptomic analysis in wheat.
As shown, this gene is most highly expressed in the developing embryo during embryogenesis and grain
development in wheat. Data for this view derived from RNA-seq of w heat48 and the image was generated with
the eFP (RNA-Seq data) at http://bar.utoronto.ca/eplant/ by Waese et al.51. The legend at bottom left presents the
expression levels, coded by colors (yellow = low, red = high).
GBS-derived genotypes were in agreement with the reference genome in 99.9% of cases in over 1 M compari-
sons for non-imputed data and 93.8% after imputation of the missing genotype calls. Recently, Abed et Belzile20
reported that the accuracy of SNP calls was 99% for non-imputed and 89% for imputed SNPs dataset in Barley.
In our study, 76.7% of genotypes were called initially, and only 23.3% were imputed. Thus, we conclude that the
imputed data are of lower reliability.
As a further examination of data quality, we compared the genotypes called by GBS and a 90 K SNP array on
a subset of 71 Canadian wheat accessions. Among the 9,585 calls available for comparison, 95.1% of calls were in
agreement. It is likely that both genotyping methods contributed to cases of discordance. It is known, however,
that the calling of SNPs using the 90 K array is challenging because of the presence of three genomes in wheat and
the fact that most SNPs on this array are located in genic regions that tend to be typically more highly conserved,
thus allowing for hybridization of homoeologous sequences to the same element on the a rray21,22. The fact that
the vast majority of GBS-derived SNPs are located in non-coding regions makes it easier to distinguish between
homoeologues21. This likely contributed to the very high accuracy of GBS-derived calls described above. We
conclude that GBS can yield genotypic data that are at least as good as those derived from the 90 K SNP array.
This is consistent with the findings of Elbasyoni et al.23 as these authors concluded that “GBS-scored SNPs are
comparable to or better than array-scored SNPs” in wheat genotyping. Likewise, Chu et al.24 observed an ascer-
tainment bias for wheat caused by array-based SNP markers, which was not the case with GBS.
Confident that the GBS-derived SNPs provided high-quality genotypic information, we performed a GWAS
to identify which genomic regions control grain size traits. A total of three QTLs located on chromosomes 1D,
Scientific Reports | (2021) 11:19483 | https://doi.org/10.1038/s41598-021-98626-0 7
Vol.:(0123456789)www.nature.com/scientificreports/
Figure 5. Impact of haplotypes on the grain traits and yield (using Wilcoxon test). Boxplots for the grain length
(upper left), grain width (upper right), grain weight (bottom left) and grain yield (bottom right) are represented
for each haplotype. ***, ** and *: significant at p < 0.001, p < 0.01, and p < 0.05, respectively. NS Not significant.
2D and 4A were discovered. Under these QTLs, seven SNPs were found to be significantly associated with grain
length and/or grain width. Five SNPs were associated to both traits and two SNPs were associated to one of these
traits. The QTL located on chromosome 2D shows a maximum association with both traits. Interestingly, previ-
ous studies have reported that the sub-genome D, originating from Ae. tauschii, was the main source of genetic
variability for grain size traits in hexaploid wheat11,12. This is also consistent with the findings of Yan et al.15 who
performed QTL mapping in a biparental population and identified a major QTL for grain length that overlaps
with the one reported here. In a recent GWAS on a collection of Ae. tauschii accessions, Arora et al.18 reported a
QTL on chromosome 2DS for grain length and width, but it was located in a different chromosomal region than
the one we report here. With a view to develop useful breeding markers to improve grain yield in wheat, SNP
markers associated to QTL located on chromosome 2D appear as the most promising.
It is worth noting, however, that another genomic region of interest was also located on the D subgenome.
Interestingly, the peak SNP on 1D exhibited a very high degree of LD with the peak SNP on 2D. This may reflect
that, when selecting for large seed size, favorable alleles at both QTLs tend to be captured. In biparental progeny
segregating for both loci, it would be interesting to assess if there are any epistatic effects between these QTLs
leading to both loci being required to achieve the full phenotypic effect.
To identify a candidate gene contributing to grain length and width, we examined the genes residing in the
same linkage block as the peak SNP for each QTL. In the genomic interval spanned by the QTL contributing the
most to the phenotypic variation for grain size (2D_40.4–45.1 Mb), a total of 66 high-confidence genes expressed
during embryogenesis and grain development were observed. The TraesCS2D01G331100 gene seems like a highly
promising candidate as it is most highly expressed in the developing embryo during embryogenesis and grain
development in wheat. As well, it is expressed at the corresponding endosperm and pericarp, and was found
to encode the cytochrome P450 (CYP724B1), which showed homology to enzymes involved in brassinosteroid
biosynthesis, indicating the mechanism by which grain size is regulated in wheat. Furthermore, this gene has been
well conserved during the domestication process from ancestral (Einkorn) to common wheat (Triticum aestivum
L.) going through tetraploid s pecies25. It is an orthologous to the rice CYP724B1 gene, commonly known as the
D11 gene. The latter has been reported as involved in the regulation of internode elongation and seed develop-
ment due to his role in brassinosteroid s ynthesis26. Brassinosteroids are a group of plant hormones and are key
regulators of plant growth and development (including seeds) that promote cell expansion and e longation27.
To further refine the association between the TraesCS2D01G331100 gene and grain width and length,
we defined SNP haplotypes. An analysis of haplotypes surrounding this gene identified three distinct haplo-
types, and we observed that, for all grain size traits, the phenotypes corresponding to haplotype AT displayed
significantly higher values than those of other haplotypes. We therefore suggest that SNP markers flanking
Scientific Reports | (2021) 11:19483 | https://doi.org/10.1038/s41598-021-98626-0 8
Vol:.(1234567890)www.nature.com/scientificreports/
TraesCS2D01G331100 could provide a useful tool in marker-assisted breeding programs to improve wheat pro-
ductivity by selecting alleles leading to larger grain size and higher yield. In the longer term, it would be inter-
esting to define more precisely the exact nature of the alleles at this gene through targeted re-sequencing of this
gene in a broader collection of accessions.
Materials and methods
Plant materials and phenotyping. A total of 228 hexaploid wheat (Triticum aestivum L.) varieties were
used in our study. These accessions comprised two groups. A first group of 71 Canadian accessions was used
to validate the accuracy of GBS in wheat. The second group of 157 accessions was used for genome-wide asso-
ciation analyses. Indeed, accessions were collected from many wheat breeding programs. Canadian accessions
were collected from the University of Guelph Wheat Breeding Program and accessions from the second group
were collected from South Africa through the Agricultural Research Council (ARC), Stellenbosch University’s
Plant Breeding Laboratory (SU-PBL) and SENSAKO’s breeding programs, East Africa and Mexico via the Inter-
national Maize and Wheat Improvement Center (CIMMYT), Central Africa by the Institute of Agricultural
Research for Development (IRAD) and from f armers28, and North Africa per the International Center for Agri-
cultural Research in the Dry Areas (ICARDA). With the latter accessions, field trials were conducted in two dif-
ferent trial sites in the bimodal humid forest zone of Cameroon, during the 2015–2016 wheat-growing seasons
in Mbankolo (1057 m above sea level) and during 2016–2017 in Nkolbisson (650 m a. s. l.). In Mbankolo, the
average temperature is 18–20 °C, bimodal rainfall with an annual average of 1600 mm. In Nkolbisson, the annual
average temperature is 23.5 °C, the rainfall is bimodal with an annual average of 1560 mm. At each trial site, an
incomplete alpha-lattice design with two replications was used. Each accession was planted in five-row plots, in
3-m rows with 5 cm between plants and 25 cm between rows. Then, fields trials were managed in accordance
with the technical recommendations and standard agricultural practices for w heat29. Grain length (Gle), grain
width (Gwi), 1000-grain weight (Gwe) and grain yield (Gyi) were recorded for each accession. Gle and Gwi were
measured by a digital Vernier caliper on 20 seeds per variety randomly picked from a pool of grains from each
harvested area18.
Analysis of phenotypic data. The analysis of variance for each trait was performed using PROC MIXED
in SAS 9.4. Each cultivar was considered as a fixed effect, whereas replications and environments were con-
sidered as random effects. Pearson correlation coefficients between pairs of phenotypic traits were computed
using Pearson’s correlation in SPSS 20.0. We estimated the broad-sense heritability (h2) for each trait using the
following formula: h2 = VG +VVGEG
+Ve , where VG: genetic variance; VGE: genetic × environment variance and Ve:
error variance.
DNA isolation, GBS library construction and sequencing. Genomic DNA was extracted from dried
young leaf tissue (~ 5 mg) for all accessions using a CTAB DNA isolation method30. Then, DNA was quan-
tified using a Quant-iT™ PicoGreen (ThermoFisher Scientific, Canada) and the concentrations were normal-
ized to 20 ng/μl for library preparation. Our 228 DNA samples were part of a larger set of 288 wheat samples
on which GBS analysis was performed simultaneously (Fig. 5). In brief, 96-plex PstI-MspI GBS libraries were
constructed20,31,32 and each was sequenced on three PI chips on an Ion Proton sequencer at the Plate-forme
d’Analyses Génomiques of the Institut de Biologie Intégrative et des Systèmes (Université Laval, Québec, Can-
ada). To allow an assessment of the quality of GBS-derived SNP calls, 12 independent samples of Chinese Spring
(CS) DNA (each from a different plant) were used to produce a single (12-plex) PstI/MspI library that was
sequenced on one PI chip.
Single nucleotide polymorphism calling and bioinformatics analysis. DNA sequences of the full
set (n = 300) of wheat samples obtained from GBS were analyzed using the Fast-GBS p ipeline33 to align reads
on the wheat reference genome (Chinese Spring v1.0) and to call SNPs. Fast-GBS results were first filtered to (i)
keep only SNPs having the label “PASS” and SNPs positioned on chromosomes (i.e. not on scaffolds), (ii) remove
indels and multiallelic SNPs, (iii) convert all heterozygous calls with genotype quality (GQ) < 30 to missing data,
(iv) keep only SNPs with a minor allele count (MAC) ≥ 4, (v) remove accessions with more than 80% of missing
data, (vi) exclude SNPs with more than 10% heterozygotes and (vii) exclude SNPs with missing data (N) > 80%.
Finally, missing data were imputed using BEAGLE v534 with the parameters described in Torkamaneh and
Belzile35. Imputed genotypes were also filtered to keep only SNPs with a minor allele count (MAC) ≥ 4. After
these standard filtration steps, three subsets of accessions were extracted from the full dataset for specific goals:
(1) establish the accuracy and reproducibility of GBS-derived SNP calls on 12 replicates of cv. Chinese Spring;
(2) compare SNP genotypes obtained via GBS and the 90 K array on a subset of 71 Canadian accessions and (3)
perform GWAS for grain size on a diversity panel of 157 accessions. Additional filtration steps were performed
on these subsets before these analyses. The imputed genotypes of the subset of 71 wheat accessions were filtered
to keep only SNPs with a minor allele count (MAC) ≥ 4 and exclude SNPs with more than 10% heterozygotes,
while those from the collection of 157 wheat accessions were filtered to keep only SNPs with a minor allele fre-
quency (MAF) ≥ 0.05 (Fig. 6).
Validation of SNP call accuracy. The SNP genotypes for 12 different cv. Chinese Spring plants were used
to assess the accuracy and reproducibility of GBS-derived SNP calls. Before and after imputation of missing
data, we measured both the degree of agreement in SNP calls between replicates and the agreement between the
GBS-derived SNP calls and the Chinese Spring reference genome V1.0 using an in-house script. To compare the
accuracy of GBS-based and array-based genotype calls, we used a set of 71 Canadian wheat accessions for which
Scientific Reports | (2021) 11:19483 | https://doi.org/10.1038/s41598-021-98626-0 9
Vol.:(0123456789)www.nature.com/scientificreports/
Figure 6. Schematic representation of the genetics analytical steps of wheat accessions subset. *vast majority
of these are polymorphisms between Chinese Spring and the other accessions; † these are SNPs that are
polymorphic within the accessions of these sub-collections. MAC Minor allele count, MAF Minor allele
frequency.
genotypic data for 51,649 SNPs had been obtained previously using the 90 K SNP Infinium iSelect array36. For
the 135 SNPs called in common using both methods, genotype calls were compared using an in-house script.
Population structure and linkage disequilibrium analyses. An analysis of population structure was
performed on the collection of 157 wheat accessions (excluding the two accessions considered to be outliers)
using fastSTRUCTURE version 1.037 on SNP markers filtered at MAF ≥ 0.05 as recommended by Sobota et al.38.
Population structure was evaluated using the filtered set of SNP markers using a simple prior and 1,000 itera-
tions for K ranging from 1 to 12. The optimal range of K was determined based on model complexity using the
marginal likelihood method using the fastSTRUCTURE script chooseK.py, as well as on visualization of the log
marginal likelihood, and population visualization using Distruct version 1.139.
Genome-wide linkage disequilibrium (LD) analysis was performed using PLINK version 1.940, via the Gabriel
method41. This method is based on a confidence interval and a normalized measure of D′. The pattern and dis-
tribution of intrachromosomal LD were visualized with LD plots generated using Haploview version 4.242 to
investigate the average LD decay along chromosomes. The smoothed second-degree LOESS curve was fitted to
determine the critical D′ and r2 between loci.
Genome‑wide association study for grain traits. GWAS for grain traits was performed on the subset
of 157 wheat accessions via the Genomic Association and Prediction Integrated Tool (GAPIT) version 243. This
approach, based on associations between the estimated genotypic values (BLUEs) for each trait and individual
SNP markers44,46 was conducted with a compressed mixed linear model45. A matrix of genomic relationships
among individuals (Supplementary Fig. S6) was calculated using the Van Raden method43. The statistical model
used was: Y = Xβ + Zu + ε, where Y is the vector of phenotypes; β is a vector of fixed effects, including single SNPs,
population structure (Q), and the intercept; u is a vector of random effects including additive genetic effects as
matrix of relatedness between individuals (the kinship matrix), u ~ N(0, Kσa2), where σa2 is the unknown additive
genetic variance and K is the kinship matrix; X and Z are the design matrices of β and u, respectively; and ε is the
vector of residuals, ε ~ N(0, Iσe2), where σe2 is the unknown residual variance and I is the identity matrix. Associa-
tion analysis was performed while correcting for both population structure and relationships among individuals
with a combination of either the Q + K matrices; K matrix was computed using the Van Raden m ethod43. The p
value threshold of significance of the genome-wide association was based on false discovery rate (FDR-adjusted
p < 0.05).
Identification of candidate genes for grain size. To identify candidate genes affecting grain size in
wheat, we defined haplotype blocks containing the peak SNP. Each region was visually explored for its LD struc-
ture and for genes known to reside in such regions. The associated markers located in the same LD block as the
Scientific Reports | (2021) 11:19483 | https://doi.org/10.1038/s41598-021-98626-0 10
Vol:.(1234567890)www.nature.com/scientificreports/
peak SNP were searched and positioned on the wheat reference genome v1.0 on the International Wheat Genome
Sequencing Consortium (IWGSC) website (https://urgi.versailles.inra.fr/jbrowseiwgsc/gmod_jbrowse), and the
annotated genes within each interval were screened based on their confidence and functional annotation thanks
to the annotated and ordered reference genome sequence in place by IWGSC et al.47. Candidate genes potentially
involved in grain size traits were further investigated by analyzing gene structure and crossing-referenced them
against genes reported as controlling grain size in other Triticeae as well as orthologous search in other grass
species15,18,25,48–50. Furthermore, the selected genes were further evaluated for their likely function based on pub-
licly available genomic annotation. The function of these genes was also inferred by a BLAST of their sequences
to the UniProt reference protein database (http://www.uniprot.org/blast/). To further provide more information
about potential candidate genes, we used RNA-seq data of Ramírez-González et al.48, based on the electronic
fluorescent pictograph (eFP) at bar.utoronto.ca/eplant (by Waese et al.51) to identify in what tissues and at which
developmental stages candidate genes were expressed in wheat.
Identification of haplotypes around a candidate gene. To better define the possible alleles in a
strong candidate gene, we used HaplotypeMiner52 to identify SNPs flanking the TraesCS2D01G331100 gene. For
each haplotype, we calculated the trait mean (grain length, width, weight and yield) for lines sharing the same
haplotype using the R ggpubr program53.
Ethics declarations. Experiments on wheat were carried out in accordance with national, international
guidelines.
Received: 15 February 2021; Accepted: 9 August 2021
References
1. Breseghello, F. & Sorrells, M. E. QTL analysis of kernel size and shape in two hexaploid wheat mapping populations. Field Crops
Res. 101, 172–179 (2007).
2. Gegas, V. C. et al. A genetic framework for grain size and shape variation in wheat. Plant Cell 22, 1046–1056 (2010).
3. Okamoto, Y., Kajimura, T., Ikeda, T. M. & Takumi, S. Evidence from principal component analysis for improvement of grain
shape-and spikelet morphology-related traits after hexaploid wheat speciation. Genes Genet. Syst. 87, 299–310 (2012).
4. Kuchel, H., Williams, K. J., Langridge, P., Eagles, H. A. & Jefferies, S. P. Genetic dissection of grain yield in bread wheat. I. QTL
analysis. Theor. Appl. Genet. 115, 1029–1041 (2007).
5. Gan, Y. & Stobbe, E. H. Seedling vigor and grain yield of ‘Roblin’ wheat affected by seed size. Agron. J. 88, 456–460 (1996).
6. Marshall, D., Ellison, F. & Mares, D. Effects of grain shape and size on milling yields in wheat. I. Theoretical analysis based on
simple geometric models. Aust. J. Agric. Res. 35, 619 (1984).
7. Simons, K. J. et al. Molecular characterization of the major wheat domestication gene Q. Genetics 172, 547–555 (2006).
8. Williams, K., Munkvold, J. & Sorrells, M. Comparison of digital image analysis using elliptic Fourier descriptors and major dimen-
sions to phenotype seed shape in hexaploid wheat (Triticum aestivum L.). Euphytica 190, 99–116 (2013).
9. Sun, X., Marza, F., Ma, H., Carver, B. F. & Bai, G. Mapping quantitative trait loci for quality factors in an inter-class cross of US
and Chinese wheat. Theor. Appl. Genet. 120, 1041–1051 (2010).
10. Tsilo, T. J., Hareland, G. A., Simsek, S., Chao, S. & Anderson, J. A. Genome mapping of kernel characteristics in hard red spring
wheat breeding lines. Theor. Appl. Genet. 121, 717–730 (2010).
11. Reynolds, M., Dreccer, F. & Trethowan, R. Drought-adaptive traits derived from wheat wild relatives and landraces. J. Exp. Bot.
58, 177–186 (2006).
12. Rana, R. M., Bilal, M., Rehman, S. U., Iqbal, F. & Shah, M. K. N. Synthetic wheat; a new hope for the hungry world. Asian J. Agric.
Biol. 1, 91–94 (2013).
13. Okamoto, Y., Nguyen, A. T., Yoshioka, M., Iehisa, J. C. M. & Takumi, S. Identification of quantitative trait loci controlling grain
size and shape in the D genome of synthetic hexaploid wheat lines. Breed. Sci. 63, 423–429 (2013).
14. Dvorak, J. et al. The origin of spelt and free-threshing hexaploid wheat. J. Hered. 103, 426–441 (2012).
15. Yan, L. et al. Identification of QTL for grain size and shape on the D genome of natural and synthetic allohexaploid wheats with
near-identical AABB genomes. Front. Plant Sci. 8, 1705 (2017).
16. Yu, J. & Buckler, E. S. Genetic association mapping and genome organization of maize. Curr. Opin. Biotechnol. 17, 155–160 (2006).
17. Pang, Y. et al. High-resolution genome-wide association study identifies genomic regions and candidate genes for important
agronomic traits in wheat. Mol. Plant 13, 1311–1327 (2020).
18. Arora, S. et al. Genome-wide association study of grain architecture in wild wheat Aegilops tauschii. Front. Plant Sci. 8, 886 (2017).
19. Rasheed, A. et al. Genome-wide association for grain morphology in synthetic hexaploid wheats using digital imaging analysis.
BMC Plant Biol. 14, 128 (2014).
20. Abed, A. et al. Genotyping-by-sequencing on the ion torrent platform in barley. In Barley Vol. 1900 (ed. Harwood, W. A.) 233–252
(Springer, 2019).
21. Deschamps, S., Llaca, V. & May, G. D. Genotyping-by-sequencing in plants. Biology 1, 460–483 (2012).
22. Torkamaneh, D., Boyle, B. & Belzile, F. Efficient genome-wide genotyping strategies and data integration in crop plants. Theor.
Appl. Genet. 131, 499–511 (2018).
23. Elbasyoni, I. S. et al. A comparison between genotyping-by-sequencing and array-based scoring of SNPs for genomic prediction
accuracy in winter wheat. Plant Sci. 270, 123–130 (2018).
24. Chu, J. et al. Suitability of single-nucleotide polymorphism arrays versus genotyping-by-sequencing for genebank genomics in
wheat. Front. Plant Sci. 11, 42 (2020).
25. Xiang, D. et al. The transcriptional landscape of polyploid wheats and their diploid ancestors during embryogenesis and grain
development. Plant Cell 31, 2888–2911 (2019).
26. Tanabe, S. et al. A novel cytochrome P450 is implicated in brassinosteroid biosynthesis via the characterization of a rice dwarf
mutant, dwarf11, with reduced seed length. Plant Cell 17, 776–790 (2005).
27. Clouse, S. D. & Sasse, J. M. Brassinosteroids: Essential regulators of plant growth and development. Annu. Rev. Plant Biol. 49,
427–451 (1998).
Scientific Reports | (2021) 11:19483 | https://doi.org/10.1038/s41598-021-98626-0 11
Vol.:(0123456789)www.nature.com/scientificreports/
28. Tékeu, H. et al. Genetic diversity of Cameroonian bread wheat (Triticum aestivum L) cultivars revealed by microsatellite markers.
Afr. J. Biotechnol. 16, 1832–1839 (2017).
29. Pask, A. J. D., Pietragalla, J., Mullan, D. M. & Reynolds, M. P. Physiological Breeding II: A Field Guide to Wheat Phenotyping (Cim-
myt, 2012).
30. Doyle, J. J. & Doyle, J. L. Isolation ofplant DNA from fresh tissue. Focus 12, 39–40 (1990).
31. Elshire, R. J. et al. A robust, simple genotyping-by-sequencing (GBS) approach for high diversity species. PLoS ONE 6, e19379
(2011).
32. Poland, J. A., Brown, P. J., Sorrells, M. E. & Jannink, J.-L. Development of high-density genetic maps for barley and wheat using a
novel two-enzyme genotyping-by-sequencing approach. PLoS ONE 7, e32253 (2012).
33. Torkamaneh, D., Laroche, J., Bastien, M., Abed, A. & Belzile, F. Fast-GBS: a new pipeline for the efficient and highly accurate calling
of SNPs from genotyping-by-sequencing data. BMC Bioinform. 18, 1–7 (2017).
34. Browning, B. L., Zhou, Y. & Browning, S. R. A one-penny imputed genome from next-generation reference panels. Am. J. Hum.
Genet. 103, 338–348 (2018).
35. Torkamaneh, D. & Belzile, F. Scanning and filling: Ultra-dense SNP genotyping combining genotyping-by-sequencing, SNP array
and whole-genome resequencing data. PLoS ONE 10, e0131533 (2015).
36. Wang, S. et al. Characterization of polyploid wheat genomic diversity using a high-density 90 000 single nucleotide polymorphism
array. Plant Biotechnol. J. 12, 787–796 (2014).
37. Raj, A., Stephens, M. & Pritchard, J. K. fastSTRUCTURE: Variational inference of population structure in large SNP data sets.
Genetics 197, 573–589 (2014).
38. Sobota, R. S. et al. Addressing population-specific multiple testing burdens in genetic association studies. Ann. Hum. Genet. 79,
136–147 (2015).
39. Rosenberg, N. A. DISTRUCT: A program for the graphical display of population structure. Mol. Ecol. Notes 4, 137–138 (2004).
40. Purcell, S. et al. PLINK: A tool set for whole-genome association and population-based linkage analyses. Am. J. Hum. Genet. 81,
559–575 (2007).
41. Gabriel, S. B. et al. The structure of haplotype blocks in the human genome. Science 296, 2225–2229 (2002).
42. Barrett, J. C., Fry, B., Maller, J. & Daly, M. J. Haploview: Analysis and visualization of LD and haplotype maps. Bioinformatics 21,
263–265 (2005).
43. Lipka, A. E. et al. GAPIT: Genome association and prediction integrated tool. Bioinform. Oxf. Engl. 28, 2397–2399 (2012).
44. Abed, A. & Belzile, F. Comparing single-SNP, multi-SNP, and haplotype-based approaches in association studies for major traits
in barley. Plant Genome 12, 190036 (2019).
45. Li, M. et al. Enrichment of statistical power for genome-wide association studies. BMC Biol. 12, 73 (2014).
46. Malle, S., Eskandari, M., Morrison, M. & Belzile, F. Genome-wide association identifies several QTLs controlling cysteine and
methionine content in soybean seed including some promising candidate genes. Sci. Rep. 10, 21812 (2020).
47. International Wheat Genome Sequencing Consortium (IWGSC) et al. Shifting the limits in wheat research and breeding using a
fully annotated reference genome. Science 361, 661 (2018).
48. Ramírez-González, R. H. et al. The transcriptional landscape of polyploid wheat. Science 361, 662 (2018).
49. Rangan, P., Furtado, A. & Henry, R. J. The transcriptome of the developing grain: A resource for understanding seed development
and the molecular control of the functional and nutritional properties of wheat. BMC Genom. 18, 766 (2017).
50. Li, W. & Yang, B. Translational genomics of grain size regulation in wheat. TAG Theor. Appl. Genet. Theor. Angew. Genet. 130,
1765–1771 (2017).
51. Waese, J. et al. ePlant: Visualizing and exploring multiple levels of data for hypothesis generation in plant biology. Plant Cell 29,
1806–1821 (2017).
52. Tardivel, A., Torkamaneh, D., Lemay, M., Belzile, F. & O’Donoughue, L. S. A systematic gene-centric approach to define haplotypes
and identify alleles on the basis of dense single nucleotide polymorphism datasets. Plant Genome 12, 180061 (2019).
53. Kassambara, A. ggpubr:“ggplot2” based publication ready plots (Version 0.1. 7). Obtido Desde HttpsCRAN R-Proj. Orgpackage
Ggpubr (2018).
Acknowledgements
This work was supported by the Institut de Biologie Intégrative et des Systèmes (Université Laval, Québec,
Canada), the Agence Universitaire de la Francophonie (AUF) and the MIC-CERES Project jointly supported
by Agropolis Fondation (Grant AF Project ID 1301-003) through the Investissements d’avenir program (with
Reference Number ANR-10-LABX-0001-01) and Fondazione Cariplo (Grant FC Project ID 2013-1888). Authors
are grateful to the International Maize and Wheat Improvement Center (CIMMYT), the International Center for
Agricultural Research in the Dry Areas (ICARDA) and the Plant Breeding Laboratory (Department of Genetics,
Stellenbosch University) for their technical supports and wheat varieties collection. They would like to thank the
late Prof. Alireza Navabi for his significant contribution.
Author contributions
H.T., M.J., E.L.M.N., P.F.D. and F.B. conceived the project. H.T., P.T., E.L.M.N., P.F.D., W.T. and F.B. contributed
to sample collection, implemented and monitored the phenotyping trials in fields. B.B. provided the GBS data.
H.T., S.B., A.A., D.T., E.L.M.N., B.B., M.J. and F.B. contributed to genetic analyses, critical revision of the article
and all authors contributed to final approval of the version to be published.
Competing interests
The authors declare no competing interests.
Additional information
Supplementary Information The online version contains supplementary material available at https://doi.org/
10.1038/s41598-021-98626-0.
Correspondence and requests for materials should be addressed to F.B.
Reprints and permissions information is available at www.nature.com/reprints.
Publisher’s note Springer Nature remains neutral with regard to jurisdictional claims in published maps and
institutional affiliations.
Scientific Reports | (2021) 11:19483 | https://doi.org/10.1038/s41598-021-98626-0 12
Vol:.(1234567890)www.nature.com/scientificreports/
Open Access This article is licensed under a Creative Commons Attribution 4.0 International
License, which permits use, sharing, adaptation, distribution and reproduction in any medium or
format, as long as you give appropriate credit to the original author(s) and the source, provide a link to the
Creative Commons licence, and indicate if changes were made. The images or other third party material in this
article are included in the article’s Creative Commons licence, unless indicated otherwise in a credit line to the
material. If material is not included in the article’s Creative Commons licence and your intended use is not
permitted by statutory regulation or exceeds the permitted use, you will need to obtain permission directly from
the copyright holder. To view a copy of this licence, visit http://creativecommons.org/licenses/by/4.0/.
© The Author(s) 2021
Scientific Reports | (2021) 11:19483 | https://doi.org/10.1038/s41598-021-98626-0 13
Vol.:(0123456789)You can also read