Particles under stress: ultrasonication causes size and recovery rate artifacts with soil-derived POM but not with microplastics
←
→
Page content transcription
If your browser does not render page correctly, please read the page content below
Biogeosciences, 18, 159–167, 2021
https://doi.org/10.5194/bg-18-159-2021
© Author(s) 2021. This work is distributed under
the Creative Commons Attribution 4.0 License.

Particles under stress: ultrasonication causes size and recovery rate
artifacts with soil-derived POM but not with microplastics
Frederick Büks1 , Gilles Kayser2 , Antonia Zieger1 , Friederike Lang2 , and Martin Kaupenjohann1
1 Chair   of Soil Science, Department of Ecology, Technische Universität Berlin, 10587 Berlin, Germany
2 Chair   of Soil Ecology, University of Freiburg, 79085 Freiburg im Breisgau, Germany

Correspondence: Frederick Büks (frederick.bueks@tu-berlin.de)

Received: 3 June 2020 – Discussion started: 16 June 2020
Revised: 2 November 2020 – Accepted: 21 November 2020 – Published: 11 January 2021

Abstract. The breakdown of soil aggregates and the extrac-         1   Introduction
tion of particulate organic matter (POM) by ultrasonication
and density fractionation is a method widely used in soil or-
ganic matter (SOM) analyses. It has recently also been used        The mechanical disintegration of soil aggregates by use of
for the extraction of microplastic from soil samples. How-         ultrasonication following the method of Edwards and Brem-
ever, the investigation of POM physiochemical properties           ner (1967a) and subsequent density fractionation of particu-
and ecological functions might be biased if particles are com-     late organic matter is widely used in the assessment of soil
minuted during the treatment. In this work, different types of     organic matter (SOM) stability. This includes characteristics
POM, which are representative of different terrestrial ecosys-     such as aggregate composition and stability (Edwards and
tems and anthropogenic influences, were tested for their           Bremner, 1967b), the constitution of SOM pools (Golchin
structural stability in the face of ultrasonication in the range   et al., 1994), the stabilization of SOM in forest ecosystems
of 0 to 500 J mL−1 . The occluded particulate organic matter       (Graf-Rosenfellner et al., 2016) and the occlusive strength of
(oPOM) of an agricultural and forest soil as well as pyrochar      particulate organic matter (POM) (Büks and Kaupenjohann,
showed a significant reduction of particle size at ≥ 50 J mL−1     2016). Ultrasonication is also applied to assess quantities and
by an average factor of 1.37 ± 0.16 and a concurrent re-           qualities of anthropogenic contaminants such as microplas-
duction of recovery rates by an average of 21.7 ± 10.7 %           tics (Zhang and Liu, 2018; Zhang et al., 2018).
when being extracted. Our results imply that increasing ul-           In studies on soil carbon pools, ultrasound is applied to
trasonication causes increasing retention of POM within the        a soil slurry to break down soil aggregates. The disaggre-
sedimenting phase, leading to a misinterpretation of certain       gation allows density fractionation of the free and occluded
POM fractions as more strongly bound oPOM or part of the           light fractions (fLF and oLF), which largely consist of mate-
mineral-associated organic matter (MOM). This could, for           rial with densities below the fractionation medium, from the
example, lead to a false estimation of physical stabilization.     heavy fraction (HF), which has higher densities. These oper-
In contrast, neither fresh nor weathered polyethylene (PE),        ational fractions largely correspond to the free particulate or-
polyethylene terephthalate (PET) and polybutylene adipate          ganic matter (fPOM), the occluded particulate organic matter
terephthalate (PBAT) microplastics showed a reduction of           (oPOM) and the mineral-associated organic matter (MOM).
particle size or the recovery rate after application of ultra-     This organic matter is assigned to the labile, intermediate and
sound. We conclude that ultrasonication applied to soils has       stable carbon pool, respectively, and has turnover times of
no impact on microplastic size distribution and thus provides      < 1 year (labile) to several thousands of years (stable) (von
a valuable tool for the assessment of microplastics in soils       Lützow et al., 2007).
and soil aggregates.                                                  Furthermore, the extracted POM fractions may contain
                                                                   not only natural but also anthropogenic components such as
                                                                   microplastic. Recent studies have reported soil microplastic
                                                                   concentrations between 1 mg kg−1 dry soil at less contami-

Published by Copernicus Publications on behalf of the European Geosciences Union.
160 F. Büks et al.: Particles under stress nated sites and 2 to 4 orders of magnitude above in samples tion into size fractions of < 20, 20 to 250 and > 250 µm. from highly contaminated industrial areas (Fuller and Gau- At ≥ 100 J mL−1 POM was transferred from the > 250 to tam, 2016; Rezaei et al., 2019). The agricultural applications the < 20 µm fraction. In a similar manner, Yang et al. (2009) of sewage sludge, wastewater, compost, as well as plastic measured the mass and soil organic carbon (SOC) content of mulching and the input of road and tire wear, are discussed sand, silt and clay sized particle fractions in natural soils us- as important entry pathways to soils (Bläsing and Amelung, ing an unconventional pulse/non-pulse ultrasonication tech- 2018). These origins of MP are characterized by a different nique. The authors derived the comminution of POM at composition of the size and shape of the extracted items (e.g., > 600 J mL−1 . Oorts et al. (2005) added 13 C-enriched straw Zhang and Liu, 2018; Ding et al., 2020). In laboratory exper- to natural soils and could show that larger amounts of POM iments, MP in the observed size range was shown to influ- were redistributed at 450 J mL−1 when its degree of decom- ence soil biogeochemical properties such as water-holding position was higher. In conclusion, those studies consistently capacity, soil structure, microbial activity and the health of found a comminution of POM by ultrasonic treatment, which soil biota, with a strong dependence on the size and shape of appears, however, at very different energy levels and is likely the applied particles (de Souza Machado et al., 2018; Büks affected by the aggregation regime (suspended without min- et al., 2020). Furthermore, the mobility within the soil pore eral matrix, added as fPOM, occluded within natural soils), space and preferential flow channels, which is crucial for the direct or indirect quantification of POM, and the type of accessibility of soil microplastic to groundwaters and surface POM. waters, is also highly dependent on particle size (O’Connor The aim of this work was to test how susceptible different et al., 2019; Zubris and Richards, 2005). It is therefore a very types of POM are to comminution by ultrasonic treatment topical task for both the impact assessment of given contam- under standardized conditions. We embedded three types of inations in landscapes and the design of robust experimental POM (farm oPOM, forest oPOM and pyrochar, applied as setups to have extraction methods with high yield and a low an analog for soil black carbon and biochar amendments) alteration of microplastic size and shape. and also six differently weathered microplastics (fresh and The common method of ultrasonication is carried out with weathered low-density polyethylene (LD-PE), polyethylene a piezoelectric converter, which uses electric energy to gen- terephthalate (PET) as well as polybutylene adipate tereph- erate axial vibration of a sonotrode, which is dipped into a thalate (PBAT), a common biodegradable material) into a flask containing a fluid and a submerged soil sample. The fine sand matrix. Then, we treated these mixtures with 0, oscillating sonotrode emits acoustic pulses within the fluid. 10, 50, 100 and 500 J mL−1 , re-extracted the organic par- In front of the shock waves the medium is compressed, and ticles with density fractionation, and measured their recov- the increased pressure causes an increased gas solubility. Be- ery rates and particle size distributions. The sand matrix was hind the wave the medium relaxes and the pressure drops used only to simulate the influence of pore space on cavi- below the normal level, leading to an explosive outgassing tation and, thus, our simplified approach excluded broadly (Ince et al., 2001). This so-called cavitation effect produces varying POM–mineral interactions resulting from aggrega- lots of exploding microbubbles between particles and within tion processes in natural soil samples. cavities of the soil matrix, generating very local pressure In advance of the treatment, the nine materials showed dif- peaks of 200 to 500 atm accompanied by temperatures of ferent mechanical stabilities. Unlike all six types of plastic 4200 to 5000 K (Ince et al., 2001). It provokes the detach- particles, the occluded POM and the pyrochar were easy to ment of physiochemical bondings between soil primary par- grind between two fingers and therefore assumed to be prone ticles and soil aggregates and, thus, causes disaggregation. to ultrasonication. An examination of the recent literature on Depending on the type and settings of the device, the vi- microplastic extraction from soils showed that the stability bration frequency can vary up to 10 000 kHz, but low fre- of microplastic in the face of ultrasound has not been stud- quencies around 20 to 100 kHz are recommended for soil ag- ied yet, neither with weathered nor juvenile material. Exper- gregate dispersion to avoid chemical alteration of OM, and iments with polymer-based adsorber resins indicated frac- the use of 40 kHz is very common (Kaiser and Berhe, 2014; tures on microbead surfaces after treatment with 100 J s−1 at Graf-Rosenfellner et al., 2018). 40 kHz for 70 min (Breitbach et al., 2002). When exposed to As an artifact of the method, ultrasonication is known the environment, plastic undergoes weathering by UV radia- to provide mechanical and thermal stress strong enough to tion, mechanical comminution, microbial decay and chemi- comminute mineral particles at energy levels > 700 J mL−1 cal alteration (Kale et al., 2015; Andrady et al., 2017), which (Kaiser and Berhe, 2014). Also, the destructive influence on leads to embrittlement. We therefore hypothesized that un- POM was tested in different studies and appears even at en- weathered microplastic particles will be prone to ultrasonic ergy levels much lower than 700 J mL−1 . Without applica- treatment to a degree less than weathered microplastic and tion of a solid mineral matrix, Balesdent et al. (1991) found much less than pyrochar or natural oPOM. > 60 % of the POM in suspension comminuted after appli- cation of 300 J mL−1 . Amelung and Zech (1999) treated nat- ural soils with 0 to 1500 J mL−1 and performed a separa- Biogeosciences, 18, 159–167, 2021 https://doi.org/10.5194/bg-18-159-2021
F. Büks et al.: Particles under stress                                                                                          161

2     Material and methods                                          100 to 500 J mL−1 marks the range of microaggregate dis-
                                                                    aggregation, as many studies stated full disaggregation of
2.1    Preparation of POM                                           soils after application of ∼ 500 J mL−1 (Kaiser and Berhe,
                                                                    2014). Larger values were ruled out, although some studies
The farm and forest oPOM were extracted from air-dried              applied energy levels above 500 J mL−1 , like that of Pronk
soil aggregates of 630 to 2000 µm in diameter sampled in            et al. (2011), who could show that silt-sized microaggregates
10 to 20 cm depth from an organic horticulture near Oranien-        were not dispersed at energy levels ≤ 800 J mL−1 . However,
burg (Brandenburg; 52◦ 460 5400 N, 13◦ 110 5000 E, sandy tex-       small microaggregates often contain little or no POM (Tis-
ture, Corg = 49.3 g kg−1 , pH 5.8) and a spruce–beech mixed         dall, 1996), and energies > 710 J mL−1 cause physical dam-
forest near Bad Waldsee (Baden-Württemberg; 47◦ 500 5900 N,         age on mineral particles (Kaiser and Berhe, 2014). Therefore
9◦ 410 3000 E, texture Sl4, Corg = 73.2 g kg−1 , pH 3.4). The ex-   we focus on the range of 0 to 500 J mL−1 as a safe space for
traction was performed by use of a density fractionation in         the extraction of POM with no other known artifacts.
1.6 g cm−3 dense sodium polytungstate (SPT) solution: in                We chose acid-washed and calcinated fine sand to simulate
12-fold replication, 120 mL of SPT solution was added to            the soil mineral matrix. This texture can be easily suspended
30 g of aggregates in a 200 mL PE bottle. The sample was            by ultrasonication (coarse sand cannot), has a low tendency
stored for 1 h to allow the SPT solution to infiltrate the ag-      to coat POM or coagulate (like clay does) and shows a fast
gregates and was then centrifuged at 3500 G for 26 min. The         sedimentation when the sample is centrifuged. Fine sand,
floating free particulate organic matter (fPOM) was removed         moreover, represents soils that originated from Weichselian
by use of a water-jet pump and discarded. The remaining             sanders or eolian sand deposition. In this methodical paper,
sample was refilled to 120 mL with SPT solution and son-            our aim, however, was not to simulate a set of soil textures,
icated for 30 s (≈ 10 J mL−1 ) by use of a sonotrode (Bran-         but to have a proof of concept to find out whether natural or
son© Sonifier 250) in order to flaw the structure of macroag-       artificial POM is damaged by ultrasonication. Then, quan-
gregate (> 250 µm). Then, centrifugation and removal of the         tities of 1 % w/w POM, and 0.5 % w/w in the case of the
oPOM were executed as for the fPOM. The gained oPOM                 oPOM, were embedded into the fine sand matrix.
was filtered with a 0.45 µm cellulose acetate membrane fil-             These artificial soils (each 20 g) were stored in 100 mL of
ter, washed 3 to 5 times with 200 mL deionized water within         1.6 g cm−3 dense SPT solution for 1 h in 200 mL PE bottles,
the filter device until the rinse had an electrical conductiv-      which did not show measurable release of plastic fragments
ity of < 50 µS cm−1 , removed from the filter by rinsing with       due to sonication in preliminary tests with a pure fine sand
deionized water, collected and gently dried for 48 h at 40 ◦ C.     matrix (data not shown). Mechanical stress was applied by
At the end, the oPOM was sieved to 2000 µm, residues with           use of a sonotrode (Branson© Sonifier 250) as described by
elongated shape were cut by a sharp knife, sieved again and         Büks and Kaupenjohann (2016). The sonication times corre-
pooled to one oPOM sample. The pyrogenic char sample                sponding to 0, 10, 50, 100 and 500 J mL−1 were determined
(made from pine wood, pyrolyzed at 850 ◦ C for 0.5 h by             by means of the sonotrode’s energy output calculated fol-
PYREG® GmbH) was dried for 24 h at 105 ◦ C, ground in               lowing North (1976). After the ultrasonic treatment, samples
a mortar and sieved to < 630 µm. The microplastics (LD-             were centrifuged at 3500 G for 26 min. The floated POM was
PE, PET and PBAT) were made from plastic films by re-               removed by use of a water-jet pump, separated and cleaned
peated milling (Fritsch Pulverisette 14) with liquid nitro-         by rinsing with deionized water on a 0.45 µm cellulose ac-
gen and sieved to < 500 µm. Then, half of each sample was           etate membrane filter until the electrical conductivity of the
weathered for 96 h at 38 ◦ C, 1000 W m−2 (solar spectrum,           rinse went below 50 µS cm−1 , and then lyophilized.
280 to 3000 nm) and a relative air humidity of 50 % follow-
ing DIN EN ISO 4892-2/3, which is the international in-             2.3   Determination of recovery rates
dustry standard for testing artificial weathering of polymer-
based materials (Pickett, 2018).                                    After lyophilization, the recovery rate R = mt m−1   0 was de-
                                                                    termined by weighing and described as the ratio of the recov-
2.2    Mechanical stress treatment                                  ered POM mass after treatment (mt ) to the initial POM mass
                                                                    (m0 ) for all POM types and energy levels. The recovery rate
In order to test their stability against ultrasonication, the       of a certain energy level is assumed significantly different to
nine POM types (farm and forest oPOM and pyrochar as                the 0 J mL−1 level if a pairwise t test results in p < 0.05 (Ta-
well as fresh and weathered LD-PE, PET and PBAT) were               ble 1).
each exposed in triplicates to different mechanical stress lev-
els (0, 10, 50, 100 and 500 J mL−1 ). The treatment with            2.4   Measurement of particle sizes
0 J mL−1 was used as a control with no mechanical agita-
tion, and 10 J mL−1 represents a gentle stimulation, which          All samples continued to be used for particle sizing. Af-
is suggested not to disaggregate soil structure (Kaiser and         ter pre-trials have shown that mainly the hydrophobic
Berhe, 2014). Macroaggregates are prone to 50 J mL−1 , and          particles (microplastics and pyrochar) coagulated in dis-

https://doi.org/10.5194/bg-18-159-2021                                                        Biogeosciences, 18, 159–167, 2021
162 F. Büks et al.: Particles under stress
tilled water, aggregation was avoided by suspension in and pyrochar showed significant differences to the 0 J mL−1
0.1 % w/v Tween© 20 detergent solution and vortexing fol- treatment at ≥ 10, ≥ 100 and ≥ 100 J mL−1 , respectively
lowing Katija et al. (2017). A total of 30 to 100 mg of POM (Table 1).
was suspended in 500 mL 0.1 % Tween© 20 solution and
size classified with a QICPIC image analysis device (Sympa- 3.2 POM size distribution
tec GmbH, Clausthal-Zellerfeld, Germany) using a modified
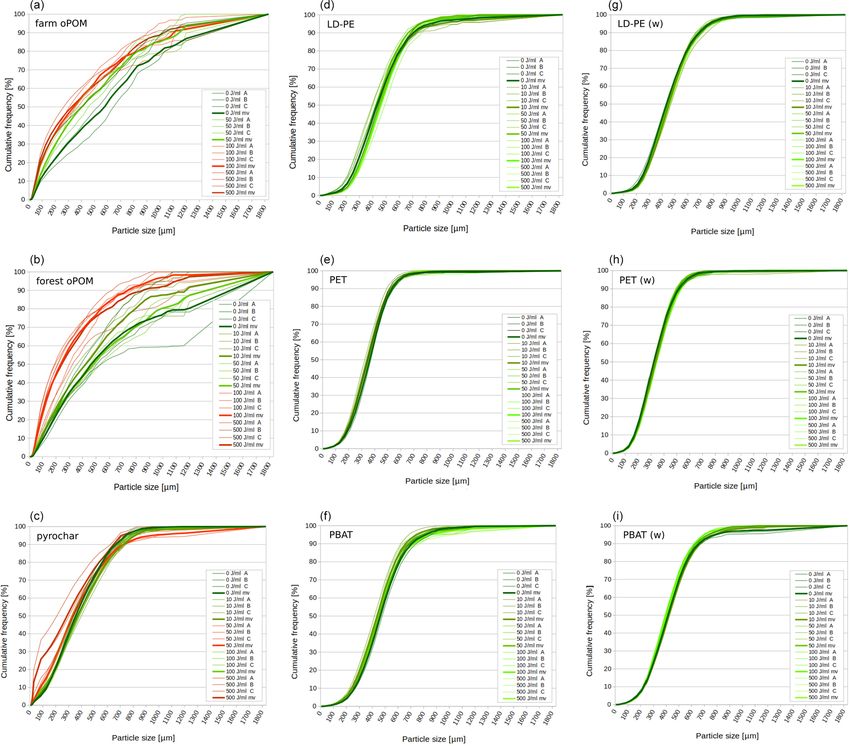
method from Kayser et al. (2019). Counts were grouped into None of the plastics shows a significant reduction of particle
34 size classes from < 5.64 to 1200–1826.94 µm and plotted size due to ultrasonic treatment within the 10 % and 50 %
as cumulative histograms of each replicate and their mean quantile. In contrast, at ≥ 100 J mL−1 the particle size of
values (Fig. 1a and b). As the primary criterion for the reduc- farm and forest oPOM was significantly reduced compared
tion in particle size, the first 10 % and 50 % quantile (median) to the 0 J mL−1 treatment in both quantiles. Ultrasonic treat-
values were compared by a pairwise t test between 0 J mL−1 ment also causes a significant comminution of pyrochar, but
and each other energy level, respectively. As particle size re- of mainly the smaller fraction indicated by the 10 % quantile,
duction could be significant but still marginal in the case of a which appeared at ≥50 J mL−1 and is only interrupted due to
low variance between parallels and a low grade of comminu- an outlier at 100 J mL−1 . The 50 % quantile data (median)
tion at the same time, the averaged comminution factor (CF) remain insignificant (Fig. 1a and b, Table 2).
was introduced. It is defined as
3.3 Mass loss
P x0,i
( xi )
i The treatment of pyrochar triplicates with 500 J mL−1 re-
CF = , (1)
i sulted in a recovery rate of 54.3 ± 5.2 % after density frac-
tionation. In turn, 34.9 ± 3.7 % of the POM remained in the
with i the number of parallels, x0,i the quantile value of the
sediment, 0.6 ± 0.1 % into the DOM fraction and < 0.5 %
0 J mL−1 energy level and xi the value of the compared en-
onto the filter, leading to a balance loss of 10.2 ± 2.1 % (Ta-
ergy level. A sample is then assumed significantly different
ble 3). The respective data of farm oPOM are 54.6 ± 1.9 %,
to the 0 J mL−1 control and not marginal if the p value given
20.3 ± 3.1 %, 5.1 ± 0.2 %, < 0.5 % and 20.0 ± 1.5 %. Sam-
by the t test is < 0.05 and the comminution factor is > 1.1
ples treated with 0 J mL−1 instead showed a significantly
for the 10 % quantile, the median or both, while its standard
higher recovery rate and lower retention compared to the
deviation is SD < |CF − 1| (Table 2).
500 J mL−1 samples. In contrast, the balance loss remained
2.5 Organic matter balance constant between 0 and 500 J mL−1 .
A second set of triplicates of pyrochar and farm soil oPOM
4 Discussion
were treated similarly at 0 and 500 J mL−1 to balance the
complement of the recovered POM. For this purpose, the C Our experiments indicate that soil-derived oPOM and
concentration within the lyophilized sediment was measured pyrochar embedded into a fine sand matrix are prone
by use of a CNS analyzer and converted to POM mass by use to comminution by ultrasonic treatment at energy lev-
of the C content (%) of the respective organic matter. In ad- els of ≥ 50 J mL−1 . These values are well below the
dition, the mass gain of the cellulose acetate filters was mea- 300 to 750 J mL−1 given in the literature for the complete dis-
sured after rinsing the sample and drying the filter at 70 ◦ C aggregation of various soils (Amelung and Zech, 1999; Oorts
for 24 h. The dissolved organic carbon (DOC) concentration et al., 2005; Yang et al., 2009), namely in the range of values
of the filtrate was measured and converted to dissolved or- given for the destruction of macroaggregates (Amelung and
ganic matter (DOM) by use of an assumed 50 % C content. Zech, 1999; Kaiser and Berhe, 2014). This underpins the for-
The difference of these and the recovered fractions compared mer implications by some authors that ultrasonic treatment
to the initial weight of organic particles is termed the balance could lead to particle size artifacts. Microplastic, in contrast,
loss during the extraction procedure (Table 3). shows a constant particle size distribution over all energy lev-
els and seems to resist ultrasonication within the tested range
3 Results of 0 to 500 J mL−1 . The recovery of microplastics also shows
a constantly high rate of nearly 100 %, which is not affected
3.1 Resulting recovery rates by the applied energy. In sharp contrast, the recovery rates
of soil-derived POM and pyrochar decreased with increasing
All microplastic samples (LD-PE, PET and PBAT) show a energies from 95.0 % to 78.6 % to 63.8 % to 35.8 %, which
constantly high recovery rate of about 97.1 ± 2.5 % on aver- became significant at 50 to 100 J mL−1 and therefore is quite
age over the whole range of applied energy levels. In sharp parallel to observed size reduction.
contrast, all other samples were decreasingly recovered along The concurrent decrease of particle size and recovery rate
with increasing energy levels. Farmland POM, forest POM of soil-derived POM and pyrochar and its absence after ul-
Biogeosciences, 18, 159–167, 2021 https://doi.org/10.5194/bg-18-159-2021F. Büks et al.: Particles under stress 163
Table 1. Recovery rates of natural POM and microplastics from after ultrasonic treatment with 0, 10, 50, 100 and 500 J mL−1 (n = 3). The
(w) marks weathered plastics, mv the mean value and SD the standard deviation. Bold numbers are significantly different from the 0 J mL−1
treatment by p < 0.05.
Recovery rate [% w/w]
Sample 0 J mL−1 10 J mL−1 50 J mL−1 100 J mL−1 500 J mL−1
mv ± SD mv ± SD mv ± SD mv ± SD mv ± SD
Farm oPOM 95.0 ± 2.3 80.8 ± 4.5 73.2 ± 6.1 72.3 ± 2.8 51.6 ± 7.2
Forest oPOM 89.3 ± 5.4 79.0 ± 5.1 76.9 ± 8.4 67.8 ± 3.6 48.7 ± 5.4
Pyrochar 93.5 ± 10.1 84.6 ± 6.1 78.1 ± 2.5 74.3 ± 1.9 63.8 ± 3.1
LD-PE 96.9 ± 1.2 97.3 ± 1.0 95.8 ± 6.7 99.9 ± 1.9 99.2 ± 1.6
LD-PE (w) 93.9 ± 3.4 96.5 ± 1.2 96.6 ± 1.5 98.9 ± 3.0 97.8 ± 1.7
PET 98.6 ± 2.5 94.0 ± 1.6 98.7 ± 2.5 98.5 ± 2.0 94.3 ± 1.3
PET (w) 96.2 ± 2.5 95.4 ± 3.0 97.0 ± 2.0 95.5 ± 1.0 96.4 ± 3.3
PBAT 99.6 ± 2.5 99.5 ± 0.9 90.9 ± 13.8 98.3 ± 3.6 98.2 ± 0.9
PBAT (w) 97.7 ± 0.9 99.3 ± 1.9 96.8 ± 1.6 96.6 ± 1.7 99.3 ± 1.9
Figure 1. Particle size distribution of natural POM (a–c) and microplastics (d–i) after ultrasonic treatment with 0, 10, 50, 100 and 500 J mL−1
(n = 3: A, B, C). Green graphs are similar to the 0 J mL−1 treatment (p ≥ 0.05 or comminution factor ≤ 1.1), red graphs significantly different
by p < 0.05 and comminution factor > 1.1. Bold lines represent mean values (mv). The (w) marks weathered plastics.
https://doi.org/10.5194/bg-18-159-2021 Biogeosciences, 18, 159–167, 2021164 F. Büks et al.: Particles under stress
Table 2. Particle size distribution (10 % and 50 % quantile) and comminution factor of natural POM and microplastics after ultrasonic
treatment with 0, 10, 50, 100 and 500 J mL−1 (n = 3). The (w) marks weathered plastics, mv the mean value and SD the standard deviation.
Bold numbers are significantly different from the 0 J mL−1 treatment by p < 0.05 and comminution factor > 1.1.
Size distribution Comminution factor
10 % quantile 50 % quantile 10 % quantile 50 % quantile
POM type J mL−1 mv ± SD mv ± SD mv ± SD mv ± SD
Farm oPOM 0 82.90 ± 9.46 561.33 ± 72.98 1.00 ± 0.00 1.00 ± 0.00
10 NA NA NA NA
50 72.31 ± 15.39 401.40 ± 47.86 1.17 ± 0.15 1.17 ± 0.34
100 53.40 ± 2.61 344.64 ± 33.40 1.56 ± 0.26 1.56 ± 0.23
500 47.21 ± 2.46 331.88 ± 69.03 1.76 ± 0.21 1.76 ± 0.23
Forest oPOM 0 108.08 ± 17.40 476.26 ± 79.01 1.00 ± 0.00 1.00 ± 0.00
10 91.71 ± 11.04 422.27 ± 68.13 1.19 ± 0.27 1.17 ± 0.36
50 84.92 ± 16.97 485.08 ± 41.44 1.28 ± 0.09 0.98 ± 0.14
100 60.48 ± 16.40 233.11 ± 58.78 1.87 ± 0.55 2.18 ± 0.80
500 55.49 ± 13.01 244.41 ± 70.33 1.98 ± 0.28 2.02 ± 0.48
Pyrochar 0 130.33 ± 6.33 355.79 ± 16.19 1.00 ± 0.00 1.00 ± 0.00
10 119.09 ± 16.07 369.18 ± 39.01 1.10 ± 0.11 0.97 ± 0.15
50 81.39 ± 10.07 333.41 ± 9.59 1.62 ± 0.25 1.07 ± 0.08
100 103.37 ± 33.73 371.92 ± 19.99 1.34 ± 0.38 0.96 ± 0.09
500 31.18 ± 11.70 284.35 ± 67.85 4.59 ± 1.67 1.30 ± 0.28
LD-PE 0 235.15 ± 19.46 433.21 ± 9.18 1.00 ± 0.00 1.00 ± 0.00
10 236.54 ± 29.80 432.25 ± 31.43 1.00 ± 0.06 1.01 ± 0.06
50 237.80 ± 28.51 425.20 ± 26.47 1.01 ± 0.20 1.02 ± 0.08
100 263.23 ± 6.87 463.10 ± 24.59 0.89 ± 0.05 0.94 ± 0.03
500 266.29 ± 5.32 454.22 ± 9.98 0.88 ± 0.06 0.95 ± 0.01
LD-PE (w) 0 245.69 ± 15.39 435.02 ± 6.41 1.00 ± 0.00 1.00 ± 0.00
10 260.20 ± 5.64 451.72 ± 16.36 0.94 ± 0.04 0.96 ± 0.03
50 265.51 ± 1.55 451.20 ± 6.71 0.93 ± 0.06 0.96 ± 0.03
100 253.61 ± 7.67 442.70 ± 3.57 0.97 ± 0.08 0.98 ± 0.02
500 262.94 ± 3.25 458.59 ± 4.03 0.93 ± 0.06 0.95 ± 0.02
PET 0 193.66 ± 11.91 360.74 ± 11.96 1.00 ± 0.00 1.00 ± 0.00
10 180.15 ± 7.97 339.89 ± 13.84 1.08 ± 0.12 1.06 ± 0.07
50 179.69 ± 5.09 344.78 ± 7.76 1.08 ± 0.09 1.05 ± 0.06
100 162.59 ± 29.24 341.00 ± 1.94 1.21 ± 0.19 1.06 ± 0.04
500 181.14 ± 7.12 344.70 ± 6.93 1.07 ± 0.08 1.05 ± 0.04
PET (w) 0 171.89 ± 5.20 321.46 ± 4.19 1.00 ± 0.00 1.00 ± 0.00
10 186.44 ± 11.60 332.81 ± 7.80 0.92 ± 0.07 0.97 ± 0.01
50 172.80 ± 7.98 324.73 ± 7.55 1.00 ± 0.08 0.99 ± 0.04
100 182.74 ± 0.80 340.28 ± 7.11 0.94 ± 0.03 0.95 ± 0.03
500 157.67 ± 25.54 331.51 ± 9.52 1.11 ± 0.18 0.97 ± 0.04
PBAT 0 263.19 ± 6.13 464.20 ± 11.93 1.00 ± 0.00 1.00 ± 0.00
10 243.05 ± 15.60 437.71 ± 18.57 1.09 ± 0.08 1.06 ± 0.04
50 240.26 ± 6.80 441.55 ± 9.41 1.10 ± 0.04 1.05 ± 0.05
100 246.75 ± 5.27 455.51 ± 5.37 1.07 ± 0.02 1.02 ± 0.04
500 242.52 ± 3.78 452.18 ± 11.85 1.09 ± 0.04 1.03 ± 0.05
PBAT (w) 0 223.53 ± 6.06 413.87 ± 4.60 1.00 ± 0.00 1.00 ± 0.00
10 225.56 ± 6.97 423.06 ± 2.81 0.99 ± 0.06 0.98 ± 0.02
50 225.22 ± 2.92 414.68 ± 8.41 0.99 ± 0.04 1.00 ± 0.02
100 220.13 ± 1.97 396.85 ± 6.20 1.02 ± 0.03 1.04 ± 0.03
500 224.71 ± 5.53 404.80 ± 12.40 1.00 ± 0.03 1.02 ± 0.04
NA – not available.
Biogeosciences, 18, 159–167, 2021 https://doi.org/10.5194/bg-18-159-2021F. Büks et al.: Particles under stress 165
Table 3. Mass balance that indicates the fate of OM fractions during the ultrasonication/density fractionation treatment. Bold numbers
indicate differences with p < 0.05 after t test between the 0 and 500 J mL−1 variant (n = 3).
POM (energy level) Recovery (%) Retention (%) Filter (%) DOM (%) Mass loss (%)
Pyrochar (0 J mL−1 ) 79.6 ± 3.6 8.7 ± 0.3 < 0.5 0.3 ± 0.0 11.4 ± 3.4
Pyrochar (500 J mL−1 ) 54.3 ± 5.2 34.9 ± 3.7 < 0.5 0.6 ± 0.1 10.2 ± 2.1
Farm oPOM (0 J mL−1 ) 64.8 ± 6.9 8.3 ± 0.2 < 0.5 2.7 ± 0.0 24.1 ± 6.8
Farm oPOM (500 J mL−1 ) 54.6 ± 1.9 20.3 ± 3.1 < 0.5 5.1 ± 0.2 20.0 ± 1.5
trasonic treatment of microplastics might indicate a causal as well as at 100 J mL−1 when extracting pyrochar parti-
relationship of these measures. The underlying process, how- cles. Thus, the artifact would affect the extraction of oPOM
ever, has not been studied before. We assume a mechanism from microaggregates of all samples and also the extraction
that prevents POM from density fractionation. This effect ap- of oPOM from macroaggregates in farmland soils. However,
peared in our experiment from energies around 50 J mL−1 further research has to elucidate whether these results can be
with the beginning destruction of oPOM. As mentioned in applied to natural soil samples.
Ince et al. (2001) and confirmed in Kaiser and Berhe (2014), An overestimation would have an impact, for example, on
ultrasonication-induced high temperature may reduce total C the assessment of operationally defined carbon pools within
content due to oxidative reactions, but the balance loss, con- landscapes: POM is assigned to carbon pools with turnover
stant between 0 and 500 J mL−1 in both pyrochar and farm times orders of magnitude shorter then MOM, which endures
oPOM, implies that there is no burning of organic matter due hundreds of years. Misquantification of these pools, such as
to ultrasound treatment. Also the formation of large amounts counting POM to the MOM as implied by this work, would
of water-soluble molecules and colloids could be ruled out have an influence on, for example, the estimation of SOM
in our experiment. The recovery rate decreases to the same decomposition and CO2 emissions from land-use change.
degree as the retention in the sediment increases when ultra- Carrying-over SOM from little to highly decomposed frac-
sound is applied, while filter residues and lost DOM, which tions also could alienate genuine C : N ratios, which strongly
doubled on a low level, play a minor role. Extreme thermal differ between the functional carbon pools (Wagai et al.,
conditions occurring during ultrasonication, however, may 2009). In respect to coming experiments, comminution and
explain the increased retention of POM within the sediment. reduced recovery rate of the oPOM can possibly be avoided
Sparse data on molecular alteration of organic materials due by not exceeding the energy levels mentioned here – or by
to ultrasonication showed the transformation of lignin, a ma- determining a specific energy cut-off for each natural soil in
jor constituent of plant cell walls. One hour of treatment preliminary studies. Regarding the application of higher en-
caused the formation of a high molecular weight fraction of ergy levels, detailed investigation on the underlying mecha-
about 35 % of the lignin content with molecular weights in- nism is necessary to give such recommendations.
creased 450-fold (Wells et al., 2013). This may also increase Microplastic particles, whether they are weathered follow-
the density of lignin and lignin-like fractions in soil POM ing DIN ENISO4892-2/3 or pristine, are not prone to disrup-
towards the density of the fractionation medium and reduce tion by ultrasonic treatment, and their recovery rates are sta-
their recovery rate. ble in a wide range of energy levels. We therefore assume
As a consequence of the reduction of the recovery rate, that there will be significantly less carry-over of particles
farmland, forest and pyrochar POM remain within a sandy due to comminution when extracting microplastics from soils
matrix the stronger they are treated by ultrasound. If these with ultrasonication/density fractionation. In consequence,
findings are applied to ultrasonication/density fractionation the extractive performance is higher and subsequent parti-
of natural soils, not only an increasing number of particle size cle size measurements give more valid information about
artifacts can be expected, but also the extraction of occluded the original particle size spectrum compared to the measure-
POM is increasingly hindered at a certain energy level. Af- ment of farmland, forest and pyrochar POM. This is a pos-
ter each extraction step, parts of the released oPOM remain itive sign for research on soil microplastic; however, it does
within the sedimenting fraction, a carry-over artifact. This not mean that microplastic will be fully extracted from soils
leads to an underestimation of the extracted oPOM fractions with this method. Soil microplastics appear within a wide
and an overestimation of the mineral-associated organic mat- range of sizes between some nanometers and its upper limit
ter fraction (MOM), a natural part of the soil organic mat- of 5 mm by definition. Their smallest part, fibers and mi-
ter (SOM), which is adsorbed on mineral surfaces of the crofragments produced by physical, chemical and biological
heavy fraction and mainly assumed to be molecular. Accord- erosion within the soil, might also be affected by chemical al-
ing to our data, a reduction of recovery rates would appear at teration due to both weathering and ultrasonication causing
10 J mL−1 in farmland soils and 100 J mL−1 in forest soils, enhanced retention in the sedimenting fraction. Although we
https://doi.org/10.5194/bg-18-159-2021 Biogeosciences, 18, 159–167, 2021166 F. Büks et al.: Particles under stress
have introduced billions of metric tons of microplastics into Review statement. This paper was edited by Yakov Kuzyakov and
ecosystems since the 1950s (Thompson et al., 2009; Geyer et reviewed by two anonymous referees.
al., 2017), there are still problems in producing microplastic
fragments < 100 µm on a laboratory scale with adequate use
of time and material to perform experiments within this size
References
range.
Amelung, W. and Zech, W.: Minimisation of organic matter disrup-
tion during particle-size fractionation of grassland epipedons,
5 Conclusion
Geoderma, 92, 73–85, https://doi.org/10.1016/S0016-
7061(99)00023-3, 1999.
Unlike weathered and fresh PE, PET and PBAT microplas-
Andrady, A. L.: The plastic in microplastics:
tic, soil-derived POM like occluded POM from farm and for-
a review, Mar. Pollut. Bull., 119, 12–22,
est soils and pyrochar concurrently shows comminution and https://doi.org/10.1016/j.marpolbul.2017.01.082, 2017.
a reduced recovery rate after ultrasonication and subsequent Balesdent, J., Pétraud, J. P., and Feller, C.: Effets des ultrasons sur
extraction from a sandy matrix. Applied to natural soils, parts la distribution granulométrique des matières organiques des sols,
of the farmland, forest and pyrochar POM remain within Science du sol, 29, 95–106, 1991.
the sedimenting fraction and can be misinterpreted as more Bläsing, M. and Amelung, W.: Plastics in soil: Analytical meth-
strongly bound oPOM or MOM. An overestimation as shown ods and possible sources, Sci. Total Environ., 612, 422–435,
in this study might lead to fundamentally different interpreta- https://doi.org/10.1016/j.scitotenv.2017.08.086, 2018.
tions of physical protection of SOM, functional carbon pools Breitbach, M., Bathen, D., Schmidt-Traub, H., and Ebener, H.:
and the expected mineralization rates in consequence of, for Stability of adsorber resins under mechanical compression
and ultrasonication, Polym. Advan. Technol., 13, 391–400,
example, land-use change. On the contrary, the extraction of
https://doi.org/10.1002/pat.203, 2002.
microplastics neither causes additional retention of particles Büks, F. and Kaupenjohann, M.: Enzymatic biofilm digestion in
nor alienates the particle size spectrum due to ultrasonic- soil aggregates facilitates the release of particulate organic matter
driven comminution. We conclude that density fractionation by sonication, SOIL, 2, 499–509, https://doi.org/10.5194/soil-2-
in combination with ultrasonication is an appropriate tool for 499-2016, 2016.
analyzing occlusion of microplastics within soil aggregates Büks, F., Loes van Schaik, N., and Kaupenjohann, M.: What do we
and studying the size distribution of particulate microplas- know about how the terrestrial multicellular soil fauna reacts to
tics. microplastic?, SOIL, 6, 245–267, https://doi.org/10.5194/soil-6-
245-2020, 2020.
de Souza Machado, A. A., Lau, C. W., Till, J., Kloas, W., Lehmann,
Data availability. All of the data are published within this paper A., Becker, R., and Rillig, M. C.: Impacts of Microplastics on the
and in the Supplement. Soil Biophysical Environment, Environ. Sci. Technol., 52, 9656–
9665, https://doi.org/10.1021/acs.est.8b02212, 2018.
Ding, L., Zhang, S., Wang, X., Yang, X., Zhang, C., Qi, Y.,
and Guo, X.: The occurrence and distribution characteristics
Supplement. The supplement related to this article is available on-
of microplastics in the agricultural soils of Shaanxi Province,
line at: https://doi.org/10.5194/bg-18-159-2021-supplement.
in north-western China, Sci. Total Environ., 720, 137525,
https://doi.org/10.1016/j.scitotenv.2020.137525, 2020.
Edwards, A. and Bremner, J.: Dispersion of Soil Particles by Sonic
Author contributions. FB developed the experimental concept, ex- Vibration, J. Soil Sci., 18, 47–63, https://doi.org/10.1111/j.1365-
tracted all samples and prepared the manuscript. GK performed the 2389.1967.tb01487.x, 1967a.
particle size analysis. AZ supported the development of the experi- Edwards, A. P. and Bremner, J.: Microaggregates in Soils,
mental concept. MK and FL supervised the whole study. J. Soil Sci., 18, 64–73, https://doi.org/10.1111/j.1365-
2389.1967.tb01488.x, 1967b.
Fuller, S. and Gautam, A.: A procedure for measuring microplas-
Competing interests. The authors declare that they have no conflict tics using pressurized fluid extraction, Environ. Sci. Technol., 50,
of interest. 5774–5780, https://doi.org/10.1021/acs.est.6b00816, 2016.
Geyer, R., Jambeck, J. R., and Law, K. L.: Production, use,
and fate of all plastics ever made, Sci. Adv., 3, e1700782,
Acknowledgements. Many thanks to Zoltán Mátra, who kindly https://doi.org/10.1126/sciadv.1700782, 2017.
helped us to conduct the QICPIC analysis. Golchin, A., Oades, J. M., Skjemstad, J. O., and Clarke,
P.: Study of free and occluded particulate organic matter
in soils by solid state 13 C CP/MAS NMR spectroscopy
Financial support. This open-access publication was funded by and scanning electron microscopy, Soil Res., 32, 285–309,
Technische Universität Berlin. https://doi.org/10.1071/SR9940285, 1994.
Graf-Rosenfellner, M., Cierjacks, A., Kleinschmit, B., and Lang,
F.: Soil formation and its implications for stabilization of
Biogeosciences, 18, 159–167, 2021 https://doi.org/10.5194/bg-18-159-2021F. Büks et al.: Particles under stress 167 soil organic matter in the riparian zone, Catena, 139, 9–18, Pronk, G. J., Heister, K., and Kögel-Knabner, I.: Iron https://doi.org/10.1016/j.catena.2015.11.010, 2016. Oxides as Major Available Interface Component in Graf-Rosenfellner, M., Kayser, G., Guggenberger, G., Kaiser, K., Loamy Arable Topsoils, Soil Sci. Soc. Am. J., 75, 2158, Büks, F., Kaiser, M., Mueller, C. W., Schrumpf, M., Rennert, https://doi.org/10.2136/sssaj2010.0455, 2011. T., Welp, G., and Lang, F.: Replicability of aggregate disrup- Rezaei, M., Riksen, M. J., Sirjani, E., Sameni, A., and Geis- tion by sonication – an inter-laboratory test using three differ- sen, V.: Wind erosion as a driver for transport of light ent soils from Germany, J. Plant Nutr. Soil Sc., 181, 894–904, density microplastics, Sci. Total Environ., 669, 273–281, https://doi.org/10.1002/jpln.201800152, 2018. https://doi.org/10.1016/j.scitotenv.2019.02.382, 2019. Ince, N., Tezcanli, G., Belen, R., and Apikyan, I. G.: Ultrasound as Thompson, R. C., Swan, S. H., Moore, C. J., and vom Saal, F. a catalyzer of aqueous reaction systems: the state of the art and S.: Our plastic age, Philos. T. R. Soc. B, 364, 1973–1976, environmental applications, Appl. Catal. B-Environ., 29, 167– https://doi.org/10.1098/rstb.2009.0054, 2009. 176, https://doi.org/10.1016/S0926-3373(00)00224-1, 2001. Tisdall, J.: Formation of soil aggregates and accumulation of soil Kaiser, M. and Berhe, A. A.: How does sonication af- organic matter, in: Structure and organic matter storage in agri- fect the mineral and organic constituents of soil aggre- cultural soils, Taylor & Francis Group, London, 57–96, 1996. gates? – A review, J. Plant Nutr. Soil Sc., 177, 479–495, von Lützow, M., Kögel-Knabner, I., Ekschmitt, K., Flessa, H., https://doi.org/10.1002/jpln.201300339, 2014. Guggenberger, G., Matzner, E., and Marschner, B.: SOM frac- Kale, S. K., Deshmukh, A. G., Dudhare, M. S., and Patil, V. B.: tionation methods: relevance to functional pools and to sta- Microbial degradation of plastic: a review, J. Biochem. Technol., bilization mechanisms, Soil Biol. Biochem., 39, 2183–2207, 6, 952–961, 2015. https://doi.org/10.1016/j.soilbio.2007.03.007, 2007. Katija, K., Choy, C. A., Sherlock, R. E., Sherman, A. D., and Robi- Wagai, R., Mayer, L. M., and Kitayama, K.: Nature of the son, B. H.: From the surface to the seafloor: How giant larvaceans “occluded” low-density fraction in soil organic matter stud- transport microplastics into the deep sea, Sci. Adv., 3, e1700715, ies: a critical review, Soil Sci. Plant Nutr., 55, 13–25, https://doi.org/10.1126/sciadv.1700715, 2017. https://doi.org/10.1111/j.1747-0765.2008.00356.x, 2009. Kayser, G., Graf-Rosenfellner, M., Schack-Kirchner, H., and Lang, Wells, T., Kosa, M., and Ragauskas, A. J.: Polymeriza- F.: Dynamic imaging provides novel insight into the shape and tion of Kraft lignin via ultrasonication for high-molecular- stability of soil aggregates, Eur. Jo. Soil Sci., 70, 454–465, weight applications, Ultrason. Sonochem., 20, 1463–1469, https://doi.org/10.1111/ejss.12796, 2019. https://doi.org/10.1016/j.ultsonch.2013.05.001, 2013. North, P.: Towards an absolute measurement of soil struc- Yang, X. M., Drury, C. F., Reynolds, W. D., and MacTavish, D. tural stability using ultrasound, J. Soil Sci., 27, 451–459, C.: Use of sonication to determine the size distributions of soil https://doi.org/10.1111/j.1365-2389.1976.tb02014.x, 1976. particles and organic matter, Can. J. Soil Sci., 89, 413–419, O’Connor, D., Pan, S., Shen, Z., Song, Y., Jin, Y., Wu, W. M., and https://doi.org/10.4141/cjss08063, 2009. Hou, D.: Microplastics undergo accelerated vertical migration in Zhang, G. S. and Liu, Y. F.: The distribution of microplastics in soil sand soil due to small size and wet-dry cycles, Environ. Pollut., aggregate fractions in southwestern China, Sci. Total Environ., 249, 527–534, https://doi.org/10.1016/j.envpol.2019.03.092, 642, 12–20, https://doi.org/10.1016/j.scitotenv.2018.06.004, 2019. 2018. Oorts, K., Vanlauwe, B., Recous, S., and Merckx, R.: Redistri- Zhang, S., Yang, X., Gertsen, H., Peters, P., Salánki, T., and Geissen, bution of particulate organic matter during ultrasonic disper- V.: A simple method for the extraction and identification of light sion of highly weathered soils, Eur. J. Soil Sci., 56, 77–91, density microplastics from soil, Sci. Total Environ., 616, 1056– https://doi.org/10.1111/j.1351-0754.2004.00654.x, 2005. 1065, https://doi.org/10.1016/j.scitotenv.2017.10.213, 2018. Pickett, J. E.: Weathering of plastics, in: Handbook of Environmen- Zubris, K. A. V. and Richards, B. K.: Synthetic fibers as an indica- tal Degradation of Materials, 163–184, William Andrew Publish- tor of land application of sludge, Environ. Pollut., 138, 201–211, ing, Oxford, UK, 2018. https://doi.org/10.1016/j.envpol.2005.04.013, 2005. https://doi.org/10.5194/bg-18-159-2021 Biogeosciences, 18, 159–167, 2021
You can also read