Measuring Digital Pathology Throughput and Tissue Dropouts
←
→
Page content transcription
If your browser does not render page correctly, please read the page content below
[Downloaded free from http://www.jpathinformatics.org on Sunday, January 9, 2022, IP: 243.195.204.225]

                                                                          Original Article

         Measuring Digital Pathology Throughput and Tissue Dropouts
                                   George L. Mutter1,2, David S. Milstone1,2, David H. Hwang1,2, Stephanie Siegmund1,2, Alexander Bruce1
              Department of Pathology, Brigham and Women’s Hospital, Boston, MA, USA, 2Department of Pathology, Harvard Medical School, Boston, MA, USA
              1

      Submitted: 19‑Jan‑2021                    Revised: 05‑Jun‑2021                   Accepted: 20-Jun-2021                        Published: 08-Jan-2022

        Abstract
      Background: Digital pathology operations that precede viewing by a pathologist have a substantial impact on costs and fidelity of the
      digital image. Scan time and file size determine throughput and storage costs, whereas tissue omission during digital capture (“dropouts”)
      compromises downstream interpretation. We compared how these variables differ across scanners. Methods: A 212 slide set randomly
      selected from a gynecologic‑gestational pathology practice was used to benchmark scan time, file size, and image completeness. Workflows
      included the Hamamatsu S210 scanner (operated under default and optimized profiles) and the Leica GT450. Digital tissue dropouts were
      detected by the aligned overlay of macroscopic glass slide camera images (reference) with images created by the slide scanners whole slide
      images. Results: File size and scan time were highly correlated within each platform. Differences in GT450, default S210, and optimized S210
      performance were seen in average file size (1.4 vs. 2.5 vs. 3.4 GB) and scan time (93 vs. 376 vs. 721 s). Dropouts were seen in 29.5% (186/631)
      of successful scans overall: from a low of 13.7% (29/212) for the optimized S210 profile, followed by 34.6% (73/211) for the GT450 and
      40.4% (84/208) for the default profile S210 profile. Small dislodged fragments, “shards,” were dropped in 22.2% (140/631) of slides, followed
      by tissue marginalized at the glass slide edges, 6.2% (39/631). “Unique dropouts,” those for which no equivalent appeared elsewhere in the
      scan, occurred in only three slides. Of these, 67% (2/3) were “floaters” or contaminants from other cases. Conclusions: Scanning speed and
      resultant file size vary greatly by scanner type, scanner operation settings, and clinical specimen mix (tissue type, tissue area). Digital image
      fidelity as measured by tissue dropout frequency and dropout type also varies according to the tissue type and scanner. Dropped tissues very
      rarely (1/631) represent actual specimen tissues that are not represented elsewhere in the scan, so in most cases cannot alter the diagnosis. Digital
      pathology platforms vary in their output efficiency and image fidelity to the glass original and should be matched to the intended application.

      Keywords: Digital pathology, dropouts, image analysis, operations, scanner, whole‑slide imaging

      Introduction                                                                      clinical use has been reported in some centralized hospital
                                                                                        systems,[5,6] in subspecialty practices,[7] and decentralized
      Digital pathology imaging applications in research, education,
                                                                                        health‑care systems lacking pathologists at all delivery sites.[8]
      and clinical diagnosis are fulfilled by a diversity of “whole
                                                                                        Regulatory guidance for these activities in the United States
      slide” digital pathology scanners. In most cases, “whole
                                                                                        is in its infancy, for many years having focused on Food
      slide” designation is a misnomer, as scanners typically capture
                                                                                        and Drug Administration‑mandated engineering controls of
      high‑resolution images only in slide areas where tissue is
                                                                                        medical devices (scanners), and vendor designed and executed
      detected using a vendor‑specific algorithm. This is by design,
                                                                                        diagnostic impact studies embedded within regulatory, rather
      as the omission of uncaptured areas reduces scanning time
                                                                                        than public peer‑reviewed documents. Pathologist end users
      and file size, at a cost of unintended exclusion of some tissues
                                                                                        have directly evaluated endpoints with which they are most
      known as “dropouts.” Key parameters to be considered include
      capture conditions (lighting, focus, color space), image file                                             Address for correspondence: Prof. George L. Mutter,
      characteristics, throughput, cost of file storage, and ability to                          Department of Pathology, Brigham and Women’s Hospital, 75 Francis
      integrate with a preexisting or future ecosystem of networked                                                                 Street, Boston, MA 02115, USA.
      hardware and software from scanner to end viewer.                                                                          E‑mail: gmutter@bwh.harvard.edu

      Electronic delivery of digital histology images is an enabling
                                                                                        This is an open access journal, and articles are distributed under the terms of
      technology for remote diagnosis that has recently seen                            the Creative Commons Attribution‑NonCommercial‑ShareAlike 4.0 License, which
      expanded use during the COVID‑19 pandemic.[1‑4] Prepandemic                       allows others to remix, tweak, and build upon the work non‑commercially, as long
                                                                                        as appropriate credit is given and the new creations are licensed under the identical
                                 Access this article online                             terms.
          Quick Response Code:                                                          For reprints contact: WKHLRPMedknow_reprints@wolterskluwer.com
                                      Website:
                                      www.jpathinformatics.org
                                                                                         How to cite this article: Mutter GL, Milstone DS, Hwang DH, Siegmund S,
                                                                                         Bruce A. Measuring digital pathology throughput and tissue dropouts.
                                                                                         J Pathol Inform 2022;13:8.
                                      DOI:
                                      10.4103/jpi.jpi_5_21                               Available FREE in open access from: http://www.jpathinformatics.org/
                                                                                         text.asp?2022/13/1/8/335332

            © 2021 Journal of Pathology Informatics | Published by Wolters Kluwer - Medknow                                                                               1
[Downloaded free from http://www.jpathinformatics.org on Sunday, January 9, 2022, IP: 243.195.204.225]

      J Pathol Inform 2021, 1:13                                                                http://www.jpathinformatics.org/content/13/1/8

      vested and familiar; interobserver concordance of subjective           Methods
      diagnoses is rendered by a human pathologist.[9‑12] The results
      comparing subjective interpretation of one platform (glass)            Series compilation and slide preparation
      with another (digital) are an important but imprecise endpoint,        Histological sections of 212 surgical pathology specimens
      as the baseline extent of diagnostic variation using glass alone       were randomly selected from the Women’s and Perinatal
      can be quite high.[13‑17] Key aspects of digital file production,      Pathology service at Brigham and Women’s Hospital (Boston,
      especially the manner in which tissue characteristics interact         MA, USA) as follows. Pathology reports were retrieved for
      with scanner type and settings to determine image quality, are         4077 specimens (“case”) received as wet tissue (excluding
                                                                             extramural slide consults) during a 3‑month interval from
      practice‑contextual elements in the digital pathology pipeline.
                                                                             February to April 2018. Each specimen was assigned a
      Vendor estimates of operational throughput (scan time), digital
                                                                             random number, and the number of component blocks was
      storage costs (file size), and diagnostic errors (over or under
                                                                             recorded. The case list was then sorted by a random number,
      diagnosis) may not extrapolate to a particular user’s specific
                                                                             and the first 212 specimens in the random‑sorted list with
      case‑mix or diagnostic goals.
                                                                             available blocks were selected for the study. For each case,
      Scanner dropouts are defined as areas of tissue on the                 a different random number assignment was used to select
      glass slide that are omitted in the digital image and are              one component block for the series. These 212 blocks
      often replaced with background‑matched or white/gray                   were retrieved, sectioned at 4 µm, routinely stained with
      space. These are perhaps the most challenging element                  hematoxylin and eosin, and mounted with glass coverslips in
      of digital imaging to measure, as source data created for              an automated coverslipping machine. All histology processes
      regulatory certification are often not in the public domain.           were performed using routine procedures in our clinical
      Characterization of extent and character of dropouts is not            histology laboratory before finished slides were labeled
      part of most glass‑digital diagnostic concordance studies, and         with an anonymized barcode identifier. Table 1 shows the
      when performed is usually compromised by the limitations of            distribution of specimens by anatomic site of origin (tissue
      a subjective human observer. For example, the replacement              type) and specimen size (big = trimmed resection specimen,
      of skipped areas with background‑matched space can lead                bx = small biopsy, or fragments).
      the pathologist observer to underestimate the amount of
      omitted slide. Our department has begun to address some of             Macroscopic camera photography, “Reference”
                                                                             Stained glass slides were photographed at high resolution (21MP,
      these practical issues like due diligence preparation for a new
                                                                             5616 × 3744 px) on a backlit light box using a Canon EOS 5D
      digital pathology effort. We created representative test slide
                                                                             Mark II camera outfitted with a macro lens (Canon EF100 mm
      sets from actual patient material and benchmarked scanner
                                                                             f/2.8L Macro IS USM). Image postprocessing in Adobe
      operations and image quality using objective metrics such
                                                                             Lightroom Classic v 9.1 included lens aberration correction,
      as image analysis. Pointedly, our effort was directed at those
                                                                             adjustment of contrast and brightness, and conversion to gray
      digital operations that take place before the pathologist ever
                                                                             scale.
      looks at an image.
      We here examine elements of digital pathology operations in            Whole‑slide scanning: “wsi”
      a specialized clinical practice that have the potential to impact      All slides were batch imaged in whole‑slide scanners using
      throughput efficiency, storage costs, and fidelity of the resultant    supplied autoloader racks under three conditions [Details
      digital image. We passed a representative randomly selected            in Supplemental Data]: (1) Hamamatsu S210 using default
      212 slide test set of gynecologic and perinatal pathology              brightfield (“default”) profile settings; (2) Hamamatsu
      slides through different whole‑slide scanners and differing            S210 using profile settings empirically optimized (“opt”)
      scan profile configurations to generate digital whole‑slide            to minimize tissue dropouts; and (3) Leica GT450 standard
      images. Use of a single slide set across all conditions permitted      settings. Scan time was estimated from file timestamps (S210)
      controlled comparison between scanners. Scanning time                  or scanner log (GT450) and the resulting file size was read
      and digital file size were collected as measures of scanning           from the destination computer operating system (Windows 10).
      throughput and storage requirement (costs), respectively. We           Measurements of file size were captured as actual bytes per file,
                                                                             and scaling of units was performed on a decimal scale (e.g., 1
      then used image analysis to overlay reference glass slides
                                                                             byte = 10000 bytes; 1 KB = 10001 bytes, 1 MB = 10002 bytes;
      with their respective scanned file images. This allowed
                                                                             1 GB = 10003 bytes).
      high‑sensitivity identification of “dropouts,” areas of tissue
      present in the source glass slide that were overlooked in the          Full‑frame tiff images of the entire field captured by the
      scanning process and thus absent in the scanned whole‑slide            scanner were generated by opening each whole‑slide image
      images. Stratification of scanned slides by tissue type and            file (ndpi = S210 file type, svs = GT450 file type) in a
      scale (small biopsies, large resection specimens) allowed us           multiformat viewer (NDP.View Plus v2.7.43 + Hamamatsu
      to determine that file characteristics and dropout rates are           Photonics K.K., 2019), and exporting the screen contents as
      co‑dependent on scanner type, scanning software settings, and          recompiled from the source wsi to a tiff file that was cropped to
      tissue characteristics.                                                the margins of the captured field. TIFF files were imported into

       2                                                                                                   Journal of Pathology Informatics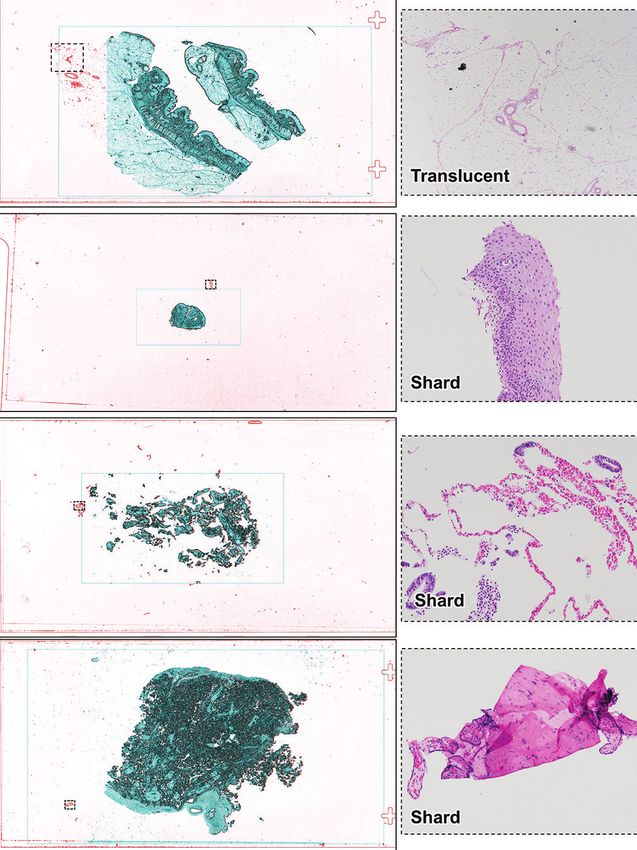
[Downloaded free from http://www.jpathinformatics.org on Sunday, January 9, 2022, IP: 243.195.204.225]

      J Pathol Inform 2021, 1:13                                                                        http://www.jpathinformatics.org/content/13/1/8

       Table 1: Case series, by tissue type and specimen size
       Tissue type                 Big                Bx                 Total
       Bowel                         1                 0                   1
       Cervix                        9                23                  32
                                                                                 A                                       B
       Endometrium                   0                58                  58
       Fetus                         3                 0                   3
       Lymph node                    4                 0                   4
       Omentum                       2                 0                   2
       Ovary                        11                 0                  11
       Peritoneum                    0                 6                   6                        C
       Placenta                     58                 0                  58
       Conceptus                     0                18                  18
       Skin                          1                 0                   1
       Fallopian tube                3                 0                   3
       Uterus                        6                 0                   6
       Vagina                        1                 2                   3     Figure 1: Overlay of aligned reference (camera) and scanner images
       Vulva                         1                 5                   6     to detect dropouts. High‑contrast grayscale images from a lossless
       Total                       100               112                 212     camera (A, reference) and “wsi” digital scanner whole‑slide image (B,
       Big: Trimmed resection specimen, Bx: Small biopsy, or fragments           Hamamatsu S210, default brightfield settings) were rescaled, aligned, and
                                                                                 color coded (C, overlay) so that superimposed overlapping areas are blue,
      Adobe Lightroom for adjustment of contrast and brightness,                 and dropouts are red. Details of three dropout regions include translucent
      and conversion to gray scale.                                              fat (c1, c3) and tissue present on the margins of the slide (c2, “edge”).
                                                                                 Case BD2019‑2222, tissue from aortic lymph node dissection
      Preparation of color‑coded overlays
      Paired grayscale reference and wsi images were rescaled,                   reference image. For each slide with dropouts, the predominant
      aligned, and prepared as translucent overlays using StereoPhoto            category was recorded as pale fat (translucent), small shattered
      Maker Pro (64 bit) v6.02 (2020, by Masuji Suto and David                   fragments (shards), or peripheral or edge location [Table 2].
      Sykes, available online at http://stereo.jpn.org/eng/index.
      html) [Figure 1]. This produced a red (reference)–cyan (wsi                For those whole‑slide images with dropouts, the extent of
      scanner image) overlay in which tissue dropped out in the                  dropout was estimated visually as an approximate percentage
      scanner image was visible as a red profile contributed by the              of tissue missing in the wsi compared to all tissue present in
      reference image. Fragment edges were highlighted in Adobe                  the reference image.
      Photoshop Creative Cloud (release 21.2.0, 64 bit), using the
                                                                                 Estimation of “Unique” dropout frequency [Figure 7]
      “Find Edges” filter. The resultant overlay is shown in Figure 1c,
                                                                                 We scored fragments missing from the digital image according
      along with examples of types of tissue dropped out. A rectangle
      corresponding to the computer screen boundaries and aspect                 to histologic similarity to those retained. Guided by color‑coded
      ratio used at the time of scanner wsi screen export is seen in             overlay dropout maps for each scan, digital slide tissue dropouts
      the overlays as a pale cyan rectangle. This is an artifact of the          were photographed from the original glass slide using a standard
      workflow, which was ignored during visual interpretation.                  optical photomicroscope. The reference (glass original) static
                                                                                 image of each dropout was opened on one computer monitor,
      Identification and classification of tissue dropouts in                    and the corresponding zoomable digital scan image opened
      whole‑slide scanner images                                                 on the second of a dual monitor display. A subspecialty
      Color‑coded overlays of reference and wsi images were                      gynecologic pathologist (GLM) then searched the digital
      screened for red signal indicating object areas present in the             whole‑slide image for diagnostically equivalent tissues
      reference but missing in the wsi images [Figure 1, c1-3].                  matching those documented in the dropout photomicrograph.
      These were compared with the original high‑resolution color
                                                                                 The scanned slide was then summarily scored once: either (1)
      reference images, and source glass slides viewed under a
                                                                                 unique dropout, if no equivalent of one or more dropout tissue
      standard optical microscope to classify the nature of the
                                                                                 area(s) was represented in the scan, or (2) nonunique dropouts,
      putative dropout. The screening overlays were very sensitive
      and capable of detecting contaminating dust and floating                   when tissues comparable to all noted dropouts (“surrogates”)
      cellular contaminants [Figure 2]. These artifacts were not                 were present within the digital whole‑slide scan. Thus, each
      interpreted as dropouts for purposes of this study. Enumeration            slide containing a dropout received one overall score as unique
      as a dropout was reserved for regions of native tissue, or                 or nonunique.
      sectioned mucus/blood/cell aggregates.                                     Statistical analysis
      We scored each wsi as a dropout whenever visual inspection                 All statistical analyses and graphical data display were performed
      revealed one or more wsi dropped fragment(s) relative to the               using SYSTAT (v13.1, Systat Software, Inc., San Jose, CA).

            Journal of Pathology Informatics                                                                                                             3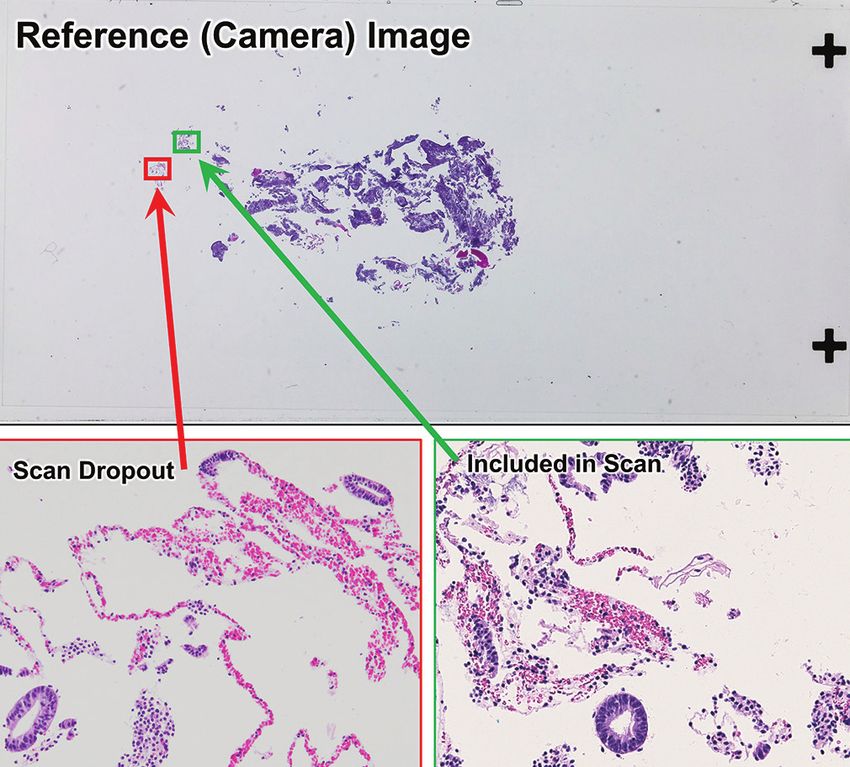
[Downloaded free from http://www.jpathinformatics.org on Sunday, January 9, 2022, IP: 243.195.204.225]

      J Pathol Inform 2021, 1:13                                                                           http://www.jpathinformatics.org/content/13/1/8

       a                                     b

       c                                     d
      Figure 2: Artifacts excluded from tissue “dropout” tally. The dropout
      detection process [Figure 01] was capable of detecting very small,              Figure 3: File size and scan time, by scanner (Leica GT450, Hamamatsu
      refractile, and folded contaminating structures that were artifacts not         S210 default settings, Hamamatsu S210 optimized settings). File size
      representative of the tissue section present on the slide. These included       (x-axis, x0.5) was proportional to scan time (yaxis, y0.5) on all conditions.
      dust and fibers (a), compression boundaries caught by the microtome             The GT450 had shortest scan times and smallest file size, whereas the
      knife along the side edge of the paraffin block (b), individual disaggregated   S210 using settings optimized to minimize dropouts was longest in
      cells (c), and floating contaminants (d, clump of squamous cells in a           scan time and produced the largest files. All 212 slides were scanned
      placental section)                                                              successfully with the S210 optimum, with one failure with the GT450
                                                                                      (211 scanned), and four failures with the S210 default (208 scanned)

      Results                                                                         For all scanners, greater amount of tissue on the slide [Table 3,
      Complete scan failures                                                          bigs vs. bx] significantly prolonged scan time and increased
      Complete scan failure, or inability of the scanner to                           file size (Kruskal–Wallis P ≤ 0.001 for all comparisons).
      generate a digital file, is distinct from tissue dropout                        This matches expectations, as the scanning algorithms for all
      in which a created digital file is lacking some tissue                          scanners involve high‑resolution capture only of those areas
      fragments present on the glass slide. Of the 212 slides                         of a slide in which tissue is detected. This trend held across
      scanned, scan failure frequency and tissue characteristics                      tissue sites (e.g., cervix, placenta, etc.) included in the study.
      varied by scanner and scanning profile. Four (4/212, 1.9%)
      S210def scan failures were attributed to shattered tissues                      Dropout type, by a scanner
      composed entirely of minute fragments without a focus                           Table 2 tallies each slide once by a scanner. When a dropout is
      point for the scanner. An additional (1/212, 0.5%) GT450                        present, it is noted by dropout type best representing the whole
      scan failure was attributed to a large blood clot where                         slide. Excluding the five failed scans that did not produce any
      red cells scattered transmitted light, thereby denying the                      wsi file to evaluate, there were a total of 631 scans performed
      scanner a stable focus point.                                                   with 70.5% (445/631) dropout‑free scans. The most frequent
                                                                                      dropout type is “shards,” seen in 22.2% (140/631) of slides,
      File size and scan time                                                         followed by 6.2% (39/631) edge misses. The frequency of
      The file size was proportional to scan time for all scanner                     dropout types varied greatly across scanners (Chi‑square
      conditions, but the quantitative relationship differed                          P < 0.001). The S210Opt had the lowest dropout rate at
      systematically by scanner [Figure 3]. The fastest scan time and                 13.7% (29/212), followed by the GT450 at 34.6% (73/211)
      smallest file size were seen with the GT450 [Figure 3, red circles],            and S210Def at 40.4% (84/208). All were prone to the
      and the longest scan time and biggest file sizes were seen with                 dropout of small shards, and the GT450 had a tendency to
      the S210 operated under a setting profile [opt, Figure 3, green                 miss edge domains. Typical examples of dropouts are shown
      crosses] designed to minimize dropouts. The S210 default                        in Figures 4‑6.
      profile settings were intermediate for both of these parameters.
      The linear relationships between file size (x, GB) and scan                     Estimated percentage of tissue dropped out
      time (y, seconds) can also be summarized as a least‑squares                     The majority of detected dropouts were very small in
      linear regression formula by scanner type as follows: (1)                       comparison to the total tissue present on the slide. This is
      GT450 (r = 0.828), y seconds = 32.3 + 37 (file size in GB); (2)                 illustrated in representative images [Figures 4‑6] and tabulated
      S210def (r = 0.887), y seconds = 122 + 102 (file size in GB);                   as an estimated percentage of tissue lost by scanner [Table 4].
      and (3) S210opt (r = 0.930), y seconds = 158 + 164 (file size                   Notably, 78.5% (146/186) of dropouts involved 2% or less
      in GB).                                                                         of all tissue on the slide. Larger percentage of loss were

       4                                                                                                                 Journal of Pathology Informatics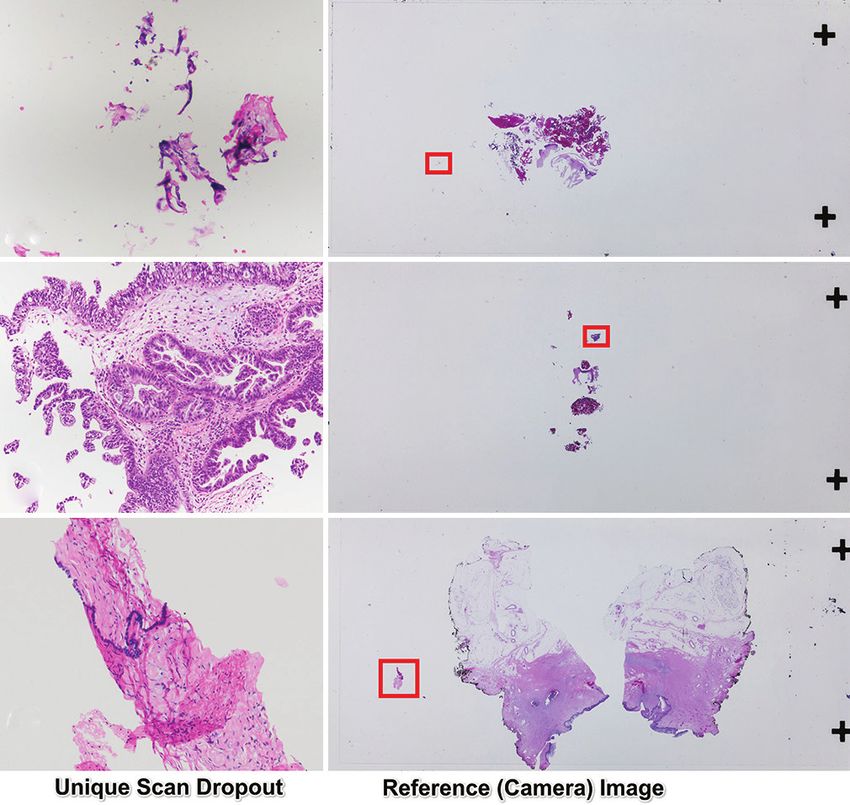
[Downloaded free from http://www.jpathinformatics.org on Sunday, January 9, 2022, IP: 243.195.204.225]

      J Pathol Inform 2021, 1:13                                                                        http://www.jpathinformatics.org/content/13/1/8

                                                                                   a
       a

       b                                                                           b

       c                                                                           c

       d
                                                                                   d
      Figure 4: Hamamatsu S210 (default profile) scan dropout examples (a-d).
                                                                                   Figure 5: Hamamatsu S210 (optimized profile) scan dropout examples
      Each row shows one slide overlay (Left) and dropout detail (Right). In
                                                                                   (a-d). Each row shows one slide overlay (Left) and dropout detail (Right).
      the overlay dropped tissues appear red and captured tissues cyan-blue
                                                                                   In the overlay dropped tissues appear red and captured tissues cyan-blue
      (See figure 01). Dashed rectangles in the colored overlay indicate framing
                                                                                   (See figure 01). Dashed rectangles in the colored overlay indicate framing
      of the detail photomicrograph captured from original H&E glass slides.
                                                                                   of the detail photomicrograph captured from original H&E glass slides.
      Dropouts were classified according to Table 2
                                                                                   Dropouts were classified according to Table 2

      most common in the S210Def where fully 35.7% (30/84) of
                                                                                   glass and scanned images is a highly sensitive method capable
      dropouts involved 3% or more of the tissue, and 3.6% (3/84)
                                                                                   of objectively detecting very small (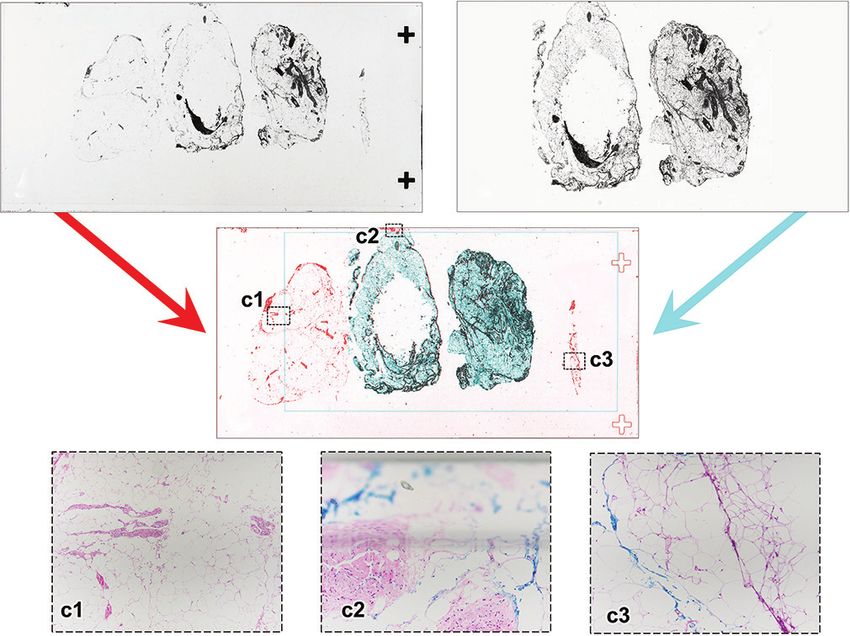
[Downloaded free from http://www.jpathinformatics.org on Sunday, January 9, 2022, IP: 243.195.204.225]

      J Pathol Inform 2021, 1:13                                                                         http://www.jpathinformatics.org/content/13/1/8

       a

       b

       c                                                                            Figure 7: Surrogate representation of non-unique dropout tissues within
                                                                                    scanned area. Some tissues present in the original glass slide (reference
                                                                                    camera image, top) were dropped during creation of the digital whole slide
                                                                                    image (dropout, red frame). In this example the dropout tissue repertoire
                                                                                    was non-unique, as histologically equivalent tissues were included within
                                                                                    the final digital scan (green frame). Scanned image for endometrial biopsy
                                                                                    case DB2019-2243 from Hamamatsu S210 (default profile). See Figure 4c
                                                                                    for color overlay of reference image with digital scan.
       d
      Figure 6: Leica GT450 scan dropout examples (a-d). Each row shows             primary fatty lesions and fatty node dissections could be
      one slide overlay (Left) and dropout detail (Right). In the overlay dropped   underrepresented.
      tissues appear red and captured tissues cyanblue (See figure 01).
      Dashed rectangles in the colored overlay indicate framing of the detail       Of the 212 slides scanned on three platforms, there were
      photomicrograph captured from original H&E glass slides. Dropouts were        only three instances of unique dropped tissue [Table 5].
      classified according to Table 2                                               All omissions were generated by the default setting S210
                                                                                    scanner, with one glass slide having an identical dropout
      dropouts (98%, 178/182) made them of low diagnostic                           on the GT450 [Figure 8a]. Of these, 67% (2/3) were likely
      impact. Highly fragmented specimens are most prone to                         “floaters” or contaminants from other cases [Figure 8].
      distribute comparable diagnostic tissue in both scanned and                   A closer look at unique dropouts includes two determined
      unscanned regions of the slide [Figures 4c and 5b]. Dropouts                  by context to be probable “floater” contaminants from
      of mucus and blood with or without dissociated cellular                       another case: (1) placental villi in an endometrial sample
      elements [Figures 5b‑c and 6b] are typically of insufficient
                                                                                    from a 71‑year‑old patient [Figure 8a] and (2) folded simple
      physical integrity to be diagnostic. Preanalytical tissue
                                                                                    epithelium fragment in a vulvectomy with reactive stratified
      processing steps can remediate edge dropouts, including
                                                                                    squamous epithelium [Figure 8c]. The third slide from a
      trimming tissue blocks to permit a few millimeters clearance
                                                                                    patient with an endocervical neoplasm had detached neoplastic
      across the slide width and instructing histology technicians
                                                                                    epithelium in the digital image, but the single intact fragment
      to maintain this clearance during embedding and sectioning.
                                                                                    of stroma + glands was excluded. It is unlikely the neoplasm
      When they occur, the significance of slide edge overhangs
                                                                                    would have been missed altogether in the digital image, but
      of large tissue slabs [Figures 5a and 6a] may be informed
                                                                                    the lack of intact architecture compromises its classification.
      by examination of visible portions of tissue. If the tissue
                                                                                    This dropout was only seen with the default S210. We conclude
      context across the visible fragment is relatively uniform, and
                                                                                    that unique dropouts were most common with default S210
      there are no concerns for critical spatial information (such as
                                                                                    scans, and were reduced in frequency, and clinical relevance,
      inked margins), the edge dropout is likely to be insignificant.
                                                                                    by use of the GT450, or optimization of S210 scanner settings.
      Stray dropped intact tissue slices, such as the examples
      from cervical cone biopsies [Figures 4b and 6d], were also                    Our study suggests several approaches to the mitigation
      nonunique and could easily be questioned by the pathologist                   of digital dropouts. First, laboratories should avoid tissue
      as floating contaminants. More concerning are failures of the                 placement on glass slide regions (such as extreme edges)
      scanner to occasionally recognize large areas of translucent                  inaccessible to the scanner. Second, scanner settings for
      tissue such as fat [Figure 4a], raising the possibility that                  user‑configurable instruments such as the Hamamatsu S210 can

       6                                                                                                              Journal of Pathology Informatics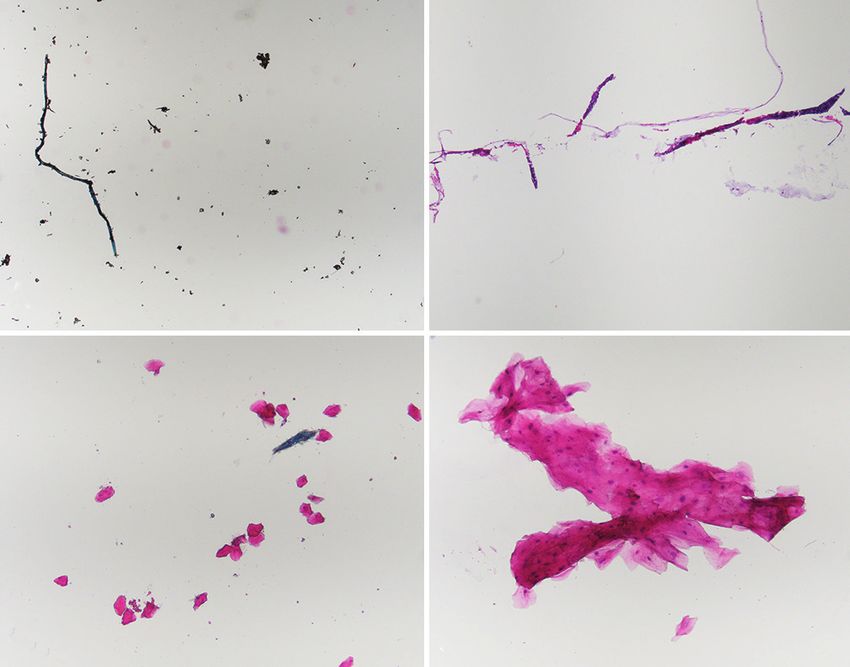
[Downloaded free from http://www.jpathinformatics.org on Sunday, January 9, 2022, IP: 243.195.204.225]

      J Pathol Inform 2021, 1:13                                                                              http://www.jpathinformatics.org/content/13/1/8

       Table 2: Dropout types, by dropout class and scanner
       Dropout type                   S210Def, n (%)                   S210Opt, n (%)                      GT450, n (%)                 Total all scanners, n (%)
       Edge miss                             5 (6.0)                            8 (27.6)                         26 (35.6)                             39 (21.0)
       Small shard                         73 (86.9)                           21 (72.4)                         47 (64.4)                            141 (75.8)
       Translucent                           6 (7.1)                                0                                 0                                 6 (3.2)
       Total                                84 (100)                           29 (100)                          73 (100)                             186 (100)
       29.5% of all successful scans had dropouts (186 dropouts/631 successful scans), which could be classified by their qualitative characteristics: scan window
       location (edge miss), tissue size (small shard), or optical density (translucent, such as fat). Each slide is listed only once, by predominant dropout type.
       Excluded are failed scans not resulting in a file (S210Def n=4, GT450 n=1)

       Table 3: Scan time and size of files, by scanner and tissue type
       Tissue              Type                 Number of files                            Average file size (Gb)                   Average scan time (s)
                                      S210Def        S210Opt         GT450         S210Def        S210Opt        GT450       S210Def         S210Opt        GT450
       Bowel             Big            1              1             1               2.2             3.2            1.6         363             727            91
       Cervix            Big            9              9             9               1.5             3.1            0.9         257             656            56
       Cervix            Bx            22             23            23               0.7             2.4            0.4         179             545            44
       Endometrium       Bx            57             58            58               2.2             3.3            1.3         370             717            89
       Fetus             Big            3              3             3               3.1             3.9            1.7         443             780            89
       Lymph node        Big            4              4             4               2.2             3.4            1.4         358             768            99
       Omentum           Big            2              2             2               1.3             2.8            1.1         287             669           101
       Ovary             Big           11             11            11               3.1             3.8            1.7         467             772           101
       Peritoneum        Bx             5              6             6               1.9             3.0            1.0         317             652            72
       Placenta          Big           58             58            58               3.3             3.9            1.9         433             772            95
       Conceptus         Bx            18             18            17               3.3             3.9            1.8         472             818           105
       Skin              Big            1              1             1               2.7             3.6            1.6         347             721            82
       Fallopian tube    Big            3              3             3               3.4             4.2            1.6         614             939            93
       Uterus            Big            6              6             6               3.9             4.5            2.4         490             824           109
       Vagina            Big            1              1             1               4.9             5.3            2.7         600             979           115
       Vagina            Bx             2              2             2               0.8             1.9            0.5         211             422            39
       Vulva             Big            1              1             1               2.2             3.0            1.2         396             639            68
       Vulva             Bx             4              5             5               0.2             2.3            0.2          75             502            26
       All tissues       Total        208            212           211               2.5             3.4            1.4         376             721            85
       All tissues, by   Bx           108            112           111               2.0             3.1            1.1         332             679            78
       size              Bigs         100            100           100               3.0             3.8            1.8         424             768            93
       Big: Trimmed resection specimen, Bx: Small biopsy, or fragments

                                                                                        default S210 settings prioritized speed and file size (average
       Table 4: Estimated dropout extent (tissue %), by scanner
                                                                                        2.5GB files in 376 s) at the expense of completeness of tissue
       Dropout, tissue %      S210Def       S210Opt      GT450      Total, n (%)        capture such that 40% of all scans had detectible dropouts.
       0                           124         183       138      445 (70.52)           Empirical modification of S210 scan profile settings to increase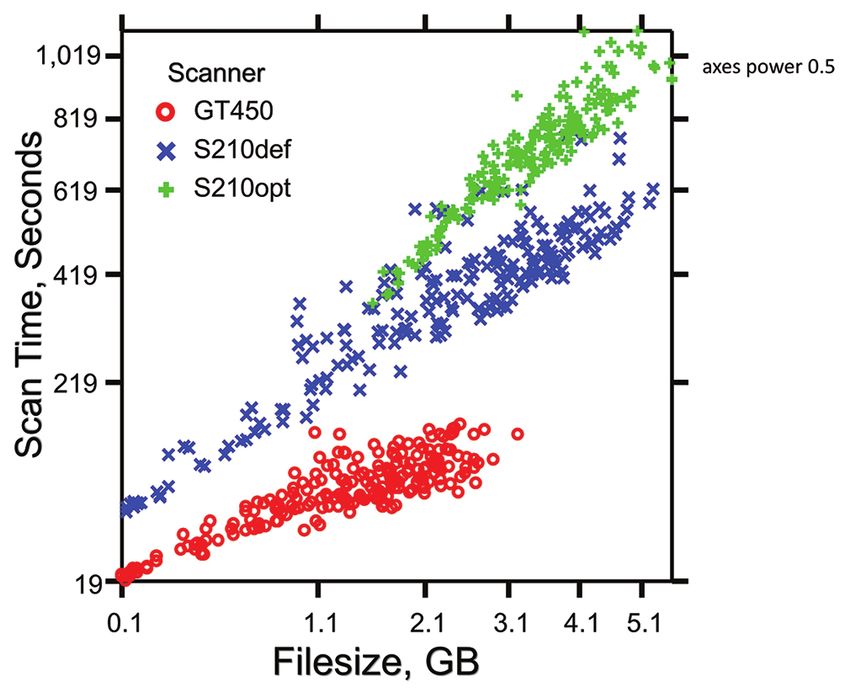
[Downloaded free from http://www.jpathinformatics.org on Sunday, January 9, 2022, IP: 243.195.204.225]

      J Pathol Inform 2021, 1:13                                                                             http://www.jpathinformatics.org/content/13/1/8

       Table 5: Frequency of histologically unique scan dropouts
       Scanner                      Profile                Number of slides with               Number of slides with                Total number of slides with
                                                            nonunique dropouts                   unique dropouts                     dropouts (of total scans)
       Hamamatsu S210                   Default                          81                                  3                              84 (40.4% of 208)
       Hamamatsu S210                   Optimized                        29                                  0                              29 (13.7% of 212)
       GT450                            Standard                         72                                  1                              73 (34.6% of 211)
       Total                            All                             182                                  4                             186 (29.5% of 631)
       Dropped tissues not represented by comparable histologies in the retained scan (“Unique dropouts”) were seen in only in only 3 slides of the 212 slide study
       set [illustrated in Figure 8]. This represented 4 instances amongst 186 dropouts across the three scanner platforms [Figure 8A was dropped on two platforms]

                                                                                       case, vary greatly. In our hospital, for example, a cervical
                                                                                       biopsy averages 2.3 blocks/case, whereas a full cervical profile
                                                                                       sliced from a larger specimen averages 9.9 blocks/case. All of
                                                                                       these factors must be taken into consideration to accurately
                                                                                       estimate the number of scanners and amount of file storage
       a                                                                               required to support a pathology practice.
                                                                                       This is a study of scanning operations and tissue capture fidelity
                                                                                       in digital pathology, with the goal of establishing benchmark
                                                                                       metrics for prepathologist digital scan production. There are
                                                                                       already many excellent studies documenting glass‑digital
                                                                                       equivalence of the human pathologist diagnostic endpoint.
       b                                                                               This is evidence that digital pathology implementation under
                                                                                       a variety of infrastructure types and across diverse practice
                                                                                       settings can succeed. For those groups contemplating such a
                                                                                       transition, we have shown that scanning speed and resultant
                                                                                       file size vary greatly by scanner type, scanner operation
                                                                                       settings, and specimen mix – parameters of high relevance to
                                                                                       throughput and overhead cost of a digital pathology operation.
       c                                                                               Correspondingly, digital image fidelity as measured by tissue
      Figure 8: Unique digital dropout tissues not represented in scanned              dropout frequency and dropout type also varies according to
      area. All unique tissue dropouts are illustrated here (left) alongside the       the same tissue and scanning parameters.
      source location within the whole‑slide reference camera image (right). (a)
      S210default and GT450 unique dropout. Nondescript fragments of                   Acknowledgments
      probable contaminating placental villi in endometrial curettings of a            The authors would like to acknowledge the assistance of Delia
      71‑year‑old patient showing inactive endometrium. (b) S210 default               Liepins (Director of Clinical Operations, BWH Pathology), for
      unique dropout. Intact fragment of neoplastic endocervical glands in             retrieval of tissue blocks, and Qing Sun (Histology Laboratory
      association with attached stroma, in a cervical biopsy diagnosed as scant
                                                                                       Manager, BWH), for preparation of histological sections.
      fragments of neoplastic glandular epithelium. This dropout is considered
      unique because all neoplastic glandular epithelia retained in the digital        Financial support and sponsorship
      image are detached and unassociated with their stromal context. (c)              Nil.
      S210 default unique dropout. Simple epithelium lined fibrous tissue in
      vulvectomy with reactive stratified squamous epidermis. The epithelial           Conflicts of interest
      lining of the dropped fragment is not represented in the digital image,          There are no conflicts of interest.
      and may represent either a contaminant from another case, or separate
      fragment of a dermal epithelial inclusion
                                                                                       References
      The test set of 212 slides (212 randomly selected surgical                       1.   Cimadamore A, Lopez‑Beltran A, Scarpelli M, Cheng L, Montironi R.
                                                                                            Digital pathology and COVID‑19 and future crises: Pathologists can
      pathology cases, one random slide per case) represents a                              safely diagnose cases from home using a consumer monitor and a mini
      specific service stream (gynecologic and obstetrical pathology)                       PC. J Clin Pathol 2020;73:695‑6.
      at our institution and would require some extrapolation to other                 2.   Browning L, Fryer E, Roskell D, White K, Colling R, Rittscher J, et al.
                                                                                            Role of digital pathology in diagnostic histopathology in the response
      practice environments. There is a strong linear relationship                          to COVID‑19: Results from a survey of experience in a UK tertiary
      between scan time and file size [Table 3] on all platforms.                           referral hospital. J Clin Pathol 2021;74:129‑32.
      These operational benchmarks, however, vary systematically                       3.   Hanna MG, Reuter VE, Ardon O, Kim D, Sirintrapun SJ, Schüffler PJ,
      with specimen mix, including tissue type (anatomic source)                            et al. Validation of a digital pathology system including remote review
                                                                                            during the COVID‑19 pandemic. Mod Pathol 2020;33:2115‑27.
      and specimen (biopsy/resection) scale [Table 3]. Sampling                        4.   Henriksen J, Kolognizak T, Houghton T, Cherne S, Zhen D, Cimino PJ,
      practices, especially the average number of total blocks per                          et al. Rapid validation of telepathology by an academic neuropathology

       8                                                                                                                   Journal of Pathology Informatics
[Downloaded free from http://www.jpathinformatics.org on Sunday, January 9, 2022, IP: 243.195.204.225]
J Pathol Inform 2021, 1:13 http://www.jpathinformatics.org/content/13/1/8
practice during the COVID‑19 pandemic. Arch Pathol Lab Med Rajpoot NM, et al. Validation of digital pathology imaging
2020;144:1311‑20. for primary histopathological diagnosis. Histopathology
5. Stathonikos N, Nguyen TQ, van Diest PJ. Rocky road to digital 2016;68:1063‑72.
diagnostics: Implementation issues and exhilarating experiences. J Clin 12. Loughrey MB, Kelly PJ, Houghton OP, Coleman HG, Houghton JP,
Pathol 2021;74:415‑20. Carson A, et al. Digital slide viewing for primary reporting in
6. Stathonikos N, Nguyen TQ, Spoto CP, Verdaasdonk MA, van Diest PJ. gastrointestinal pathology: A validation study. Virchows Arch
Being fully digital: Perspective of a Dutch academic pathology 2015;467:137‑44.
laboratory. Histopathology 2019;75:621‑35. 13. Sağlam A, Usubütün A, Dolgun A, Mutter GL, Salman MC, Kurtulan O,
7. Chong T, Palma‑Diaz MF, Fisher C, Gui D, Ostrzega NL, Sempa G, et al. et al. Diagnostic and treatment reproducibility of cervical intraepithelial
The California telepathology service: UCLA’s experience in deploying neoplasia/squamous intraepithelial lesion and factors affecting the
a regional digital pathology subspecialty consultation network. J Pathol diagnosis. Turk Patoloji Derg 2017;1:177‑91.
Inform 2019;10:31. 14. Usubutun A, Mutter GL, Saglam A, Dolgun A, Ozkan EA, Ince T, et al.
8. Voelker HU, Stauch G, Strehl A, Azima Y, Mueller‑Hermelink HK. Reproducibility of endometrial intraepithelial neoplasia diagnosis is
Diagnostic validity of static telepathology supporting hospitals good, but influenced by the diagnostic style of pathologists. Mod Pathol
without local pathologists in low‑income countries. J Telemed Telecare 2012;25:877‑84.
2020;26:261‑70. 15. Carlson JW, Jarboe EA, Kindelberger D, Nucci MR, Hirsch MS,
9. Williams BJ, Hanby A, Millican‑Slater R, Nijhawan A, Verghese E, Crum CP. Serous tubal intraepithelial carcinoma: Diagnostic
Treanor D. Digital pathology for the primary diagnosis of breast reproducibility and its implications. Int J Gynecol Pathol 2010;29:310‑4.
histopathological specimens: An innovative validation and concordance 16. Duggan MA, Brashert P, Ostor A, Scurry J, Billson V, Kneafsey P, et al.
study on digital pathology validation and training. Histopathology The accuracy and interobserver reproducibility of endometrial dating.
2018;72:662‑71. Pathology 2001;33:292‑7.
10. Lee JJ, Jedrych J, Pantanowitz L, Ho J. Validation of digital pathology 17. Mills AM, Gradecki SE, Horton BJ, Blackwell R, Moskaluk CA,
for primary histopathological diagnosis of routine, inflammatory Mandell JW, et al. Diagnostic efficiency in digital pathology:
dermatopathology cases. Am J Dermatopathol 2018;40:17‑23. A comparison of optical versus digital assessment in 510 surgical
11. Snead DR, Tsang YW, Meskiri A, Kimani PK, Crossman R, pathology cases. Am J Surg Pathol 2018;42:53‑9.
Journal of Pathology Informatics 9[Downloaded free from http://www.jpathinformatics.org on Sunday, January 9, 2022, IP: 243.195.204.225]
Description of additional data files
Supplemental Data
Contents:
1. Scanner Settings
2. Average Block Numbers In Selected Cases, By Case Type
Supplement 1: Scanners and Profile Settings Used
Hamamatsu S210 scanner profile settings: Default and optimized
Category Setting S210 default S210 optimized
Scanner Multiple scan area Enable multiple scan areas Enable multiple scan areas
Z‑stack layers Single Single
Resolution 40× 40×
Scan profile Scan area Auto: 51 mm × 25 mm Auto: 51 mm × 25 mm
Focus 9 point auto 1 point auto
Dynamic focus Not available Not available
Threshold, auto tissue recognition 20‑95 20‑97.1
Cover glass filter Enabled Enabled
Minimum size 4.0 mm 0.0 mm
Split tissue Disabled Enabled, 4 mm
Focus pieces Each fragment Each fragment
Excluded area Include unfocused regions Include unfocused regions
Output File format ndpi (native) ndpi (native)
jpeg quality 80 80
Pyramid level ratio 2 2
Include macro image Yes Yes
jpeg subsampling None None
Write simultaneously Yes Yes
Leica GT450 Scanner Settings
• File format: SVS/JPEG‑Ycc 4 (native Aperio/Leica SVS)
• Magnification: 40x (native setting)
• Compression: JPEG2000 using libjpeg (quality = 91)[Downloaded free from http://www.jpathinformatics.org on Sunday, January 9, 2022, IP: 243.195.204.225]
Supplement 2: Average Block Numbers in Selected Cases, by Case Type
The 212 slides in the test slide set represented different tissue types and specimen sizes (Big/bx) as designated in Table 1. Each
of these was in turn randomly selected as one slide from a “case” that often contained more than one block. The Table below
shows the average number of paraffin blocks sampled in the full case from which the test slide was selected for scanning.
Mean number of blocks per case, by tissue type present
and specimen size
Tissue Specimen size
Big Bx
Bowel 68.000 ‑
Cervix 9.889 2.304
Endometrium ‑ 1.207
Fetus 7.333 ‑
Lymph node 22.250 ‑
Omentum 8.500 ‑
Ovary 15.091 ‑
Peritoneum ‑ 1.833
Placenta 4.810 ‑
Products of conception ‑ 3.111
Skin 13.000 ‑
Fallopian tube 9.667 ‑
Uterus 15.333 ‑
Vagina 29.000 1.000
Vulva 11.000 1.200
Big: Trimmed resection specimen, Bx: Small biopsy, or fragments
Mean number of blocks per case, by specimen size
Big Bx
9.040 1.768You can also read