Gravity-destabilized nonwetting phase invasion in macroheterogeneous porous media: Experimental observations of invasion dynamics and scale analysis
←
→
Page content transcription
If your browser does not render page correctly, please read the page content below
WATER RESOURCES RESEARCH, VOL. 36, NO. 11, PAGES 3121–3137, NOVEMBER 2000

Gravity-destabilized nonwetting phase invasion
in macroheterogeneous porous media: Experimental
observations of invasion dynamics and scale analysis
Robert J. Glass, Stephen H. Conrad, and William Peplinski
Flow Visualization and Processes Laboratory, Sandia National Laboratories, Albuquerque, New Mexico

Abstract. We designed and conducted experiments in a heterogeneous sand pack where
gravity-destabilized nonwetting phase invasion (CO2 and trichloroethylene) could be
recorded using high-resolution light transmission methods. The heterogeneity structure
was designed to be reminiscent of fluvial channel lag cut-and-fill architecture and to
contain a series of capillary barriers. As invasion progressed, nonwetting phase structure
developed a series of fingers and pools; behind the growing front we found nonwetting
phase saturation to pulsate in certain regions when viscous forces were low. Through a
scale analysis we derive a series of length scales that describe finger diameter, pool height
and width, and regions where pulsation occurs within a heterogeneous porous medium. In
all cases we find that the intrinsic pore-scale nature of the invasion process and resulting
structure must be incorporated into our analysis to explain experimental results. We
propose a simple macroscale structural growth model that assembles length scales for
substructures to delineate nonwetting phase migration from a source into a heterogeneous
domain. For such a model applied at the field scale for dense nonaqueous phase liquid
migration, we expect capillary and gravity forces within the complex subsurface lithology
to play the primary roles with viscous forces forming a perturbation on the inviscid phase
structure.

1.   Introduction                                                       at the Borden site [Kueper et al., 1993; Brewster et al., 1995]. Not
                                                                        surprisingly, all these studies have produced irregular spatial
   Spilled solvents have created pervasive groundwater con-             distributions of the nonwetting phase. Experimental and mod-
tamination problems because of their ubiquitous use, their              eling studies of DNAPL dissolution processes in heteroge-
toxicity and persistence in the environment, and the difficulty         neous systems [e.g., Anderson et al., 1992; Powers et al., 1998]
of recovering them from the subsurface. Because organic sol-            have shown that this irregular distribution of DNAPLs has
vents are more dense than water and immiscible with water,              significant impacts on the rate of dissolution. Of course, it also
they are commonly referred to as DNAPLs (dense nonaqueous               has implications for remedial strategies that attempt to im-
phase liquids). They migrate below the water table downward             prove pump and treat by enhancing dissolution, for example,
and laterally under the influence of gravity, capillary, and vis-       surfactants or cosolvents, or oxidizing the DNAPL in situ, for
cous forces. Because DNAPLs are generally the nonwetting                example, potassium permanganate.
fluid, variations in media texture that the DNAPLs encounter               The complicated pattern and dependence on small-scale
as they migrate can have a profound influence on the migration          detail places nonwetting invasion in a separate class from wet-
path. This capillary control induced by textural heterogeneities        ting invasion where combinations of film flow and multiple
complicates the migration of the DNAPLs and makes it diffi-             neck pore filling facilitation create macroscopic fronts [e.g.,
cult to predict the locations in the aquifer where the spilled          Lenormand and Zarcone, 1985; Blunt and Scher, 1995; Glass
DNAPLs may ultimately reside. Uncertainties in the region of            and Yarrington, 1996]. Modeling nonwetting displacements
solvent contamination translate into higher remediation costs           with current two-phase continuum-scale porous media ap-
because the remedial system must be designed in light of these          proaches that integrate over a large number of pores in an
uncertainties.                                                          effort to define effective behavior at a representative elemen-
   Several experiments have shown the importance of hetero-             tary volume (REV) scale must be considered as questionable
geneous texture in affecting the migration of DNAPLs in two-            for many situations. Alternative modeling approaches that bet-
phase systems in laboratory sand packs [Kueper et al., 1989;            ter embody the underlying physics make use of modified forms
Illangasekare et al., 1995, 1996] and in micromodels [Conrad et         of invasion percolation (MIP). While forms of MIP have been
al., 1989; Wilson et al., 1990]. Similarly, two-dimensional (2-D),      applied in the past to yield phenomenological understanding in
heterogeneous, glass bead pack experiments have been per-
                                                                        small random pore networks, our desire is to develop such
formed for the upward migration of a gas [Ji et al., 1993], also
                                                                        models to be predictive of system behavior at much larger
the nonwetting fluid. Additionally, two field experiments of
                                                                        scales [e.g., Kueper and McWhorter, 1992; Glass et al., 1995;
DNAPL migration below the water table have been conducted
                                                                        Ioannidis et al., 1996; Ewing and Berkowitz, 1998]. While still in
This paper is not subject to U.S. copyright. Published in 2000 by the   their infancy, such approaches show great promise. In order to
American Geophysical Union.                                             develop these models as well as to test current porous contin-
Paper number 2000WR900152.                                              uum approaches, experiments are required that capture inva-

                                                                    3121
3122                      GLASS ET AL.: GRAVITY-DESTABILIZED NONWETTING PHASE INVASION

sion dynamics within large heterogeneous pore networks under         thick) that ran down the long edges of the glass. The internal
the combined influence of capillary, gravity, and viscous forces.    dimensions of the chamber were 1 cm thick (⬃10 – 40 pores/
   In this paper we present and analyze three experiments            grains) by 26 cm wide by 60 cm tall. O rings embedded in the
designed to quantitatively visualize the evolving invasion struc-    edge spacers provided a seal with forces applied by an external
ture during gravity-destabilized, nonwetting phase invasion          clamp that ran the length of the chamber sides. At the top and
within macroheterogeneous porous media. We built our media           bottom a screened manifold and a porous plate, respectively,
to create a series of capillary barriers and evoke lithology         were sealed to the chamber allowing for the inflow and outflow
reminiscent of fluvial channel lag cut-and-fill architecture         of water. Steel bars were clamped to the outside of the glass
within translucent sands. Using light transmission techniques,       plates at the top and bottom to minimize chamber bowing
we collected invasion data rapidly at near pore-scale resolu-        under the pressures created by filling the chamber with sand
tion. These data allow us to track the invasion front with           and fluids. A port for injecting the nonwetting phase was lat-
exceptional clarity and analyze the unsteady dynamics of the         erally centered in the front glass plate, within 3 cm of one edge.
phase invasion process both during initial invasion and upon
redistribution. Our experiments demonstrate a characteristic         2.2.   Sand Packing
alternation between gravity-stabilized and gravity-destabilized         The chamber was filled using a sand filler designed to create
invasion growth controlled by the sequential capillary barriers      reproducible “facies-like” geometric structures. A computer-
within the heterogeneous field. Under gravity-destabilized           controlled positioner was mounted on a platform, which could
growth periods, pore-scale fingering is organized away from          be raised and lowered manually. Attached to the positioner
the source, while under gravity-stabilized periods, invasion co-     was a sand hopper, funnel, tube, and vibration source that
alesces into macroscopic horizontal fronts that grow backward,       delivered sand to the chamber at specified locations. Horizon-
overwriting the original finger structure. Behind the invasion       tal position, the falling distance from the end of the delivery
front we find rich dynamics with multiple cycle pulsation be-        tube to the sand already in the chamber, and the mass of the
fore, within, and beyond capillary barriers and along the path       particular sand delivered were controlled. Features intended
of fingers, yielding highly nonmonotonic saturation behavior in      as analogues to channel cut-and-fill facies were created by
time and space.                                                      keeping the positioner stationary while sand was being added
   Through a scale analysis using local force balances, we de-       to the chamber. Continuous layers were created by program-
rive a series of length scales that control invasion structure and   ming the positioner to travel back and forth across the cham-
dynamics such as finger diameter, the height of pools above          ber while delivering sand at a uniform rate.
capillary barriers, and the location of zones of nonwetting fluid       The heterogeneity structure, shown in Figure 1, was de-
pulsation. In all cases we find that the intrinsic pore-scale        signed to represent a qualitatively realistic sequence of three
nature of the invasion process and resulting structure must be       lithologic units of different texture. Three commercially avail-
incorporated into our analysis to explain experimental results.      able, translucent, hydrophilic silica sands with narrow, non-
Analysis also demonstrates that while global viscous forces are      overlapping grain size distributions were chosen to compose
small, the pore-scale nature of capillary barrier breaching and      the three units (Accusand 12–20, a coarse sand; 30 – 40, a
fingering can cause them to be locally significant and of the        medium sand; and 50 –70, a fine sand) (see Table 1). We
order of capillary and gravity forces. Such results suggest sig-     created unit shapes reminiscent of those seen in channel cut-
nificant difficulties in the application of standard porous con-     and-fill deposits but with vertical exaggeration. Fine sand em-
tinuum approaches. We propose an alternative modeling ap-            placed along the edges of the chamber removed possible pref-
proach that assembles these length scales within the context of      erential flow of the nonwetting phase along the chamber
a macroscale “structural” growth model akin to upscaled MIP.         boundaries.
Such a model yields directly the nonwetting phase migration             We also packed an additional chamber where we maintained
pathway evolution, its geometry of fingers and pools, and the        the continuity of the thin layer of fine sand stretching across
locations of zones of pulsation within complex subsurface lith-      the chamber about two thirds of the way toward the outlet
ologic heterogeneity. Inadequacies of continuum-scale models         from the injection port (see Figure 1). We refer to this pack as
can thus be avoided, and the structural growth model can be          the secondary heterostructure, while the other we refer to as
combined easily with high-resolution Monte Carlo simulation          the primary heterostructure. We used this small, yet critical,
of the controlling subsurface geology to yield probabilistic pre-    difference between the primary and secondary heterostruc-
diction of subsurface DNAPL contamination.                           tures to demonstrate the sensitivity of TCE migration behavior
                                                                     to the lateral continuity in capillary barriers.
2.     Experimental Design                                              In each of the experiments the chamber was oriented so that
   We designed experiments within a thin but extensive sand          the invading nonwetting phase was introduced in a density-
chamber where we could use quantitative light transmission           unstable manner. That is, TCE (more dense than water) was
techniques to record invasion dynamics in time. A reproduc-          introduced from the top, while CO2 (less dense than water)
ible heterogeneity structure was placed within the chamber,          was introduced from the bottom. For the sake of comparison,
and three constant-flux, gravity-destabilized, nonwetting phase      both nonwetting fluids advanced in the same direction through
invasion experiments were conducted where we varied the              the heterogeneous structure. That is, TCE advanced down-
interfacial tension, density difference, and viscosity using two     ward through the structure just as shown in Figure 1, while
fluid-fluid systems: CO2-water and trichloroethylene (TCE)-          CO2 advanced upward, with the structure oriented upside-
water.                                                               down to that shown in Figure 1.
                                                                        After filling and orienting the chamber, we settled the sand
2.1.   Chamber Construction                                          with capillary forces and localized vibration. Beginning with an
  The chamber was constructed of two plates of hydrophilic           air-dried sand-filled chamber, we displaced air with CO2
glass (1.25 cm thick) held apart by two aluminum spacers (1 cm       through the bottom manifold. Gas flooding was followed by
GLASS ET AL.: GRAVITY-DESTABILIZED NONWETTING PHASE INVASION                                           3123

         Figure 1. Digital images of the heterogeneous sand packs used in the invasion experiments. In these images
         the coarse sand transmits the most light and hence is the lightest; the medium sand appears gray; and the fine
         sand appears dark. The injection port and four major capillary barriers (labeled CB1 through CB4) are
         identified for the primary heterogeneous structure. These capillary barriers occur where medium sand
         separates coarse facies from one another. These same features can be found on the secondary heterogeneous
         structure as well. The difference between the (a) primary and (b) secondary structures can be seen in the
         fine-sand layer extending across the column about two thirds of the way from the top. In the primary structure
         this layer is discontinuous, while in the secondary structure this layer is continuous and forms one additional
         capillary barrier. The primary structure was used for experiments 1 and 2, and the secondary structure was
         used for experiment 3. Notice that small variations in facies location and shape exist between the two sand
         packings. These small differences had negligible effect on the behavior of the migrating fluids.

gravity-stabilized and viscous-stabilized flooding with de-           screwdriver handle) to enhance further settling with localized
gassed, deionized water until the chamber was saturated. We           vibration. This CO2-water-drainage-drying-tapping cycle was
then drained the chamber through the bottom porous plate              repeated several times causing the heterogeneous packed sand
under suction, air entering from above. We continued pulling          structure to settle. Digital images of transmitted light through
filtered dry air through the chamber and porous plate using a         the chamber showed that the vast majority of the settling was
vacuum pump until the sand in the chamber was dry. The front          achieved after two cycles.
of the chamber was then tapped with a hard plastic cylinder (a           Close comparison of the settled primary and secondary het-
                                                                      erostructures shows small variations in shape and lens inter-
                                                                      face orientation between the two packs. Additionally, because
Table 1. Sand Properties                                              the chamber was disassembled between experiments for clean-
                                                                      ing, reassembly slightly changed the distance between the two
                       Grain Size Mean,                 Intrinsic
                          Maximum,                    Permeability,
                                                                      glass plates thus causing the entire heterostructure to “scale”
 Sand     Sieve Size    Minimum mm         Porosity       cm2         slightly in the vertical direction.

Coarse      12–20        1.1, 1.7, 0.84      34.8      6.32E-06a      2.3.   Material Properties
Medium      30–40       0.05, 0.60, 0.42     35.4      1.20E-06         Pressure-saturation curves for each of the three sands were
Fine        50–70       0.26, 0.30, 0.21     36.2      2.97E-07
                                                                      measured within the chamber for the air-water fluid system
  a
   Read 6.32E-06 as 6.32 ⫻ 10⫺6, for example.                         using the light transmission method. The chamber was filled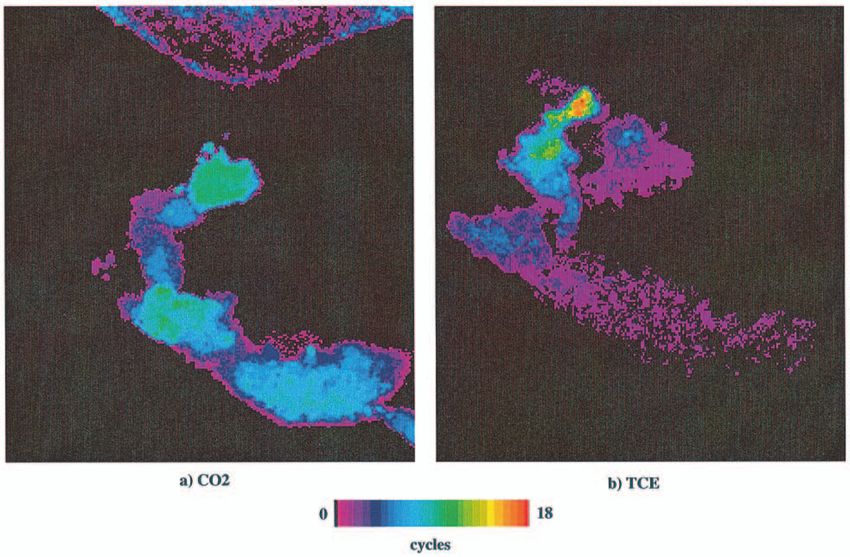
3124                      GLASS ET AL.: GRAVITY-DESTABILIZED NONWETTING PHASE INVASION

                                                                    Table 3. Experiments Conducted
                                                                                                           System
                                                                    Fluid/Fluid Heterogeneous           Breakthrough, Redistribution
                                                                      System      Structure   Q, mL/min      mL         End, min

                                                                    CO2/H2O       primary        1.2          50.8         NAa
                                                                    TCE/H2O       primary        0.9          73.1         303
                                                                    TCE/H2O       secondary      1.0         158           240
                                                                      a
                                                                       NA is not applicable.

                                                                    water-saturated primary heterostructure. After conclusion of
                                                                    the experiment the CO2 was dissolved away with deaired water,
                                                                    and the chamber was inverted. We then performed our second
                                                                    experiment by injecting TCE from the top. After emptying,
                                                                    cleaning, and repacking the chamber with the secondary het-
                                                                    erostructure, we then conducted our final experiment with
Figure 2. Hysteretic pressure-saturation curves (air-water)         TCE injected from the top. Each invasion experiment started
for the three sands used within the heterogeneous sand packs.       from the fully water-saturated state verified with the light
The experimental chamber was packed uniformly with each of          transmission method. Outflow occurred from the side opposite
the three sands, and the light transmission method was used to      injection and was connected to a tube directing the water to a
measure equilibrium saturation profiles to yield the primary        reservoir on a scale with a drip point 1.5 cm above the top of
drainage curve (fully water-saturated initial condition) and the    the chamber. Prior to starting the CO2 invasion experiment, we
main wetting curve (residual nonwetting air-phase initial con-      displaced the degassed, deionized water in the chamber with
dition). The main wetting curve for the fine sand was not           CO2-saturated water. This minimized the dissolution of the
measured.                                                           free-phase CO2 into the pore water as CO2 invasion pro-
                                                                    gressed.
                                                                       An 18-gage needle (0.84 mm ID) was used to inject the
with a single sand type following the homogeneous filling
                                                                    nonwetting fluid into the coarse sand. For the TCE experi-
method of Glass et al. [1989b]. A sequence of filling and drain-
                                                                    ments, liquid was injected using a syringe pump, while for the
age experiments to equilibrium points yielded primary wetting
                                                                    CO2 experiment, gas was delivered to the chamber from a
and drainage curves for the media [e.g., Norton, 1995] (see
                                                                    pressure bottle through a metering valve and flow meter. In-
Figure 2). Porosity and saturated permeability were also mea-
                                                                    jection rates were designed to be ⬃1 mL/min for all experi-
sured during this characterization sequence and are presented
                                                                    ments (see Table 3) so that average viscous forces would be
in Table 1.
                                                                    small. The mass of water leaving the chamber was measured
   Fluid properties are given in Table 2. Interfacial tension
                                                                    every 30 s with a computer-monitored electronic balance to
(IFT) measurements were made using a Fisher Model 20 sur-
                                                                    yield the displaced volume as a function of time. For the
face tensiometer following the manufacturer modified ASTM
                                                                    TCE-water experiments, Oil-Red-O dye (0.9 g/L) was added to
D 971-91 method [American Society for Testing and Materials,
                                                                    the TCE to enhance visibility. For the CO2-water experiments,
1991]. Fluids were equilibrated for 2 min before IFT was mea-
                                                                    changes in fluid saturation were easily measurable without dyes
sured. Fluid viscosity for the TCE was measured using a Can-
                                                                    because of the very different refractive indices between gas and
non-Fenske viscometer following procedures recommended by
                                                                    water. Fluid injection was terminated when the leading edge of
the manufacturer. TCE density was measured with a pycnom-
                                                                    the nonwetting phase had reached the far side of the chamber.
eter. Because we added Oil-Red-O dye (0.9 g/L) (Fisher Sci-
                                                                    Redistribution of the nonwetting phase was monitored for the
entific, Pittsburgh, Pennsylvania) to the TCE in our experi-
                                                                    TCE experiments over a several day period.
ments, we measured the properties of the dyed liquid. The
presence of dye was found to decrease interfacial tension of        2.5.   Image Collection and Processing
the TCE.
                                                                       The experimental chamber was placed between a controlled
2.4.    Invasion Experiments                                        output diffuse light source and a digital camera that measures
                                                                    the intensity of light transmitted through the chamber as a
  We conducted three invasion experiments (see Table 3). In
                                                                    function of space and time. Digital images were acquired at a
our first experiment we injected CO2 from the bottom into the
                                                                    rate of one image every 20 s (or ⬃1 image per 0.33 mL of
                                                                    injected fluid) with a 12-bit shuttered digital camera (1317 ⫻
Table 2. Fluid Properties                                           1035 pixels and 4096 gray levels) using a 60-mm lens and
                                                                    ⬃0.1-s exposure time to record intensity fields from a distance
                                   Interfacial                      of 4.3 m within a dark room. Camera resolution was ⬃0.5 mm
               Density,             Tension,                        per pixel (0.25 mm2/pixel).
Fluid           g/mL                 dyn/cm       Viscosity Poise
                                                                       We processed digital images to yield saturation fields as a
CO2             0.002a
                                       71           1.48E-02a       function of space and time and then used these images to
H2O             0.996a                NAb           1.00E-02a       create “composite” fields that summarize (1) the movement of
TCE             1.464                  27           5.75E-03        the nonwetting invasion front in time and (2) cyclic temporal
  a
   Values are from Weast [1985].                                    variations in saturation behind the front. Preliminary to this,
  b
   NA is not applicable.                                            images were first preprocessed to adjust the intensity field for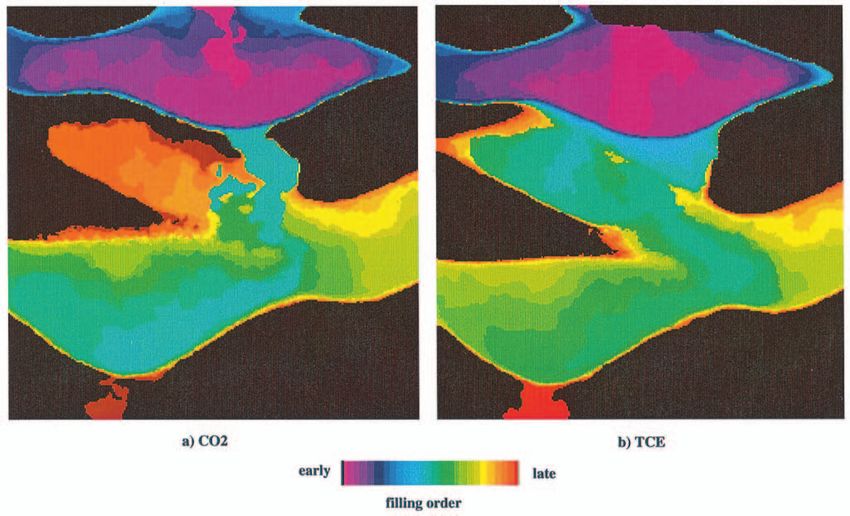
GLASS ET AL.: GRAVITY-DESTABILIZED NONWETTING PHASE INVASION                                           3125

small fluctuations of the light source using a photographic          pulsation is less than our 20-s acquisition interval between
constant-density stepped wedge (included in every image) and         images.
to realign the image for occasional small shifts between the
camera and the test cell (tolerance of 0.05 pixels).
   Saturation fields were calculated using modifications of tech-    3.   General Invasion Results
niques presented by Tidwell and Glass [1994] for both refrac-           Use of the light transmission technique allows us to observe,
tion-dominated and absorption-dominated energy transmis-             record, and analyze the invasion process with unprecedented
sion within homogeneous media. For the CO 2 -water                   clarity. In this section we present general invasion results
experiments where light passage is dominated by refraction, we       through a series of images that show (1) nonwetting phase
used their theoretical development to calculate pointwise the        structure at the conclusion of fluid injection, (2) development
number of pores (their k) from the saturated and dry images          of this structure in time, (3) phase saturation nonmontonicity
and then used this “k field” to calculate the transient satura-      as this structure evolves, and (4) subsequent redistribution of
tion fields. For the TCE-water systems where the refractive          the nonwetting phase. Note that all images are oriented such
index of the fluids is nearly the same, saturation was calculated    that flow is in the same direction to facilitate comparison. That
using energy absorption by the Oil-Red-O dye analogous to            is, the CO2 invasion is rotated 180⬚ with gravity now acting
their X-ray transmission. However, because a fully saturated         upward in the image.
Oil-Red-O dye image was not obtained, we substituted the                Plate 1 shows saturation structures when the CO2 or TCE
low-intensity dry image and scaled it to yield saturation values     had just spanned the system and injection was terminated. We
within pools of the coarse sand near the expected value of 0.83      see that the nonwetting fluid is confined mainly to the coarse
(see Figure 2). This approach, while approximate for sands           units and is composed of a number of “pools” behind capillary
other than the coarse, maintained excellent spatial definition       barriers (CBs) and “fingers” that penetrate CBs and connect
of the saturation field. Other inaccuracies were also noted in       the pools together along a pathway. The continuity of the fine
the experiments. Inspection of the saturation fields showed          unit in the secondary heterostructure (Plate 1c) creates a sig-
highly variable saturation when the nonwetting phase did not         nificant TCE pool ⬃2 times deeper than found in the primary
fully span the thickness of the sand, that is, when the saturation   heterostructure. Saturation within the coarse unit pools is near
                                                                     uniform and at the nonwetting satiated value is consistent with
is not uniform from the front wall to the back wall of the
                                                                     our calibration. The local scatter of light blurs the saturation
chamber. Additionally, where high nonwetting phase satura-
                                                                     field around sharp transitions at the edges of pools and thus
tion regions were next to completely water-saturated regions,
                                                                     shows artificial nonzero nonwetting saturations in the sur-
the scatter of light caused blurring of the sharp transition. To
                                                                     rounding capillary barriers. Overestimation of the saturation is
estimate the gross error associated with our saturation fields,
                                                                     particularly noticeable in the fine CB (broken in the primary
we compared volumes of injected nonwetting phase as calcu-
                                                                     heterostructure) as it is both thin and has nonwetting fluid on
lated from saturation fields against the known injected vol-
                                                                     its top and bottom. Also, note in the secondary heterostructure
umes. Total nonwetting volume error was a maximum of 12%
                                                                     that maximum saturations within the medium sand in the pool
across the three experiments. While these gross errors can be
                                                                     above the fine CB are underestimated because of our lack of a
reduced through additional calibration, error within the field
                                                                     fully TCE-saturated image for saturation calculations.
where the nonwetting phase does not fully span the thickness
                                                                        The saturation within fingers is much more variable than
of the pack and where high- and low-saturation regions are           within pools. This is further shown in magnified and contrast-
juxtaposed will remain. However, for the tracking of the inva-       enhanced images of the final saturation structures at and be-
sion front and subsequent analysis of saturation dynamics, sat-      yond CB4 for CO2 and TCE in the primary heterostructure
uration errors are of secondary importance.                          (Figure 3). The highly variable appearance of the saturation
   To track the progression of the advance of the nonwetting         along a finger demonstrates that the fingers are not smooth
phase, we used the individual saturation images taken over           macroscopic features. We see that the appearance of fingers in
time to create a composite order image that shows the advance        the coarse unit as a series of near disconnected regions of high
of the invasion front. This order of invasion image is built by      saturation is due to the “pore-scale” nature of the fingers
tracking the first nonwetting saturation increase above system       amplified by the imaging technique. The finger is composed of
noise at each point within the field. In building a composite        a string of nonwetting clusters connected by single pores and
order image, some pore-scale detail is lost as we ignore the         thus does not uniformly fill the pore network between the front
degree of saturation. However, using this method, we are able        and the back of the chamber. This structure corresponds
to define the extent of the invading phase with excellent pre-       closely to the link/node/blob picture of a percolating backbone
cision as a function of time throughout an entire experiment in      [e.g., Stanley, 1977] except that it is directionally oriented by
a single image.                                                      gravity. When the finger is in pores near or at the front of the
   To analyze the local monotonicity of saturation in time           chamber, we see it as a discrete, connected pore structure. As
within the field, we compared sequential saturation images and       the finger meanders farther behind the chamber front, it be-
counted the number of cycles from increasing to decreasing           comes increasingly blurred by the scatter of light. As seen in
saturation above system noise at each pixel in time. A cycle         Plate 1 and Figure 3, the CO2 invasion shows a more “slender”
image shows locations where saturations increase and de-             pathway with pools of lower height and narrower connecting
crease. Values in the cycle images of 1 and above indicated that     fingers than that for the TCE invasions. Additionally, detailed
a location behaved nonmonotonically as the experiment pro-           evaluation at high magnification shows that all CBs were
gressed. We note that while cycle images give an indication of       breached by a single finger for the CO2 invasion, while multiple
internal dynamics behind the initial invasion front, they weight     fingers extend through each CB for both TCE invasions.
early invasion regions higher than later invasion regions. Ad-          Composite order images showing the invasion sequence for
ditionally, they will not catch all cycles if the period of the      each experiment are presented in Plate 2. As discussed earlier,
3126 GLASS ET AL.: GRAVITY-DESTABILIZED NONWETTING PHASE INVASION
Plate 1. Nonwetting saturation fields at the time the invading nonwetting phase spanned the length of the
chamber just before fluid injection was terminated: (a) CO2 in the primary heterostructure, (b) tetrachloro-
ethylene (TCE) in the primary heterostructure, and (c) TCE in the secondary heterostructure. Color indicates
the local nonwetting phase saturation. Note that the local scatter of light blurs the saturation field around
sharp transitions at the edges of pools and within finger zones. Also note that maximum saturations within the
medium sand in Plate 1c are underestimated.
the fundamental pore-scale behavior is less obvious in these texture are encountered (i.e., lower entry pressures than the
images as we simply track increases in nonwetting saturation primary CB), they are entered if the appropriate pressure is
above zero. The order images clearly demonstrate the hetero- exceeded. This behavior is particularly well demonstrated in
geneity structure to impose an oscillation between modes of the secondary heterostructure TCE invasion where the conti-
gravity-destabilized and gravity-stabilized invasion. Near verti- nuity of the fine-textured CB was maintained. Refer to the
cal fingers grow away from the source during the gravity- green and yellow regions in the composite order image (Plate
destabilized invasion mode, while flat horizontal fronts grow 2c) while also looking back to the heterostructure image (Fig-
back toward the source during the gravity-stabilized mode. ure 1b). Notice that medium units and coarse-textured units
This dynamic is clearer at higher resolution as shown in Plate were being filled concurrently, the medium units at lower ele-
3 composed of magnified and recolored zones of the order vations than the coarse units.
images containing CB1 and CB2. As nonwetting phase pressure builds behind a CB, entry of
In general, the gravity-destabilized finger growth mode oc- the barrier begins at a series of points along the interface from
curs in all units until a CB is encountered. Once encountered, which small fingers grow. When one or more of these fingers
CBs then cause gravity-stabilized pool growth behind the CB reach the far side of the barrier, the barrier is breached, and
until they are breached. During this mode the earlier gravity- the fingers continue growing into the underlying layer. For the
driven fingering is partially or in some cases completely “over- CO2 invasion, only the leading finger that is first to enter the
written” by the backward growing horizontal front. As the coarser layer ever continues growth. However, for both TCE
stabilized growth period progresses, if units of intermediate invasions several of the lagging fingers always make contactGLASS ET AL.: GRAVITY-DESTABILIZED NONWETTING PHASE INVASION 3127
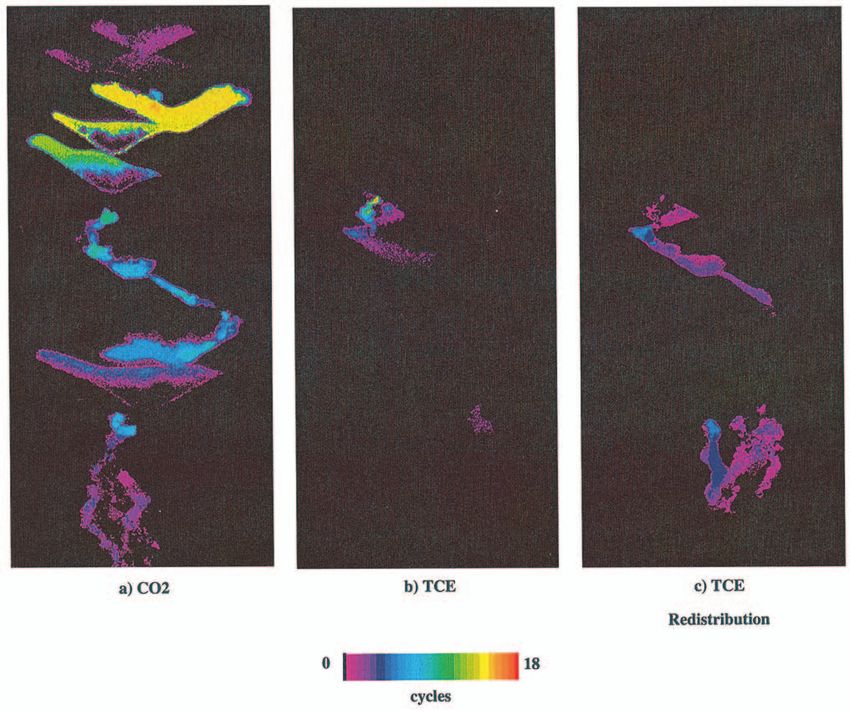
Figure 3. Magnification of nonwetting saturation structure at and beneath CB4 in the primary heterostruc-
ture: (a) CO2, and (b) TCE. Saturation fields have been contrast enhanced to bring out the underlying
pore-scale nature of the fingers as a string of clusters connected by single pores. Note that the two stalled
fingers within CB4 marked for CO2 continued growing for TCE and spanned the capillary barrier. Boxes
shown are representative finger widths of 0.6 – 0.7 and 1.2–1.3 cm for CO2 and TCE, respectively.
with the underlying coarser layer and generate separate fingers sation, individual pores and clusters of pores are seen to “drip”
beyond. For TCE invasion the pool height behind the capillary in time. Such pulsation can be seen within one CB (e.g., CB1
barrier continues to rise during this period and stops after the in CO2 injection) and within the coarse unit directly below CBs
final finger spans the capillary barrier. However, for CO2, pool and along fingers. In pool scale pulsation, entire pools “throb”
height stops increasing as soon as the first finger spans the in time. High cycle values are found both in the large region at
barrier. Close study of Figure 3 shows that the initial growth the top of the pool and along the edges of the pool where pores
points in the primary heterostructure are identical for both the repeatedly fill with wetting and nonwetting phases in concert.
CO2 and TCE experiments; however, for TCE all three fingers This larger-scale throbbing is seen within the pools behind all
continued to grow. CBs in the CO2 invasion but is not detected within the TCE
Animation of sequential saturation images for all experi- invasion structure. A glimpse at the temporal complexity of
ments clearly shows that the nonwetting phase saturation does pulsation within our experiments is shown in Figure 4 where
not increase monotonically in time at all locations along the nonwetting fluid saturation is plotted as a function of time for
invasion pathway. The spatial structure of this nonmonotonic- a series of small ⬃25-pixel regions located along the CO2
ity up to the conclusion of injection is shown in Plates 4a and invasion structure. We see that while the traces may look
4b for the TCE and CO2 invasions in the primary heterostruc- generally periodic, they are not. At each location both the
ture. Color represents the number of increase-decrease cycles magnitude of the saturation swing and the local period are
that occurred as invasion proceeded. For the CO2 experiment different from one pulse to the next, the small “hot spots”
we see pulsation through nearly the entire gas invasion struc- within and below capillary barriers showing a more erratic
ture. Maximum cycles reached 18 within a small region beyond pulsation than the pools.
the breach of CB1. For TCE invasion in the same pack we find When the invading fluid reached the distal end of the cham-
pulsation concentrated directly beyond CB3 where it reached ber, nonwetting injection was terminated, and the redistribu-
values of 15. A second region within the fingering zone below tion phase of the experiment began. For the CO2 invasion,
CB4 has undergone a single cycle by the time of system break- negligible redistribution occurred. However, for the TCE, re-
through. Pulsation in the secondary heterostructure TCE in- distribution lasted several hours (see Table 3). A fine layer at
vasion (not shown) was similar but more subdued reaching a the bottom of the chamber kept the TCE within the chamber,
maximum value beyond CB3 of 4. Again, we note that cycle so simultaneous drainage and invasion could be visualized.
counts could have been higher than we measured as our ac- Figure 5 shows the difference between the beginning and end
quisition interval was only 20 s. of the redistribution stage for the TCE invasions into the
Close examination of animations and magnifications of the primary and secondary heterostructures; dark zones indicate
cycle images (see Plate 5) show pulsation to occur at two where TCE has drained, bright zones indicate where it has
different scales: pore scale and pool scale. In pore scale pul- moved, and shaded zones indicate where no change occurs.3128 GLASS ET AL.: GRAVITY-DESTABILIZED NONWETTING PHASE INVASION
Plate 2. Composite order images of nonwetting invasion: (a) CO2 in the primary heterostructure; (b) TCE
in the primary heterostructure; and (c) TCE in the secondary heterostructure. Color indicates the order of
filling. In Plate 2c initial data were lost resulting in the black region at early times at the top of the chamber.
More fluid redistributed for the secondary heterostructure occur as macroscale zones of high saturation. The vast majority
than the primary structure as can be seen by the depth of of the nonwetting phase mass is held in the pools.
pooled TCE at the bottom of the cell. Visual inspection of the (2) Gravity-driven fingers always occur as invasion pro-
drained zones of pools and fingers within the coarse unit show ceeds away from the source. Gravity-stabilized invasion can
the TCE to be entirely trapped in a series of blobs/ganglia at a overwrite the fingers when a CB is encountered and a pool-
residual saturation of ⬃0.2– 0.3. Still, a majority of the mass is forming horizontal front grows backward toward the source.
held in the pools at high saturations of ⬃0.8 – 0.9. During (3) Pulsation occurs within fingers and within pools at dif-
redistribution we also find significant pulsation to occur, much ferent scales of expression for each. Pulsation was most per-
greater than during the initial invasion. Plate 4c shows a cycle vasive for CO2, and in the TCE experiments; pulsation in-
image built over the redistribution period for the primary het- creased as redistribution commenced.
eroexperiment. Pulsation is found as TCE moves through the (4) Redistribution after termination of injection occurred
coarse run between CB3 and CB4 and beyond CB4 as we saw for TCE but not for CO2. As we will show in section 4, this
in the CO2 experiment. An additional finger below CB4 also difference results from the importance of viscous forces at the
formed and pulsated below CB4, the main pulsation point just flow rates imposed to increase TCE pool heights during inva-
overlapping that for the CO2 experiment beyond this barrier. sion over their equilibrium or final static levels.
In summary, we see the following: In section 4 we focus on defining a suite of length scales that
(1) CBs create a pool and finger invasion structure. Pore- describe the evolving and dynamic invasion structure gener-
scale fingers occur as interconnected clusters of nonwetting ated by the nonwetting phase within a heterogeneous porous
phase resulting in highly variable macroscale saturation. Pools medium.GLASS ET AL.: GRAVITY-DESTABILIZED NONWETTING PHASE INVASION 3129
Plate 3. Magnification of the composite order images of nonwetting invasion in the vicinity of CB1 and CB2
in the primary heterostructure: (a) CO2 and (b) TCE. Color indicates the order of filling.
4. Length Scales for Invasion Structure Ratios of the ⌬P i yield dimensionless numbers such as the
and Dynamics bond number (gravity/capillary) or the capillary number (vis-
cous/capillary) which can be used to define the regime in which
Invasion structure and dynamics within the granular pack
our experiments lie. For a heterogeneous system such as ours,
can be analyzed by considering local differential pressures
these numbers will vary as a function of time and space and
within the invading phase ⌬P i , associated with capillary, grav-
thus are less defining than in homogeneous media.
itational, and viscous forces (subscripts c, g, and v, respec-
Here we use simple local-scale analyses that balance the
tively) written as
local pressure differentials, that is,
⌬P c ⬃ 2 冉 1
⫺
1
R min R max 冊 (1)
⌬P c ⫹ ⌬P g ⫹ ⌬P v ⫽ 0,
to derive approximate relations for a set of local macroscopic
(2)
⌬P g ⬃ ⌬ gh g ⌬P v ⬃ Q h v/kA, length scales that control phase invasion structure and dynam-
ics within the heterogeneous system. The sign of each ⌬P i in
where is the interfacial tension, ⌬ is the density differential
(2) depends on its action with respect to the situation of inter-
(positive) between fluids, g is the gravitational constant, h g is
est. We consider length scales for finger diameter, finger pul-
a local macroscopic vertical distance, Q is the flow rate, is the
sation, maximum pool height, pool pulsation, and minimum
viscosity of the invading fluid, h v is a local macroscopic length
pool height and evaluate derived formulations with respect to
in the direction of invasion, k is the permeability, and A is the
experimental observations. In all cases we find that the intrinsic
local cross-sectional area of the invading fluid-filled porous
pore-scale nature of the invasion process and resulting struc-
media. Note that k applies to the structure being considered,
ture must be incorporated into our analysis to explain experi-
that is, a string of pores within a finger or a “matrix” of pores
mental results. In this our analysis departs from standard scale
within a pool and will be approximated by the intrinsic perme-
analysis for continuum scale flow in porous media where as-
ability of the media within A. R min and R max represent radii of
sumed governing equations (usually partial differential equa-
curvature for the pore-scale fluid-fluid interface typical of the
tions for conservation of mass, momentum, and energy) are
minimum and maximum, respectively, encountered locally
used to develop such relations [e.g., Began, 1985]. Given the
such as to consider variability in capillary forces within a unit,
pore-scale control within our problem, such macroscopic con-
between units, or between wetting and nonwetting entry, de-
tinuum approaches applied at a typical REV scale to the po-
pending on the situation of interest. As written, ⌬P i are all
rous medium are not fully applicable.
positive quantities.
Considering fluid properties alone (see Table 2), we see that 4.1. Finger Diameter
CO2 has slightly larger ⌬P c and ⌬P g than TCE (within a factor As described in section 3, fingers are composed of a series of
of 2–3), while TCE has significantly larger ⌬P v (factor of 39). clusters connected or “strung” together by single pores yielding3130 GLASS ET AL.: GRAVITY-DESTABILIZED NONWETTING PHASE INVASION
Plate 4. Fluctuation cycle images for saturation of the nonwetting phase in the primary heterostructure: (a)
CO2 during invasion; (b) TCE during invasion; and (c) TCE during redistribution. Color indicates the number
of cycles of saturation increase then decrease.
a highly variable finger diameter (see Figure 3 and Plate 3). drives directional finger growth. At the scale of the finger
These clusters form because of the random nature of the cap- diameter d we take h g ⫽ h v ⫽ d and find
illary pressure required to fill individual pores within the net-
work. Additionally, we observe that a finger grows through a
series of “bursts” where a small capillary finger moves forward
d⬃
⌬g ⫺
2
Q 冋 1
⫺
1
册
R nw min R nw max
, (3)
rapidly across a single pore at or near the fingertip and then kf Af
stops, followed by local “backfilling” to create a wider cluster.
Therefore we conclude that capillary pressure oscillates be- where R nw min and R nw max are the average minimum and
tween a low value somewhere within the backfilling cluster maximum radii, respectively, sampled during finger growth and
(R max) and a high value just before the next burst occurs as the subscript f refers to the finger. Here we consider A f to be
single “critical” pore is entered (R min). Observationally, we independent of d as d is controlled by the average cluster size
can also conclude that owing to the “stringed cluster” nature of along its length, while A f is restricted to the conductive back-
the finger, viscous forces acting against flow along the finger bone within the finger. R nw min is a function of the pore size
are controlled primarily within a single to several pore cross- distribution and its connectivity within the sand thus yielding a
sectional area composing the primary conductive backbone of dependence of d on pore size distribution such as found in the
the nonwetting finger. Along the backbone we consider k to be analysis of Glass and Yarrington [1996]. Additionally, R nw min
approximately the intrinsic permeability of the granular media. will be dependent on gravity and viscous forces active in the
To yield an approximate macroscopic length scale for finger media, gravity forces increasing and viscous forces decreasing
diameter, we consider a local balance of ⌬P c that creates the R nw min sampled. We note that (3) has a similar form to that of
clusters we associate with the diameter to ⌬P g ⫺ ⌬P v that Glass et al. [1989a, 1989b], derived through a combination ofGLASS ET AL.: GRAVITY-DESTABILIZED NONWETTING PHASE INVASION 3131
Plate 5. Magnification of fluctuation cycle images in the vicinity of CB3 for the primary heterostructure: (a)
CO2 and (b) TCE. Color indicates the number of cycles of saturation increase then decrease.
dimensional analysis and experimentation for gravity-driven finger-widening capillary forces. Additionally, for wetting in-
wetting fingers. There, however, the macroscopic sorptivity vasion, fingers are macroscopic, and so A f is tied to the finger
evaluated between wetting entry and the saturation (or pres- diameter. Note that for nonwetting invasion considered here,
sure) within the finger was used to represent the influence of capillary forces oppose finger widening, and thus finger diam-
eter above that of a single pore is due to the invasion process
within a network of variable pores.
Because of the pore-scale nature of fingers, experimental
diameters are difficult to measure. However, we estimate them
below CB4 for the CO2 and TCE experiments to be ⬃0.6 – 0.7
and ⬃1.2–1.3 cm, respectively (see Figure 3). Additionally,
below CB4 we note that three fingers formed for both TCE
experiments. In order to compare (3) to these estimates, we
must obtain values for the various parameters within the rela-
tion. We take R nw max as the air entry value of the drainage
pressure-saturation curve for the coarse sand of ⬃0.0192 cm,
assuming contact angles for all systems are the same. R nw min
can also be estimated from the drainage pressure-saturation
curve at a representative fluid saturation for the finger. Ne-
glecting the gravitational or viscous dependency of R nw min, we
first consider an average effective fluid saturation derived from
standard percolation theory. Considering a random, spatially
uncorrelated network of pores within a cubic lattice, the per-
colation threshold is found to be ⬃0.3 [Stauffer and Aharony,
1992, p. 17]. Estimating the effective nonwetting saturation
S enw by this value (assuming all pores to have the same vol-
ume) yields R nw min of ⬃0.0173 cm for the coarse sand from
Figure 4. Time series of saturation at various locations dur-
ing nonwetting phase invasion for the CO2 experiment illus- the drainage pressure-saturation curve. Neglecting viscous
trating chaotic fluctuations in saturation. Saturation data have forces in (3) yields finger diameters of ⬃0.8 and 0.7 for CO2
been normalized by the mean at each location and shifted so and TCE, respectively. If we now consider the experimentally
that saturation histories may be compared. measured saturations within the fingers for CO2 of ⬃0.15– 0.203132 GLASS ET AL.: GRAVITY-DESTABILIZED NONWETTING PHASE INVASION
Figure 5. Redistribution of nonwetting phase at the conclusion of invasion for the TCE experiments: (a)
TCE redistribution in the primary heterostructure and (b) TCE redistribution in the secondary heterostruc-
ture. Dark zones indicate locations where TCE has drained. Light zones indicate locations to which the TCE
has migrated.
and for TCE of ⬃0.35– 0.40, R nw min ranges are ⬃0.0178 –
0.0176 and ⬃0.0169 – 0.0166 cm, with corresponding finger di-
ameters of ⬃0.6 – 0.7 and ⬃0.8 –1.0, respectively. For CO2 our
ht ⬃
2
⌬g ⫺
Q 冋 1
⫺
1
R nw R w册, (4)
kf Af
prediction now overlaps. Assuming that each TCE finger car-
ries a third of the flow, including viscous forces with experi- where R nw and R w are average radii for nonwetting and wet-
mental parameters for k and Q, if we take A f equivalent to ⬃ ting invasion within the unit, respectively. This process was first
three pores (⬃3 ␦2, where ␦ is the mean grain size for the unit), described by Glass et al. [1989c] for gravity-driven wetting fluid
d increases to ⬃1.2–1.3 cm for TCE (no change for CO2 for a fingers. As we will see, for the nonwetting case considered
single finger carrying the full supplied flow). Thus finger width here, the stringed cluster nature of the finger and the lack of
can be matched reasonably well with (3) if we consider the connecting films once pores are reinvaded with the wetting
finger’s pore-scale nature. phase imposes pulsation, while only a single oscillation is found
for the wetting case.
4.2. Pulsation Within a Finger The small critical pores connecting clusters along the finger
As a finger lengthens, we find the wetting fluid reinvades form the critical links within the conducting backbone of the
selected pores a distance behind the fingertip. This happens as finger. On the basis of our earlier description of finger burst
hydrostatic gravity forces act against viscous and hysteretic growth, these linking pores are also likely to be the smallest
capillary forces along the vertical length of the finger. Here the pores sampled and thus most likely to be reinvaded with the
differential capillary pressure of interest is between the non- wetting phase. When they are reinvaded with the wetting fluid,
wetting invasion at the fingertip and the wetting invasion be- the pathway is broken. Pressure within the upstream nonwet-
hind. If we consider a local balance of differential pressures ting phase must rebuild ⬃2 times wetting entry (see hysteretic
from the fingertip backward, we find that as the finger grows curves in Figure 2) to reinvade a critical pore. After reinvasion
vertically, gravity allows the reinvasion of pores with the wet- with the nonwetting fluid, h t , given by (4), is in time achieved
ting fluid when the finger reaches an average vertical tip length again, the wetting fluid enters the critical pore, and the cycle
ht: begins again. Because gravity forces reduce the total pressureGLASS ET AL.: GRAVITY-DESTABILIZED NONWETTING PHASE INVASION 3133
back along the finger, other noncritical “ancillary” pores within ment, (5) is not very sensitive to the value of the saturation that
the upstream cluster with slightly larger R also join the pulsa- we use to take corresponding R. Neglecting viscous forces and
tion, first filling with the nonwetting phase until the critical taking R corresponding to an average S nw of ⬃0.3 from the
pore is “opened” and then emptying until it is “closed.” Thus drainage curves in Figure 2 for the coarse to medium CB
the upstream cluster grows and then shrinks, amplifying the (R nwb ⬃ 0.0085 cm and R nwp ⬃ 0.0172 cm), h p max is ⬃8.7 cm
pulsation induced and controlled by the downstream critical for the CO2 invasions. Comparison to a measured mean h p max
pore. As a finger grows beyond a length of h t , it will contain a for CO2 of ⬃7 cm shows the estimates based on the pressure-
number of critical pores along its length where h t is achieved, saturation curves to be high by ⬃25% of the measured value.
and thus the nonwetting phase fragments into a series of steady There are at least four possible explanations for this discrep-
“residual” clusters connected by pulsating critical and ancillary ancy. The first is that the internal porous geometry of the units,
pores. When a finger reaches a CB, the invasion mode switches especially that composing the CB, was different from that
from gravity-destabilized to gravity-stabilized invasion. As the where the properties were measured. This is probable as the
pool grows back toward the source, pulsation is curtailed to a heterostructure and the homogeneous packs were filled and
distance h t from the edge of the growing pool back along the packed with different methods. The second is that the thinness
supplying finger. of the CBs allowed them to breach at a lower pressure. All the
While we found that finger diameter given by (3) is quite CBs were thin, ⬃1 cm (⬃20 pores), and laterally extensive,
sensitive to the saturation within the finger and thus choice of ⬃10 ⫻ 1 cm (⬃200 ⫻ 20 pores), and thus the probability of
the R values, (4) is not. If we estimate R nw and R w by an breaching the barrier at a lower pressure should be enhanced.
average value of S n w and S w of 0.3 from the pressure- The third is that our assumption of invariant contact angles for
saturation curves (R nw ⬃ 0.0172 cm and R w ⬃ 2 R nw ), all fluid-fluid systems is incorrect, and thus the R distributions
calculation of h t with (4) for the coarse layer neglecting viscous are different. Visual inspection of entrapped nonwetting
forces yields values of ⬃4.2 and 3.4 cm for CO2 and TCE, phase, however, showed very little if any deviation from a
respectively. Experimentally, we find pulsation during the CO2 contact angle of zero between the systems. Finally, it is possible
experiment throughout the entire finger run between CB3 and that the higher pressures required to breach the CB material
the pool above CB4 as well as below CB4, thus supporting the were capable of moving some grains of sand such as to create,
inviscid value given by (4) for CO2. For TCE, however, only the on average, a larger set of pores spanning the barrier.
two zones directly below CB3 and CB4 show pulsation, each Since all of these possibilities work to modify the bracketed
⬎15 cm above the maximum pool height behind CB4 and the term in (5) primarily by increasing R nwb, we scale it to match
bottom of the chamber, respectively. Including viscous forces the CO2 data (factor of 1.1) yielding h p max for TCE of ⬃5.7 cm
increases the TCE value calculated by (4) to ⬃15 cm for without viscous forces. For the TCE injection, mean h p max
measured k and Q if we take A f of ⬃3.3 ␦2 with, again, no (only measurable before CB4) attained ⬃11 cm in the primary
influence for CO2. Considering that three fingers form in the heterostructure. Taking measured values for k and Q, and
TCE experiment, this corresponds to ⬃1.1 ␦2 per finger. We estimating A within the pool to be ⬃6 cm2, if we take 16␦2 for
note that when viscous forces are important, (4) is very sensi- the backbone of the conducting finger network within the bar-
tive to the value of A f and that to match the experimental rier, (5) matches the measured value of ⬃11 cm for TCE.
results for TCE, it must be reduced from ⬃3 ␦2 per finger Similar calculations for the fine CB of the secondary hetero-
found earlier for a growing fingertip with (3). This result fur- structure yield h p max of ⬃20 cm neglecting viscous forces and
ther emphasizes the importance of the conducting backbone ⬃40 cm including them. The distance between the fine CB and
and reflects the decrease in its cross-sectional area from sev- CB3 above is ⬃24 cm, and we see in the experiment that the
eral pores at the fingertip down to a single pore controlling pool comprises the full coarse structure between. Thus for both
pulsation at h t . TCE experiments we again find that when viscous forces are
important, the most critical data are the cross-sectional area
4.3. Maximum Pool Height within the backbones of the conducting finger network, here
spanning the CB, and this value must once again be small and
We can obtain a simple relation for maximum pool height
on the pore scale to match the pool height data.
behind a CB, h p max, by once again balancing local pressure
Similar relations are easily written for the pool heights at
differences for capillary, gravity, and viscous forces. The dif-
which intermediate units are entered such as seen in our ex-
ferential capillary force of interest is that required to enter
periment within the secondary heterostructure. Additionally,
pores within the coarse unit behind the barrier versus that to
while not explored in our experiments, we note that viscous
enter and span the barrier. Viscous forces must now incorpo-
forces will also influence pool geometry as units become wider
rate both losses within the pool and the barrier. We find
by causing the breakthrough of capillary barriers before the
2
冋 1 1
册 entire pool unit is laterally spanned and filled to a uniform pool
冉 冊
h p max ⬃ ⫺ , (5) depth. For a 2-D pool such as we have in our experiment, we
fb fp R nwb R nwp
⌬g ⫺ Q ⫹ can approximate the horizontal expansion distance h p hor by
kb Ab kp Ap
balancing ⌬P v for flow horizontal within the pool unit against
where h p max is defined as the distance from the far edge of the the total pressure required for breaching the barrier to yield
capillary barrier to the top of the pool, f is the fraction of h p max
⌬ gk pA p
that is within each unit, and subscripts b and p apply to the h p hor ⬃ h p max共1 ⫺ f b兲 , (6)
barrier and pool, respectively. Note that both f b and f p are a Q
function of h p max, and thus (5) is not explicit in h p max and where A p now is an approximate average vertical cross-
requires iterative solution. sectional area per unit thickness of the pool and h p max is given
Because the R values in (5) are for different materials, both by (5). For the coarse-medium transition and our flow rates, if
of which have sharp pressure saturation curves in our experi- we take A p as 0.5 h p max, we calculate an h p hor of ⬃30 cm for3134 GLASS ET AL.: GRAVITY-DESTABILIZED NONWETTING PHASE INVASION
TCE and ⬃1.8 m for CO2, both wider than our system width. other CBs. This pulsation suggests a pathway through the bar-
We can see the beginnings of horizontal viscous force influence rier with large backbone pores which may be reinvaded at
in Plate 2b where more distant coarse regions fill at the same much lower pressures thus curtailing large excursions in pool
time as higher more central regions in the pool above CB4 (see height.
yellow in image). We also note that if the nonwetting fluid can
find a way around the CB within the horizontal distance h p hor,
the CB will not be breached by a vertical finger. 5. Basis of a “Structural” Growth Model
for Nonwetting Phase Migration
4.4. Pulsation Within a Pool The results of our experiments and analysis point to the
When a finger spans a CB, it encounters a lower capillary critical pore-scale control of the invasion process. Incorporat-
pressure in the unit beyond. The pores within the CB and the ing such pore-scale control into standard porous continuum
pool behind thus can experience a depressurization. If their approaches is problematic. However, substructures within the
pressure decreases to the wetting entry values for pores in the heterogeneous experiments, including where pulsation will oc-
pool or the CB, they will be reinvaded with the wetting fluid. cur, can be reasonably well predicted with the set of length
For the pool, pores at the top of the pool will be reinvaded, and scales derived through scale analysis. We use this result as the
the pool height will drop. Additionally, smaller pores along the foundation of a “structural” growth model for nonwetting
pool edges are also likely candidates for reentry. For the CB phase migration within a heterogeneous aquifer. By structural
breached by fingers, the smallest pores which join the clusters growth model we mean a model that produces the evolution of
of a finger are the most likely to be reinvaded with water. nonwetting phase structure, the resulting finger and pool spa-
To consider the reentry of pool pores with the wetting fluid tial configuration, and the zones where dynamic pulsation oc-
after a CB is breached, we balance viscous forces across the curs. Considering first the situation where viscous forces are
pool/barrier system against capillary and gravity forces to yield negligible, for a given heterogeneity structure with known pres-
h t pool: sure saturation curves for each unit, we can predict the growth
of the nonwetting phase straightforwardly by assembling fea-
2
冋 1 1
册 tures defined by our scale analysis– derived length scales. The
冉 冊
h t pool ⬃ ⫺ , (7)
fb fp R nw2 R w1 size of fingers, the height of pools, the penetration of CBs, and
⌬g ⫺ Q ⫹
k bA b k pA p the regions where pulsation will occur can all be delineated
from the point of injection to the boundaries of the field. With
where subscripts 1 and 2 denote the unit before and beyond the further knowledge of Q, the permeability for each unit, and
CB, respectively. As with (5), (7) is not explicit in h t pool. relations for the critical conducting backbone areas for fingers
Evaluation of this relation with values used previously yields both within and below CBs, nonnegligible viscous forces could
h t pool of ⬃4.2 cm for the CO2 and of ⬃8.9 cm for TCE. then be included as a perturbation of the inviscid structure
Because the pool height (⬃7 cm) is greater than h t pool for the yielding increased pond heights and finger widths. Finally, if it
CO2 experiment, pores within the pool are immediately rein- is important at the scale of application, the influence of both
vaded with wetting fluid, and the pool height begins to drop as pulsation and viscous forces to generate divergent pathways
soon as the CB is spanned. For TCE the same should occur, (i.e., multiple and divergent fingers) could be considered and
but it does not. We believe that this difference is likely due to superimposed on the core model results to yield the final
our simplified treatment of viscous forces within the barrier. If nonwetting phase structure within the domain.
A b is reduced from 16␦ to 12␦, (7) matches the h p max of ⬃11 In order to develop confidence in such a structural growth
cm. Thus the reinvasion of a small number of critical pores model, our experiments suggest that we must understand in
with water can increase the viscous drop across the barrier and order of importance: (1) the interplay between capillary and
yield an h t pool the same as h p max such that the pool height will gravity forces in context of interfacies and intrafacies lithologic
not decrease until flow stops and redistribution begins. Such a variation, (2) the added influence of viscous forces, and (3) the
small change in local saturation is likely within the noise of our possible additional complication imparted by pulsation. Obvi-
imaging system and thus is very difficult to detect. ously, facies-scale or macrolithologic variation controls the
Pool height will decrease until the critical pore within the CB core structure of the nonwetting phase migration and thus is of
is reinvaded with the wetting fluid. For negligible viscous forces highest importance. However, we also expect that the migra-
and assuming the influence of the growing finger below the CB tion process will be affected by the ever present intrafacies
is curtailed at the CB, this minimum pool height h p min is given microlayering found in subsurface sediments with the internal
by contrast and length scales (vertical and horizontal) of the sub-
h p min ⬃
2
⌬g 冋 1
⫺
1
R wb R wp 册
, (8)
scale structure critically controlling nonwetting invasion just as
we see in our current macroheterogeneous experiments. The
importance of this structure will increase as both its contrast
where subscripts b and p refer to the barrier and pool, respec- and length scales increase. In general, we expect greater me-
tively. Taking R wb and R wp as ⬃2 times their nonwetting andering parallel to the microlayering (usually horizontal)
values yields h p min of ⬃0.5 h p max or ⬃3.5 cm. Comparison to within a given unit. While for wetting fluid advance such mi-
the CO2 experiment where we find h p min of ⬃3.0 cm shows (8) crolayering yields a wider macroscopic structure that may be
to fit our data reasonably well. Once the CB closes, h p must consistent with unit-scale anisotropic effective properties, we
once again achieve h p max before it reopens thus causing the ⬃ are skeptical that a similar approach will be valid for nonwet-
factor of 2 unit-scale pool throbbing seen in the CO2 invasion. ting invasion. However, the greater horizontal meandering
The only pool that does not throb throughout the invasion should cause a greater randomness within the invasion struc-
period is behind CB1. There we see that the finger through the ture because a larger number of units can be sampled as
CB itself pulsates, something we do not detect in any of the invasion progresses.You can also read