Bone marrow hematopoiesis drives multiple sclerosis progression
←
→
Page content transcription
If your browser does not render page correctly, please read the page content below
Article

Bone marrow hematopoiesis drives multiple
sclerosis progression
Graphical abstract                                                          Authors
                                                                            Kaibin Shi, Handong Li, Ting Chang, ...,
                                                                            Jie Zhou, Fu-Dong Shi, Qiang Liu

                                                                            Correspondence
                                                                            qliu@tmu.edu.cn

                                                                            In brief
                                                                            Autoreactive T cells migrate into the bone
                                                                            marrow and skew hematopoietic stem
                                                                            and progenitor cells toward myeloid
                                                                            lineages that augment inflammatory brain
                                                                            injury, suggesting the restriction of bone
                                                                            marrow myelopoiesis as a potential
                                                                            therapy for multiple sclerosis.

Highlights
d   Patients with multiple sclerosis exhibit prominent bone
    marrow myelopoiesis

d   Autoreactive T cells migrate into the bone marrow via the
    CXCL12-CXCR4 axis

d   Autoreactive T cells augment bone marrow myelopoiesis

d   Bone marrow output of myeloid cells exacerbates CNS
    inflammatory injury

           Shi et al., 2022, Cell 185, 2234–2247
           June 23, 2022 ª 2022 The Author(s). Published by Elsevier Inc.
           https://doi.org/10.1016/j.cell.2022.05.020                                                       ll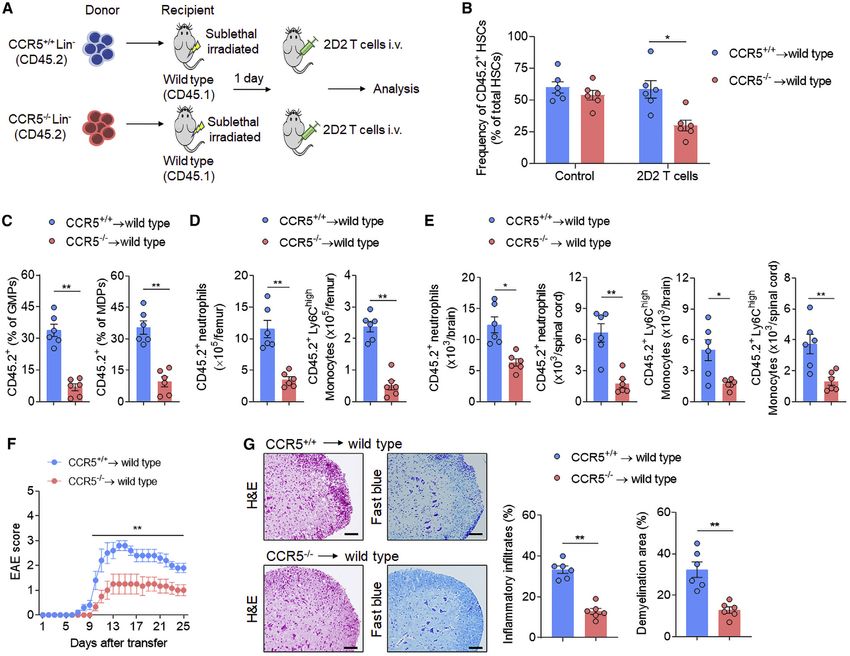
ll
     OPEN ACCESS

Article
Bone marrow hematopoiesis
drives multiple sclerosis progression
Kaibin Shi,1,2,6 Handong Li,1,6 Ting Chang,3,6 Wenyan He,2,6 Ying Kong,1 Caiyun Qi,1 Ran Li,1 Huachen Huang,1
Zhibao Zhu,4 Pei Zheng,1 Zhe Ruan,3 Jie Zhou,5 Fu-Dong Shi,1,2 and Qiang Liu1,7,*
1Department    of Neurology, Institute of Neuroimmunology, Tianjin Medical University General Hospital, Tianjin 300052, China
2Center  for Neurological Diseases, China National Clinical Research Center for Neurological Diseases, Beijing Tiantan Hospital, Capital
Medical University, Beijing 100070, China
3Department of Neurology, Tangdu Hospital, Air Force Medical University, Xi’an, Shaanxi 710038, China
4Department of Neurology, Institute of Neurology of First Affiliated Hospital, Institute of Neuroscience, and Fujian Key Laboratory of Molecular

Neurology, Fujian Medical University, Fuzhou, Fujian 350005, China
5Department of Immunology, School of Basic Medical Sciences, Tianjin Medical University, Tianjin 300070, China
6These authors contributed equally
7Lead contact

*Correspondence: qliu@tmu.edu.cn
 https://doi.org/10.1016/j.cell.2022.05.020

SUMMARY

Multiple sclerosis (MS) is a T cell-mediated autoimmune disease of the central nervous system (CNS). Bone
marrow hematopoietic stem and progenitor cells (HSPCs) rapidly sense immune activation, yet their potential
interplay with autoreactive T cells in MS is unknown. Here, we report that bone marrow HSPCs are skewed
toward myeloid lineage concomitant with the clonal expansion of T cells in MS patients. Lineage tracing in
experimental autoimmune encephalomyelitis, a mouse model of MS, reveals remarkable bone marrow mye-
lopoiesis with an augmented output of neutrophils and Ly6Chigh monocytes that invade the CNS. We found
that myelin-reactive T cells preferentially migrate into the bone marrow compartment in a CXCR4-dependent
manner. This aberrant bone marrow myelopoiesis involves the CCL5-CCR5 axis and augments CNS inflam-
mation and demyelination. Our study suggests that targeting the bone marrow niche presents an avenue to
treat MS and other autoimmune disorders.

INTRODUCTION                                                             son et al., 2018). Distinct from lymphocytes, neutrophils and
                                                                         monocytes have a rapid turnover rate of a few days due to their
Multiple sclerosis (MS) is an autoimmune disease of the central          short life-span, and thus exist as a limited population in blood
nervous system (CNS) that afflicts approximately 2.8 million peo-        (Boettcher and Manz, 2017; Janssen et al., 2016; Leuschner
ple worldwide. The majority of MS patients are under 40 years of         et al., 2012). During the active phase of MS, the mobilization of
age. CNS demyelinating lesions in MS and its animal model,               myeloid cells from the marginal blood pool and other peripheral
experimental autoimmune encephalomyelitis (EAE), are charac-             reserves leads to a surge of circulating myeloid cells associated
terized by massive CNS inflammatory infiltrates comprising an            with worsened disease activity (Hasselbalch et al., 2018; Kou-
intricate coordination of the innate and adaptive immune sys-            wenhoven et al., 2001; Naegele et al., 2012; Reder et al., 1998;
tems. Among CNS-infiltrating immune cells, autoreactive                  Rumble et al., 2015). However, the mechanisms of the contin-
T cells initiate CNS demyelinating lesions (Bar-Or and Li, 2021;         uous supply of newly generated myeloid cells and their impact
Dong and Yong, 2019; Hohlfeld et al., 2016; Louveau et al.,              on autoimmune inflammatory CNS injury remain unknown.
2016; Nylander and Hafler, 2012; Ransohoff et al., 2015).                   As a central immune organ, bone marrow is the primary site of
Following entry into the CNS, autoreactive T cells induce a              hematopoiesis that harbors hematopoietic stem and progenitor
cascade of cytokines and chemokines that initiate local inflam-          cells (HSPCs) to generate blood cells and to maintain immune
mation and recruit hematogenous myeloid cells, most notably              homeostasis in the periphery and CNS (Brioschi et al., 2021; Cu-
neutrophils and monocytes (Bar-Or and Li, 2021; Dong and                 gurra et al., 2021; Herisson et al., 2018; Mazzitelli et al., 2022).
Yong, 2019; Goverman, 2009; Moser et al., 2020; Ransohoff                Among various immune cell types from terminally differentiated
et al., 2015; Thompson et al., 2018). These recruited myeloid            progeny of HSPCs, those of the myeloid lineage predominate.
cells further escalate CNS inflammation by producing inflamma-           In MS and EAE, the surge of circulating neutrophils and mono-
tory factors and reactivate autoreactive T cells (Dong and Yong,         cytes suggests a dynamic production and supply from the
2019; Kawakami et al., 2004; Nylander and Hafler, 2012; Thomp-           bone marrow (Hasselbalch et al., 2018; Kouwenhoven et al.,

2234 Cell 185, 2234–2247, June 23, 2022 ª 2022 The Author(s). Published by Elsevier Inc.
This is an open access article under the CC BY license (http://creativecommons.org/licenses/by/4.0/).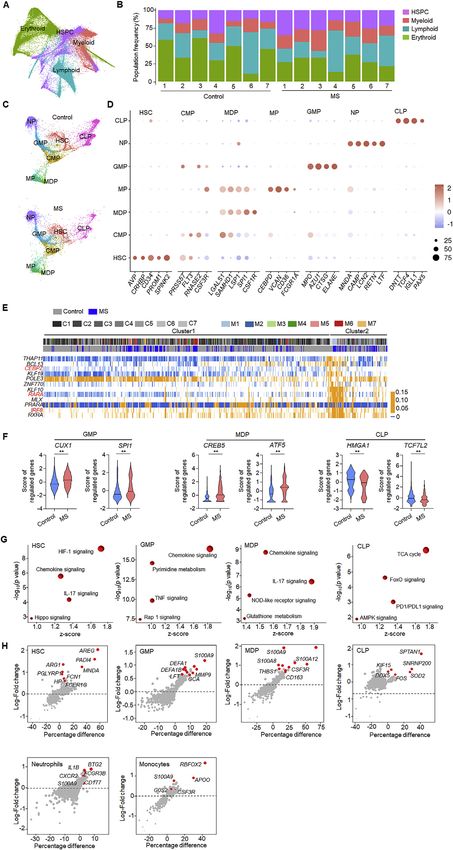
ll
Article                          OPEN ACCESS

                               (legend on next page)

          Cell 185, 2234–2247, June 23, 2022 2235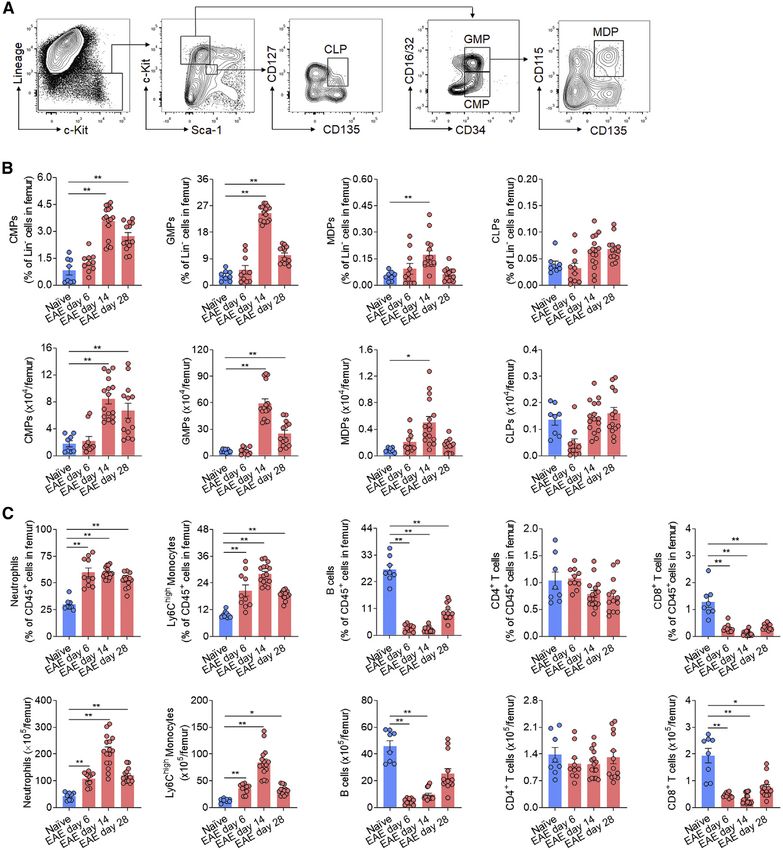
ll
OPEN ACCESS Article
2001; Naegele et al., 2012; Reder et al., 1998; Rumble et al., cells, and erythroid/megakaryocytes) based on uniform manifold
2015). In this regard, a number of key questions need to be approximation and projection (UMAP), which showed high inte-
resolved. First, since bone marrow is at the crossroads of blood gration quality reflected by cellular distribution on dimension
and immunity, how does bone marrow respond to MS; that is, reduction graphs. We identified an increase of HSPCs and
what are the dynamics and characteristics of bone marrow myeloid lineage cells in patients with MS relative to healthy con-
HSPC response in MS? Second, evidence suggests bone trols (Figures 1B, S1A, and S1B). Thereafter, we grouped bone
marrow as a preferential homing site for T cells (Di Rosa and marrow cells into clusters and mapped cells based on force-
Pabst, 2005; Li et al., 2007; Melenhorst et al., 2009), raising the directed graph from MS patients and controls (Figures 1C,
question whether autoreactive T cells reside in bone marrow S1C, and S1D). We found that bone marrow hematopoiesis
and impact hematopoietic lineage commitment? Third, because was substantially rewired toward myeloid lineages in patients
hematopoietic stem cell (HSC) activity is orchestrated by envi- with MS (Figures 1C and 1D), accompanied by a reduction of
ronmental factors to provide a balanced output of different stemness score in bone- marrow HSCs, suggesting an increase
leukocyte subtypes, is there a master switch that controls the ac- of HSC differentiation toward downstream lineages (Figure 1E).
tivity of HSPCs in MS and EAE? Fourth, what is the fate of the Notably, we found an increase of gene modules (e.g., AZU1,
newly produced myeloid cells such as neutrophils and mono- MPO, and S100A8) in granulocyte-monocyte progenitors
cytes in MS? Lastly, what is the impact of newly generated (GMPs) and (e.g., CST3, IFITM3, and CTSS) in monocyte-den-
myeloid cells on inflammatory CNS injury? This study seeks to dritic cell progenitors (MDPs) among HSPCs of MS patients (Fig-
address these questions. ure 1F), accompanied by an increase of transcription factors
related to myeloid differentiation, including CEBPZ, RARA, and
RESULTS IRF8 (Figures 1G, S1E, and S1F). These signatures imply an
increased differentiation of HSCs to the myeloid lineage in MS.
Mobilization of bone marrow HSCs and myelopoiesis in To measure differentially expressed genes (DEGs), KEGG-
patients with MS pathway analysis was adopted and revealed the enrichment of
Leukocyte entry into the CNS is a cardinal early event in MS. hypoxia-inducibale factor-1 (HIF-1) signaling, chemokine
Massive infiltration of leukocytes into the CNS suggests their signaling, IL-17 signaling, and Hippo signaling in HSCs from MS
rapid consumption from limited peripheral reserves, which can patients (Figure S1G), we also note an upregulation of DEGs,
stimulate the replenishment of new cells from hematopoietic or- including AREG, PADI4, ARG1, and MNDA here (Figure S1H). In
gans such as bone marrow. To understand how HSPCs sense GMPs from MS patients, we found enrichment of chemokine
and adapt to disease development in MS, we characterized signaling, pyrimidine metabolism, tumor necrosis factor (TNF)
HSPCs and their downstream lineages in bone marrow samples signaling, and Ras-associated protein 1 (Rap1) signaling (Fig-
obtained from treatment-naive MS patients with single-cell RNA ure S1G) as well as the upregulation of the DEGs S100A9,
sequencing and flow cytometry analysis (Figure 1A). After Lou- DEFA1, and MMP9 (Figure S1H). In MDPs of MS patients, chemo-
vain clustering of 108,983 cells, canonical markers were used kine signaling and IL-17 signaling were enriched (Figure S1G) and
to identify four major cell types (HSPCs, myeloid cells, lymphoid DEGs including S100A9, S100A12, S100A8, CSF3R and CD163
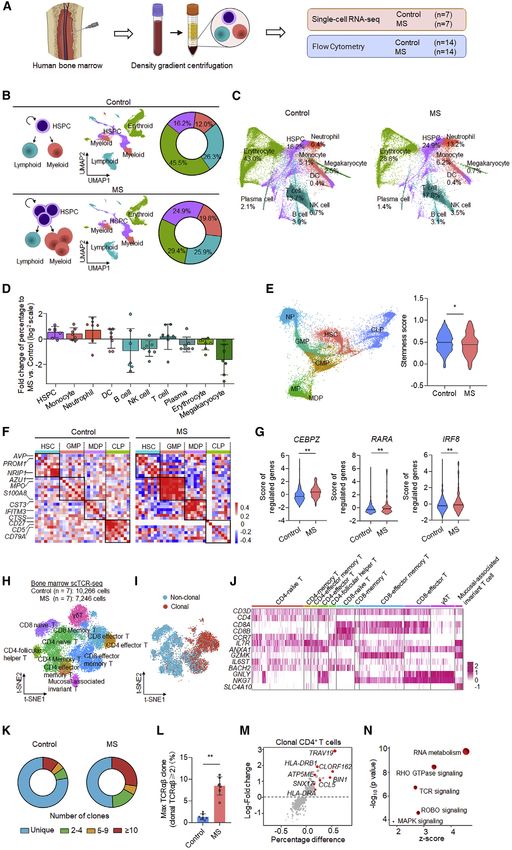
Figure 1. Single-cell RNA sequencing of bone marrow cellular lineages reveal aberrant myelopoiesis in patients with MS
(A) Experimental design for single-cell sequencing and flow cytometry analysis of bone marrow cells from patients with MS and healthy control individuals.
(B) Schemes (left) of HSPCs and downstream cellular lineages. UMAP plots (middle) and summarized percentage (right) from a total of 108,983 cells comprising of
HSPCs, myeloid cells, lymphoid cells, and erythroid cells. (HSPC, hematopoietic stem and progenitor cell).
(C) Force-directed graph of 10 clusters with cell-type annotations, as specified in the legend. The proportions of each cluster in control and MS groups are shown.
(DC, dendritic cell; NK, natural killer).
(D) Bar graph shows log2 fold changes (positive values: increase; negative values: decrease) of the percentage of cells from individual MS patients mapped to
each cluster divided by the percentage of averaged control cells in the same cluster. n = 7.
(E) Force-directed graph (left) display of 22,649 HSPCs from control and MS cells. Violin graph (right) shows HSC stemness score. (HSC, hematopoietic stem cell;
CMP, common myeloid progenitor; GMP, granulocyte-monocyte progenitor; MDP, monocyte-dendritic cell progenitor; CLP, common lymphoid progenitor; NP,
neutrophil precursor; MP, monocyte progenitor).
(F) Gene pairwise Spearman correlation within the HSPCs of 80%–90% of stemness scores from MS patients and control. The heatmaps show increased expres-
sion of GMP- and MDP-associated gene modules within 80%–90% of the stemness score from MS patients versus control subjects.
(G) Analysis of regulon activity scores shows increased expression of transcription factors related to myeloid differentiation in HSCs from MS patients.
(H) Bone marrow cells clustered by multidimensional reduction with t-SNE shows T cell subpopulations. (Control: 10,266 cells from 7 subjects; MS: 7,246 cells
from 7 subjects).
(I) Concentration of clonal cells in locations of T cell clusters (n = 7 subjects per group).
(J) Marker expression of bone marrow T cells used to classify subclusters.
(K) Plots of TCRab clonality show enhanced clonal expansion and more highly expanded clones in MS patients (n = 7 subjects per group). Clones are colored by
proportion of the total TCRab sequences.
(L) Quantification of maximum clones (% TCRab sequences) shows a higher percentage in patients with MS than in controls (n = 7 subjects per group).
(M) Differential expression analysis of clonal CD4+ T cell (clonal TCRab R 2) shows increased expression of genes (red) in MS patients versus control subjects.
(N) Pathway analysis of differentially expressed genes in clonal CD4+ T cells shows higher level of activity in pathways such as TCR signaling in MS patients versus
control subjects. Pathways (circles) with positive Z scores are colored red. Circle size corresponds to Z score value. Mean ± SEM. *p < 0.05, **p < 0.01. Two-tailed
unpaired Student’s t test (E, G, and L).
2236 Cell 185, 2234–2247, June 23, 2022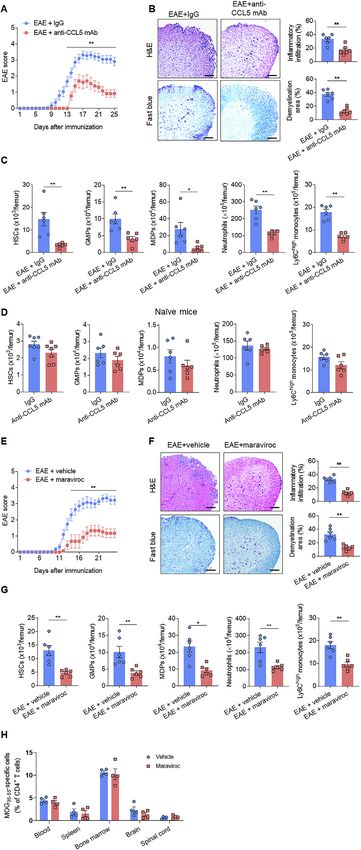
ll
Article                                                                                                               OPEN ACCESS

were upregulated (Figure S1H). In neutrophils of MS patients, up-     have stronger effects on HSC activity. Using transgenic mouse
regulation of DEGs included BTG2, IL1B, CXCR2, FCGR3B, and            lines harboring autoreactive CD4+ T cells that recognize
S100A9 (Figure S1H). In monocytes from MS patients, we identi-        OVA323–339 or MOG35–55 epitope (2D2), we found higher counts
fied the upregulation of DEGs, including RBFOX2, APOO,                of bone marrow HSCs and their expression of Ki67 in 2D2
S100A9, G0S2, and CSF3R (Figure S1H).                                 mice compared with OVA and controls (Figure 2F). In a passive
   To determine potential alterations of T cell clones in MS pa-      EAE model, we also found increased HSC activity in the bone
tients, we performed subclustering analyses from a total of           marrow of wild-type recipient mice after transfer of myelin-reac-
17,512 T cells (Figure 1H). In particular, single-cell TCR-           tive T cells that were collected from spleen of wild-type EAE mice
sequencing analyses revealed clonal expansion of bone marrow          (Figure S3C). These results suggest that myelin-reactive T cells
T cells of MS patients (Figures 1I and 1J), together with an in-      increase the activity of HSCs in bone marrow.
crease of highly expanded clones (Figure 1K). Quantification             Next, we assessed bone marrow cellular lineage using flow cy-
revealed an increase of the most highly expanded (maximum)            tometry. We found an increase in bone marrow CMPs, GMPs,
T cell clones in MS patients versus controls (Figure 1L), suggest-    and MDPs at 14 dpi, the peak phase of EAE (Figures 3A and
ing clonal expansion of bone marrow T cells in MS patients.           3B). In contrast, the count of common lymphoid progenitors
Bone marrow clonal CD4+ T cells in MS patients displayed              (CLPs) was not significantly altered (Figure 3B). Moreover, the
increased expression of DEGs (TRAV19, CLORF162, and                   numbers of neutrophils and Ly6Chigh monocytes were robustly
CCL5) (Figure 1M), as well as the enrichment of RNA meta-             increased in bone marrow of femurs and CNS-surrounding
bolism, Ras-homologous (RHO) GTPase signaling, TCR                    bones at 14 dpi in EAE mice with actively (Figures 3C, S4A,
signaling, and Roundabout (ROBO) signaling (Figure 1N).               and S4B) or passively transferred disease (Figure S4C). The
   Additionally, flow cytometry analysis revealed increased           numbers of lymphocytes such as B cells and CD8+ T cells
counts of HSCs, myeloid-cell progenitors (common myeloid pro-         were reduced in bone marrow of femur and CNS-surrounding
genitors [CMPs] and GMPs), and downstream neutrophils and             bones from EAE mice (Figures 3C, S4B, and S4C).
monocytes (Figure S2). Together, these results provide a broad
and unbiased view of the cellular and molecular features of           Enhanced hematopoiesis of neutrophils and Ly6Chigh
bone marrow hematopoietic cells in MS.                                monocytes in the bone marrow of EAE mice
                                                                      To track the fate of newly derived neutrophils and Ly6Chigh
Hyperresponsiveness of bone marrow in EAE mice                        monocytes within bone marrow, we leveraged lineage tracing
resembles that in MS patients                                         of HSCs and their ontogeny in EAE mice. HSCs, downstream
To gain insight into the bone marrow characteristics displayed by     progenitors, and differentiated neutrophils/monocytes/lympho-
MS patients, we adopted a murine model of MS, EAE, induced            cytes were genetically labeled with tdTomato in a transgenic
by MOG35–55 immunization. We found a remarkable increase of           Fgd5-CreER/tdTomato mouse line. This approach allowed us
long-term HSCs (LinSca1+c-Kit+CD150+CD48) in the femur              to spatially and temporally map the fate of HSCs and down-
bone marrow, along with increased 5-bromo-20 -deoxyuridine            stream myeloid cells over the course of EAE (Figure 4A).
(BrdU) incorporation in EAE mice (Figures 2A–2C). The increase        Following EAE induction, increased signal of tdTomato+ HSCs
of HSCs started at 6 days post-immunization (dpi) and persisted       in the bone marrow of Fgd5-CreER/tdTomato mice at 7 and
until the late disease phase (Figures 2B and 2C). In addition, we     14 dpi was seen (Figures 4B and 4C). Importantly, we note a
found downregulation of stemness genes (Cdkn1, Fgfr3, Hoxb5,          corresponding increase of tdTomato+ GMPs and MDPs, but
Hoxb6, Egr1, and Aldh1) in HSCs at early (7 dpi), peak (14 dpi),      not CLPs (Figure 4C), and an increase of tdTomato+ neutrophils
and late (28 dpi) disease phases in these mice (Figure S3A). Of       and Ly6Chigh monocytes in the bone marrow was also deter-
interest, we also detected an increase of HSCs within the cra-        mined (Figures 4D and 4E). These findings demonstrate the
nium and vertebral bone marrow (Figure S3B). Using micro-posi-        consequence of increased myelopoiesis, leading to augmented
tron-emission tomography (PET) and computed tomography                production of neutrophils and Ly6Chigh monocytes in EAE.
(CT) scanning, we found increased uptake of 18F-fluorodeoxy-             To track the mobilization of these newly derived neutrophils
glucose (FDG), a glucose uptake tracer, within the femur and          and Ly6Chigh monocytes, we measured the counts of tdTomato+
vertebral bone of EAE mice at 14 dpi (Figure 2D), reflecting an in-   cells in multiple organs. Flow cytometry analysis of cells from
crease in bone marrow cell activity.                                  spleen, blood, brain, and spinal cord revealed that tdTomato+
   As EAE is a model of autoimmune response directed against          neutrophils and Ly6Chigh monocytes were increased in spleen
specific components of myelin, we next examined whether an in-        and blood, as well as in the brain and spinal cord (Figures 4F–
crease of HSC activity in EAE mice requires autoantigen speci-        4H). These results demonstrate that newly generated neutrophils
ficity. In mice receiving incomplete Freund’s adjuvant (IFA), com-    and Ly6Chigh monocytes can be mobilized from bone marrow
plete Freund’s adjuvant (CFA), pertussis toxin (PT), IFA plus PT,     and penetrate the CNS tissues, suggesting that these cells
or CFA plus PT without autoantigen, HSC activity remained             may contribute to neuroinflammation during EAE development.
similar to naive controls (Figure 2E), suggesting that exogenous
autoantigen is required for the increase in bone marrow HSC ac-       Myelin-reactive T cells ‘‘home’’ to bone marrow and
tivity. Indeed, immunization with MOG35–55 led to a significant in-   influence myelopoiesis
crease of HSCs (Figure 2E). In contrast, immunization with oval-      The bone marrow niche harbors environmental factors that can
bumin (OVA)323-339 had a less profound impact on HSC activity         attract T cells from circulation and lymphoid organs (Di Rosa
than MOG35 55 (Figure 2E), suggesting that MOG35–55 may               and Pabst, 2005; Li et al., 2007; Melenhorst et al., 2009). As

                                                                                              Cell 185, 2234–2247, June 23, 2022 2237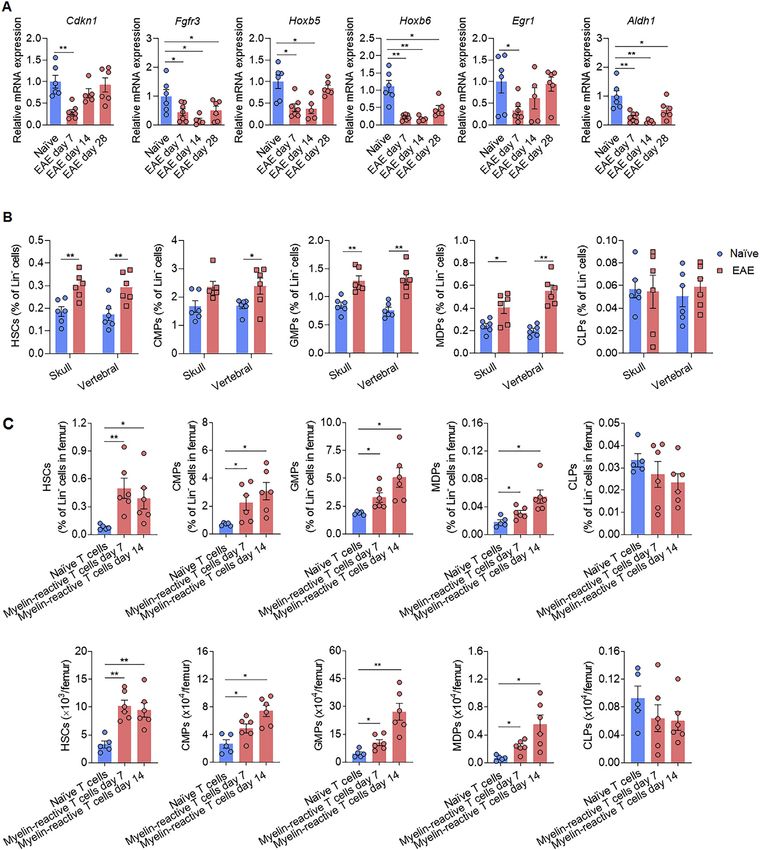
ll
      OPEN ACCESS                                                                                                                               Article

Figure 2. Increased number and activity of bone marrow HSCs in EAE mice
C57/BL6 mice were immunized with MOG35–55 to induce EAE. After immunization, mice developed the first neurological symptoms at day 8 reaching 100% of
incidence on day 14. Naive mice were used as controls. Femur bone marrow cells were harvested at indicated time points after immunization.
(A–C) Flow cytometry detection of bone marrow HSC number and proliferation.
(A) Gating strategy of HSCs in bone marrow (LinSca-1+c-Kit+CD48CD150+).
(B) Frequency (left) and counts (right) of HSCs in femur bone marrow of EAE mice at indicated time points.
(C) Flow cytometry histograms and bar graph showing the incorporation of BrdU by HSCs. In (B) and (C), n = 10, 12, 16, and 12 in groups of naive, EAE day 6, EAE
day 14, EAE day 28, respectively. Average clinical EAE scores were 0, 3, 2.5 at 6, 14, 28 days post-immunization (dpi), respectively. Data are representative of
three independent experiments.
(D) 18F-FDG PET-CT images of vertebral and femur bone marrow at 14 dpi; dashed red lines show the regions of interest for quantification. Bar graphs showing
the measurement of standard uptake value (SUV). Vertebral: n = 6 mice per group. Femur: n = 12 legs from 6 mice per group. Data are representative of three
independent experiments.
(E) Groups of mice receiving incomplete Freund’s adjuvant (IFA), complete Freund’s adjuvant (CFA), and pertussis toxin (PT), IFA + PT, CFA + PT, OVA323–339
immunization, or MOG35–55 immunization. Naive mice were used as controls. Femur bone marrow was harvested at day 6 post-immunization. HSCs and their
incorporation of BrdU were assessed by flow cytometry. n = 6 per group. Data are representative of three independent experiments.
(F) Flow cytometry analysis of HSCs in 3 month-old naive OT-II mice (TCR-transgene specific for OVA323–339) without immunization and naive 2D2 mice (TCR-
transgene specific for MOG35–55) without immunization. 2D2 mice used were nonimmunized and healthy without autoimmune optic neuritis. Wild-type mice were
used as controls. n = 8 per group. Data are representative of three independent experiments. Mean ± SEM. *p < 0.05, **p < 0.01. One-way ANOVA followed by
Tukey post hoc test (B and C) or two-tailed unpaired Student’s t test (D–F).

myelopoiesis is augmented in wild-type EAE mice, we asked                        mine the phenotype of CD4+ T cells homing to bone marrow,
whether autoreactive T cells can migrate into bone marrow and                    we injected myelin-reactive CD4+ T cells obtained from donor
affect hematopoiesis. Flow cytometry analysis revealed that                      ubiquitin-GFP (UBC-GFP) EAE mice into recipient Rag2/
MOG35–55-specific CD4+ T cells predominantly accumulate in                       mice (lacking T and B cells) (Figure 5C). We found that myelin-
the bone marrow of EAE mice from the early to peak phases                        reactive T cells homing to bone marrow are mainly
(Figures 5A, 5B, and S5A), this is accompanied by biased TCR                     CD44+CD62L along with a portion of T cells expressing the
Vb usage in bone marrow CD4+ T cells (Figure S5B). To deter-                     activation marker CD69 (Figure 5D). These profiles resemble

2238 Cell 185, 2234–2247, June 23, 2022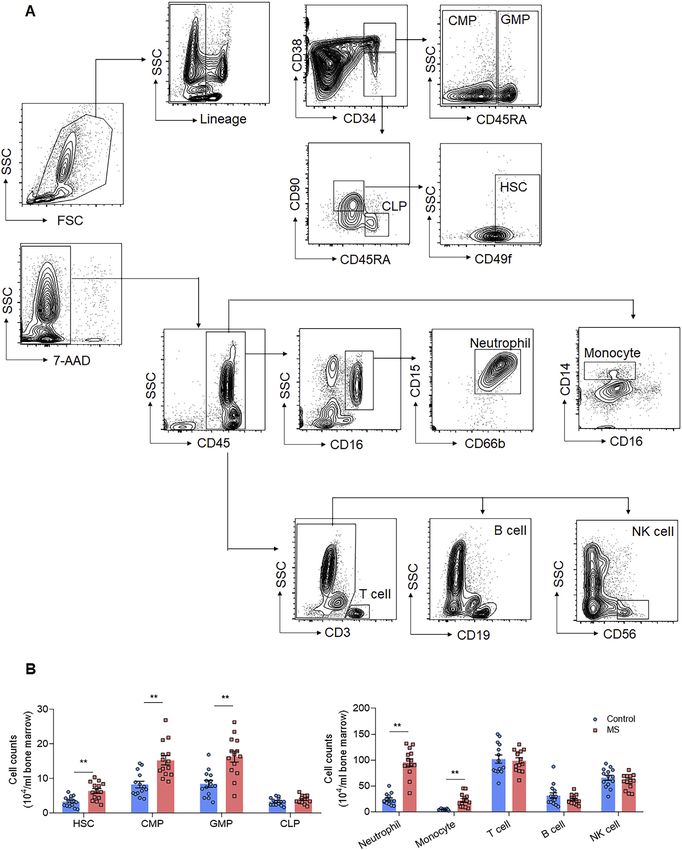
ll
Article                                                                                                                                        OPEN ACCESS

Figure 3. Increased myelopoiesis in bone marrow of EAE mice
C57/BL6 mice were immunized with MOG35–55 to induce EAE. Following immunization, mice developed the first neurological symptoms at day 8, reaching 100%
of incidence on day 14. Naive mice were used as controls. Femur bone marrow cells were harvested at indicated time points post-immunization.
(A) Flow cytometry gating strategy of bone marrow common lymphoid progenitors (CLPs, LinSca-1intc-Kitint CD127+CD135+), common myeloid progenitors
(CMPs, LinSca-1c-Kit+CD34+CD16/32int), granulocyte-monocyte progenitors (GMPs, LinSca-1c-Kit+CD34+CD16/32hi) and monocyte-dendritic cell pro-
genitors (MDPs, LinSca-1c-Kit+CD34+CD16/32hiCD115+CD135+).
(B) Frequency and counts of progenitor cells in femur bone marrow of EAE mice at indicated time points; upper, percentage of each progenitor cells in Lin cells;
lower, absolute numbers.
(C) Flow cytometry analysis of downstream myeloid cells and lymphocytes in bone marrow at indicated time points post-immunization. Graphs show the fre-
quency and counts of neutrophils (CD45+CD11b+Ly6G+), Ly6Chigh monocytes (CD45+CD11b+Ly6GF4/80Ly6Chigh), B cells (CD45+ CD11bCD3CD19+),
CD4+ T cells (CD45+CD11bCD3+CD4+) and CD8+ T cells (CD45+CD11bCD3+CD8+) in femur bone marrow (upper, percentage of each cell subsets in
CD45+ cells; lower, absolute numbers); gating strategy is depicted in Figure S4A.
In (B) and (C), n = 8, 10, 16, 13, in groups of naive, EAE day 6, EAE day 14, EAE day 28 mice, respectively. Average EAE scores were 0, 3, 2.5 at day 6, 14, and 28,
respectively. Data were representative of four independent experiments. Mean ± SEM. *p < 0.05, **p < 0.01. One-way ANOVA followed by Tukey post hoc test (B
and C).

                                                                                                                 Cell 185, 2234–2247, June 23, 2022 2239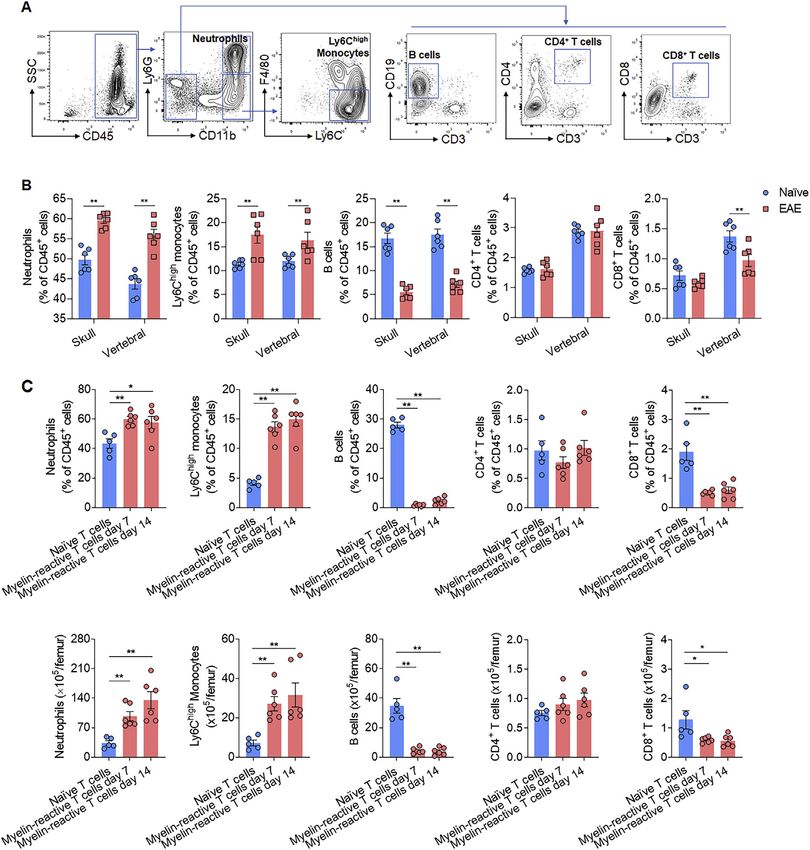
ll
      OPEN ACCESS                                                                                                                               Article

Figure 4. Fate-mapping of HSCs and downstream cellular lineages reveals increased bone marrow production of neutrophils and Ly6Chigh
monocytes that invade the CNS
(A) Schematic diagram depicts the lineage-tracing of bone marrow HSCs, downstream progenitors, myeloid cells, and lymphocytes. Fgd5-CreER/tdTomato re-
porter mice received daily tamoxifen treatment for 5 consecutive days prior to EAE induction. Mice were immunized with MOG35–55 to induce EAE. After immu-
nization, mice developed the first neurological symptoms at day 8 reaching 100% of incidence on day 14. Naive mice were used as controls. Mice receiving
tamoxifen treatment without EAE immunization were set as naive controls. Flow cytometry was performed at 7, 14, and 28 dpi.
(B) Flow cytometry plots show tdTomato-expressing HSCs of indicated groups at 14 dpi.
(C) Quantification of tdTomato-expressing HSCs and downstream myeloid/lymphoid progenitors at 7, 14, and 28 dpi (n = 6, 8, 6 in naive group and 8, 8, 6 in EAE
group at 7, 14, and 28 dpi, respectively). Data are representative of three independent experiments.
(D) Flow cytometry plots showing tdTomato-expressing neutrophils and Ly6Chigh monocytes in bone marrow at 14 dpi.
(E) Counts of tdTomato-expressing neutrophils, Ly6Chigh monocytes, dendritic cells, B cells, and T cells in bone marrow at indicated time points. n = 6, 8, 6 in
naive group and 8, 8, 6 in EAE group at 7, 14, and 28 dpi, respectively. Data are representative of three independent experiments.
(F–H) Counts of tdTomato-expressing neutrophils and Ly6Chigh monocytes in spleen (F), blood (G), and CNS (brain and spinal cord tissues) (H). n = 8 per group.
Data are representative of three independent experiments. Mean ± SEM. *p < 0.05, **p < 0.01. Two-way ANOVA followed by Bonferroni test (C and E), two-tailed
unpaired Student’s t test (F–H).

myelin-reactive T cells in different organs of donor EAE mice                      CXCL12 is a key factor derived from bone marrow stromal
prior to transfer (Figures S5C and S5D). Additionally, we also                   cells to bind its cognate receptor CXCR4 to drive lymphocyte
found an increase of CD4+ T cells in the bone marrow of 2D2                      chemotaxis. We therefore tested the potential role of CXCL12-
mice without immunization (Figure S5E).                                          CXCR4 axis in the migration of myelin-reactive T cells to bone

2240 Cell 185, 2234–2247, June 23, 2022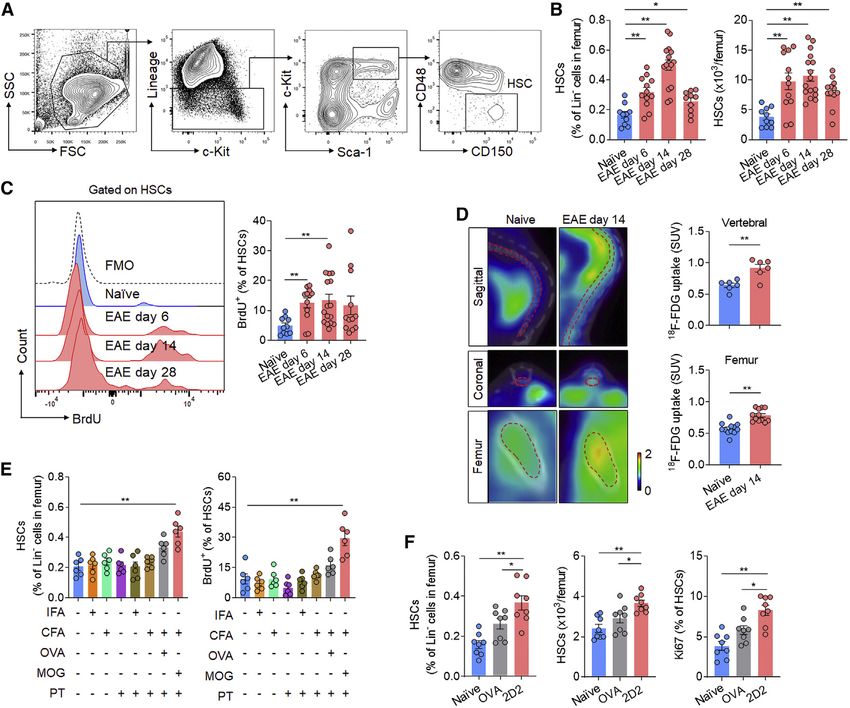
ll
Article                                                                                                                                   OPEN ACCESS

Figure 5. Myelin-reactive T cells preferentially home to bone marrow and induce myelopoiesis
(A and B) C57/BL6 mice were immunized with MOG35–55 to induce EAE. After immunization, mice developed the first neurological symptoms at day 8 reaching
100% of incidence on day 14. Naive mice were used as controls.
(A) Flow cytometry histograms show the frequencies of MOG35–55-specific CD4+ T cells in blood, spleen, lymph nodes, bone marrow, brain and spinal cord of
wild-type EAE mice at 14 dpi. Percentages in the gating indicate average values in EAE mice. Data are representative of three independent experiments.
(B) Frequencies of MOG35–55-specific CD4+ T cells in femur bone marrow of EAE mice at indicated time points. n = 4 in naive group. n = 6 in EAE group. Data are
representative of two independent experiments.
(C and D) UBC-GFP mice were immunized with MOG35–55 to induce EAE, naive UBC-GFP mice were used as control, spleen CD4+ T cells were isolated at day 14
after immunization; 2 3 106 CD4+ T cells were i.v. injected into to Rag2/ recipient mice. Flow cytometry analysis was conducted at day 7 after transfer.
(C) Schematic diagram shows the experimental design.
(D) Flow cytometry assessment of transferred (GFP+) CD4+ T cells homing to femur bone marrow. Graph shows the frequencies of indicated cellular subsets of
CD4+ T cells. n = 6 per group. Data are representative of two independent experiments.
(E) CD4+ T cells were isolated from spleen tissues of UBC-GFP EAE mice. After in vitro siRNA knockdown of CXCR4, 2 3 106 CD4+ T cells were then i.v. injected
into recipient Rag2/ mice. Rag2/ mice receiving CD4+ T cells treated with control siRNA were used as a control. Bar graph shows the frequency of GFP+CD4+
T cells detected by flow cytometry in different compartments of recipient Rag2/ mice at day 7 after transfer. n = 4 per group. Data are representative of two
independent experiments.
(F–I) Splenic CD4+ T cells without regulatory T cells (CD3+CD4+CD25Vb11+) were isolated by FACS from 2D2 mice. Splenic CD4+ T cells without regulatory
T cells (CD3+CD4+CD25) from wild-type mice were used as a control. 2 3 106 CD4+ T cells were i.v. injected into recipient Rag2/ mice.
(F) Flow cytometry was performed to analyze bone marrow responses of recipient mice at day 7 after transfer.
(G) Frequency of 2D2 T cells in different compartments of recipient Rag2/ mice (n = 4). Data are representative of two independent experiments.
(H) Counts of HSCs and their expression of Ki67 in femur bone marrow of Rag2/ receipt mice (n = 6 per group). Data are representative of three independent
experiments.
(I) Counts of GMPs, MDPs, neutrophils, and Ly6Chigh monocytes in the femur bone marrow of recipient Rag2/ mice (n = 6 per group). Data are representative of
three independent experiments. Mean ± SEM. *p < 0.05, **p < 0.01; two-tailed unpaired Student’s t test (D, E, H, and I).

                                                                                                             Cell 185, 2234–2247, June 23, 2022 2241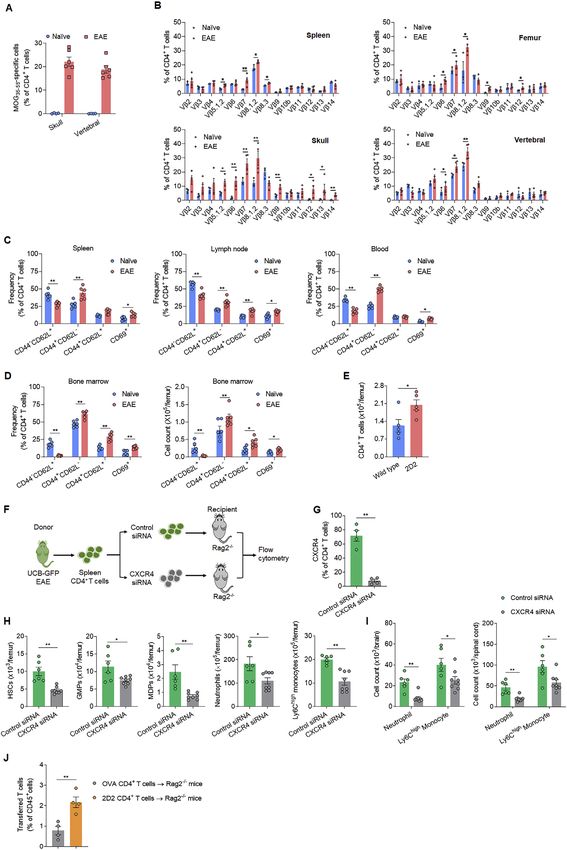
ll
     OPEN ACCESS                                                                                                         Article

marrow. To this end, we used small-interfering RNA (siRNA) to      harboring CCR5/ or CCR5+/+ HSCs. Sublethally irradiated
in vitro knockdown CXCR4 in CD4+ T cells isolated from spleen      wild-type (CD45.1) recipients received bone marrow injections
of UCB-GFP EAE mice, and then injected these myelin-reactive       of either CCR5/ (CD45.2) or wild-type CCR5+/+ (CD45.2) Lin
T cells into Rag2/ recipient mice (Figure S5F and S5G). We       cells and were induced for EAE development via i.v. injection
found that the homing of myelin-reactive CD4+ T cells to bone      of 2D2 T cells (Figure 7A). At day 14 after injection, we found
marrow following CXCR4 knockdown was impaired (Figure              lower percentages of HSCs and reduced counts of myeloid pro-
5E), together with a blunted increase of bone marrow HSCs          genitors, neutrophils, and Ly6Chigh monocytes in the bone mar-
and downstream myeloid lineage cells (Figures S5H and S5I).        rows of mice receiving donor CCR5/Lin cells versus donor
In addition, homing of 2D2 T cells into bone marrow was more       CCR5+/+Lin cells (Figures 7B–7D), together with reduced CNS
prominent than OVA-transgenic CD4+ T cells (Figure S5J). These     infiltration of neutrophils and Ly6Chigh monocytes (Figure 7E),
results suggest a pivotal role of the CXCL12-CXCR4 axis in the     suggesting that myelin-reactive T cells mainly increase the activ-
recruitment of myelin-reactive T cells into bone marrow in EAE.    ity of CCR5+/+ HSCs but not CCR5/ HSCs in the bone marrow
   To further examine the impact of myelin-reactive T cells on     of recipient mice. In addition, mice receiving donor CCR5/Lin
bone marrow myelopoiesis, we injected 2D2 T cells into             cells displayed attenuated neurological deficits and CNS demy-
Rag2/ recipient mice. Thereafter, we found that 2D2 T cells      elination relative to recipient mice receiving donor CCR5+/+Lin
preferentially migrated to bone marrow in recipient mice           cells (Figures 7F and 7G).
(Figures 5F and 5G), accompanied with an increase of HSC ac-          Finally, we showed that pharmacological disruption of the
tivity, and downstream myeloid progenitors (GMP and MDP) and       CCL5-CCR5 axis in wild-type EAE mice using anti-CCL5 mAb
myeloid cells (neutrophils and Ly6Chigh monocytes) activity        (Figures S7A–S7D) or maraviroc, an FDA-approved CCR5 antag-
(Figures 5H and 5I). These results suggest that myelin-reactive    onist (Figures S7E–S7G) reduced neurological deficits, CNS
T cells contribute to the augmentation of bone marrow              demyelination, and leukocyte infiltration into spinal cord tissues,
myelopoiesis.                                                      together with mitigated increase of HSCs, downstream myeloid
                                                                   progenitors (GMP and MDP), neutrophils, and Ly6Chigh mono-
The augmentation of bone marrow myelopoiesis                       cytes in the bone marrow. Anti-CCL5 mAb treatment did not
involves the CCL5-CCR5 axis                                        significantly alter the counts of bone marrow HSCs, downstream
The activity of HSCs and downstream progenitors are deter-         myeloid progenitors, monocytes, and neutrophils in naive wild-
mined by environmental factors. To understand how autoreac-        type mice (Figure S7D). In addition, maraviroc did not signifi-
tive T cells induce bone marrow myelopoiesis, we quantified        cantly alter the levels MOG35–55 tetramer+ T cells in the bone
the factors derived from bone marrow-residing 2D2 T cells.         marrow, suggesting that CCR5 inhibition may not impair autor-
Among 113 cytokines measured by a proteome profiler, we            eactive T cell homing to bone marrow (Figure S7H).
found that cytokine CCL5 (Rantes) is highly expressed by 2D2          Together, these results imply that disruption of the CCL5-
CD4+ T cells (Figures 6A, S6A, and S6B). Similarly, flow cytome-   CCR5 axis reduced bone marrow generation of neutrophils
try analysis also revealed upregulation of CCL5 in 2D2 T cells,    and inflammatory monocytes, alleviating the magnitude of
versus wild-type controls, in the bone marrow, spleen, and         neuroinflammation.
lymph nodes (Figure 6B).
   To identify the molecular machinery underlying 2D2 T cell-      DISCUSSION
induced myeloid bias of HSCs, we performed high-throughput
NanoString transcriptome sequencing of bone marrow HSCs            The prevailing study of the etiology of MS is focused on autoreac-
obtained from 2D2 mice. HSCs from 2D2 mice display remark-         tive T cells that penetrate the CNS. Once entering the CNS, these
able transcriptome changes (Figure 6C). Among the top upregu-      T cells undergo reactivation and initiate inflammatory demyelin-
lated genes in HSCs of 2D2 mice, genes related to myelopoiesis     ating lesions. Although increasing evidence suggests the sec-
were highly upregulated (Figure 6C), particularly, CCR5, a mye-    ondary involvement of neutrophils and monocytes in CNS inflam-
lopoiesis-related gene, was remarkably upregulated in HSCs of      mation during MS, the source and origin of these hematogenous
2D2 mice (Figures 6C and 6D). Increases of CCL5-expressing         cells remain unknown. This study assigns to the bone marrow a
CD4+ T cells and CCR5-expressing HSCs were also observed           previously unrecognized role, as a facilitator governing the prop-
in the bone marrow of wild-type EAE mice (Figures S6C and          agation of CNS inflammation and autoimmune injury. Single-cell
S6D). In addition, an increase of CCL5-expressing T cells and      analysis of bone marrow biopsy samples acquired from the treat-
CCR5-expressing HSCs was found in the bone marrow of MS            ment of naive patients with active MS unexpectedly revealed
patients (Figure 6E). Importantly, genetic knockdown of CCL5       increased myelopoiesis but not lymphopoiesis of HSPCs, result-
ablated 2D2 T cell-induced bone marrow myelopoiesis,               ing in the dramatically augmented production of myeloid cells
following passive transfer into Rag2/ recipients (Figures 6F–    accompanied with clonal expansion of T cells. To gain mecha-
6I). These results suggest that the augmentation of bone marrow    nistic insights into these patient-derived findings, we performed
myelopoiesis involves the CCL5-CCR5 axis.                          a comprehensive investigation by coupling experiments in EAE
                                                                   mice to reveal the bone marrow as a preferential homing site
Disruption of the bone marrow CCL5-CCR5 axis reduces               for autoreactive T cells, which in turn augment myelopoiesis
myelopoiesis and neuroinflammation                                 involving the CCL5-CCR5 axis. Lineage tracing revealed that
To assess whether disruption of bone marrow CCL5-CCR5 axis         myelopoiesis led to an increase of bone marrow myeloid cells
affects EAE pathology, we utilized bone marrow chimeric mice       that can invade the CNS and accelerate CNS inflammatory injury,

2242 Cell 185, 2234–2247, June 23, 2022
ll
Article OPEN ACCESS
Figure 6. Myelin-reactive T cells skew bone marrow HSCs toward myeloid cellular lineages involving CCL5-CCR5 axis
(A) Heatmap showing immune factors expressed in 2D2 CD4+ T cells sorted from femur bone marrow of naive 2D2 mice. CD4+ T cells sorted from bone marrow of
naive wild-type mice were used as control. Heatmap shows the Z scores of indicated factors. n = 3 per group. Each sample results from pooled cells of 3 mice.
Data are representative of two independent experiments.
(B) Flow cytometry analysis of CCL5 expression in CD4+ T cells of bone marrow, spleen, and lymph nodes from 2D2 mice or wild-type mice. n = 6 per group. Data
are representative of two independent experiments.
(C) Transcriptome profile of HSCs (LinSca-1+c-Kit+CD48CD150+) sorted from femur bone marrow of 2D2 mice and wild-type mice, heatmap shows the Z score
of top changed genes. n = 4 per group. Each sample results from pooled HSCs of 5 mice.
(D) Flow cytometry plots and bar graph showing upregulation of CCR5 in bone marrow HSCs from groups of 2D2 or wild-type mice. n = 5 in wild-type group. n = 6
in 2D2 group. Data are representative of two independent experiments.
(E) Single-cell RNA sequencing analysis revealed increased frequency of CCL5-expressing T cells and CCR5-expressing HSCs in bone marrow of MS patients
versus controls. n = 7 per group.
(F–I) Splenic CD4+ T cells from 2D2 mice were subjected to in vitro siRNA knockdown of CCL5. Splenic CD4+ T cells exposed to control siRNA were used as
control. 2 3 106 CD4+ T cells were i.v. injected into recipient Rag2/ mice.
(F) Bone marrow cells were collected from Rag2/ recipient mice at day 7 after recieving indicated groups of 2D2 T cells.
(G) Flow cytometry analysis of CCL5 expression in CD4+ T cells after siRNA treatment (n = 4 per group).
(H) Frequency of transferred 2D2 T cells (CD3+CD4+CD25Vb11+) in bone marrow of recipient mice (n = 4 per group).
(I) Counts of HSCs, GMPs, MDPs, neutrophils, and Ly6Chigh monocytes in recipient mice. n = 6 per group. In (G)–(I), data are representative of two independent
experiments. Mean ± SEM. *p < 0.05, **p < 0.01; two-tailed unpaired Student’s t test (B, D, E, and G–I).
together with biased TCR Vb usage of CD4+ T cells in the femur ysis, we provide evidence that bone marrow HSPCs can sense
and CNS-surrounding bone marrow. Importantly, disruption of immune system activation and adapt by skewing HSCs toward
the CCL5-CCR5 axis suppressed bone marrow myelopoiesis, myeloid-cell lineages in patients with MS and mice with EAE.
neuroinflammation, and neurological deficits. As for infectious diseases, augmented hematopoiesis of myeloid
Our findings demonstrate the bone marrow as an early cells is often beneficial for the elimination of pathogens. Here, in
responder, which actively participates CNS inflammatory injury the setting of CNS autoimmune diseases, newly generated neu-
in MS. Coupling single-cell sequencing and flow cytometry anal- trophils and monocytes are capable of propagating CNS
Cell 185, 2234–2247, June 23, 2022 2243ll
OPEN ACCESS Article
Figure 7. Disruption of CCL5-CCR5 axis suppresses myelopoiesis, neuroinflammation, and neurological deficits
(A) Schematic diagram depicts experimental design. Lin cells were isolated from femur bone marrow of donor (CD45.2) CCR5+/+ or CCR5/ mice. 4 3 105 Lin
cells were then injected into femur bone marrow of recipient mice (CD45.1) that were subjected to sublethal irradiation. EAE was induced in bone marrow chimeric
mice by i.v. injection of 2 3 106 2D2 CD4+ T cells (CD3+CD4+CD25Vb11+). Flow cytometry analysis was conducted at day 14 after transfer.
(B) Flow cytometry analysis of CD45.2+ HSCs in bone marrow of the indicated groups of chimeric mice receiving 2D2 CD4+ T cells or naive wild-type CD4+ T cells
(CD3+CD4+CD25). Naive wild-type CD4+ T cells were used as a control. n = 6 per group. Data are representative of three independent experiments.
(C) Flow cytometry analysis of GMPs and MDPs in indicated groups of chimeric mice receiving 2D2 CD4+ T cells. n = 6 per group. Data are representative of three
independent experiments.
(D and E) Counts of CD45.2+ neutrophils and Ly6Chigh monocytes in bone marrow (D), brain, and spinal cord (E) of CCR5+/+ or CCR5/ Lin cell chimeric mice
receiving 2D2 CD4+ T cells. n = 6 per group. Data are representative of three independent experiments.
(F) Clinical scores of bone marrow chimeric mice receiving CCR5+/+Lin cells or CCR5/Lin cells followed by 2D2 CD4+ T cell injection. n = 8 per group. Data are
representative of three independent experiments.
(G) H&E and Luxol Fast blue staining of spinal cord tissue sections from the indicated groups. Graphs showing the counts of inflammatory infiltrates and per-
centage of demyelination. n = 6 per group. Scare bars, 500 mm. Data are representative of three independent experiments. Mean ± SEM. *p < 0.05, **p < 0.01;
two-tailed unpaired Student’s t test (B–E and G); two-way ANOVA followed by Bonferroni post hoc test (F).
inflammation during early disease development. Indeed, we ical homing site for these T cells. At the crossroads of blood and
observed enhanced myelopoiesis and output of myeloid cells immunity, bone marrow harbors a niche for hematopoietic cells
into CNS as early as day 6 in EAE mice. As such, these findings and mature immune cells (Di Rosa and Pabst, 2005; Li et al.,
assign a detrimental role to bone marrow myelopoiesis during 2007; Melenhorst et al., 2009). In particular, skull and vertebral
EAE development, and perhaps during MS initiation and bone marrow have been reported to supply immune cells to
progression. meningeal borders and contribute to immune homeostasis in
The finding that autoreactive T cells extensively migrate from the CNS (Brioschi et al., 2021; Cugurra et al., 2021; Herisson
blood into the bone marrow niche reveals bone marrow as a crit- et al., 2018; Mazzitelli et al., 2022). Indeed, we highlight the
2244 Cell 185, 2234–2247, June 23, 2022ll
Article OPEN ACCESS
homing of autoreactive T cells into both the remote femur and myelopoiesis is likely determined by the initiators modulating
CNS-surrounding bone marrow to induce myelopoiesis. A major bone marrow hematopoiesis.
role in the recruitment of these cell types has been attributed to Our findings have clinical relevance. First, myelopoiesis and its
the chemokine CXCL12, i.e., stromal cell-derived factor-1, which contribution to EAE development may open a therapeutic oppor-
is highly expressed by sinusoidal endothelial cells within the tunity to treat MS. As the bone marrow is the site for both mye-
bone marrow. CXCL12 binds to its receptor CXCR4 and leads lopoiesis and lymphopoiesis, it is possible to reset and correct
to attraction of target cells to the bone marrow (Di Rosa and the aberrant immune response leading to MS, for example, via
Pabst, 2005). In EAE mice, we provide evidence that the autologous HSC transplant (Miller et al., 2021; Muraro et al.,
CXCL12-CXCR4 axis is required for autoreactive (2D2) T cells 2017). Second, bone marrow-residing autoreactive T cells
to migrate into the bone marrow. Although the anatomical orga- potentiated myelopoiesis involving the CCL5-CCR5 axis. These
nization in which T cells are localized in bone marrow and the findings also extend the current understanding of autoreactive
cellular components producing CXCL12 in the setting of EAE T cells within lymph organs and CNS into bone marrow. Restric-
remain to be examined, the identification of bone marrow as a tion of autoreactive T cell migration toward the bone marrow may
preferential homing site for autoreactive T cells sets the stage suppress detrimental myelopoiesis in MS. Third, many immune-
for future studies to better understand this role in the develop- suppressant drugs, such as methotrexate and azathioprine, can
ment of CNS autoimmunity and inflammation. suppress myelopoiesis and cause neutropenia. Although myelo-
The finding that autoreactive T cells modulate hematopoiesis suppression is considered a major side effect for these cytotoxic
assigns a role for bone marrow-residing T cells in MS and EAE. chemotherapies, it is tempting to speculate that reduced myelo-
Under physiological conditions, the activity of HSCs and down- poiesis may potentially contribute to the benefit of immune-
stream progenitors are tightly controlled by bone marrow niche suppressing drugs, a topic is currently under investigation by
factors to provide a balanced output of myeloid cells versus lym- our group.
phocytes. In this study, we found that bone marrow-residing 2D2
T cells represents a major source of CCL5, which promotes mye- Limitations of the study
lopoiesis during EAE development. The augmented hematopoi- The major finding of this work highlights that enhanced bone
etic production of inflammatory neutrophils and monocytes con- marrow myelopoiesis contributes to CNS inflammation and
tributes to CNS inflammation and disease progression. Notably, demyelination. The precise mechanisms for T cell clonal expan-
we also found clonal expansion of T cells in the bone marrow of sion and biased TCR Vb usage following myelopoiesis in the
MS patients, suggesting a potential impact of myelopoiesis on bone marrow niche requires further investigation. In addition,
autoreactive T cell activity within the bone marrow niche. The conclusive evidence for the relative contributions to CNS inflam-
current understanding of autoreactive T cells in MS pathogen- matory injury from CNS-surrounding bone marrow versus femur
esis is primarily focused on their expansion in lymphoid organs bone marrow has not been generated from the current study.
and penetration into the CNS. Our findings unveil the bone Further, the association between aberrant HSPC activity and
marrow as a previously unrecognized site which fosters the inti- MS disease activity has not been examined. Similar approaches
mate interactions between autoreactive T cells and hematopoi- are needed to investigate bone marrow activities from different
etic cells. stages of MS and for MS patients receiving immune therapies.
HSPCs in the bone marrow can rapidly sense immune sys- Although we identified that an FDA-approved CCR5 antagonist,
tem activation and adapt by producing new cells. MS is driven maraviroc, suppresses myelopoiesis and EAE pathology, the
by a coordinated mobilization of innate and adaptive immunity. precise contribution regarding myelopoiesis to its benefit on
This study illustrates detrimental effects of bone marrow mye- EAE pathology awaits future studies. Overcoming these limita-
lopoiesis, orchestrated by autoreactive T cells, in the setting tions may provide a target for treatment of MS and other autoim-
of CNS inflammation and autoimmunity. Unlike this study, our mune disorders.
previous research revealed that acute brain injury such as intra-
cerebral hemorrhage skews bone marrow HSCs toward the STAR+METHODS
myeloid-cell lineage, leading to increased production of
Ly6Clow patrolling monocytes, which in turn transmigrate into Detailed methods are provided in the online version of this paper
the injured brain and reduce neuroinflammation (Shi et al., and include the following:
2021). The self-protective effects of bone marrow myelopoiesis
was switched on by an abrupt activation of adrenergic innerva- d KEY RESOURCES TABLE
tions following acute brain injury (Shi et al., 2021), which under- d RESOURCE AVAILABILITY
scores a dynamic interaction between lineage development in B Lead contact
hematopoiesis and adrenergic activation following acute injury B Materials availability
to brain or other peripheral organs (Grisk, 2020; Meisel et al., B Data and code availability
2005), leading to the release of noradrenaline from sympathetic d EXPERIMENTAL MODEL AND SUBJECT DETAILS
nerve terminals that targets b3-adrenergic receptors within the B Human bone marrow samples
bone marrow microenvironment. Here we report that bone B Animals
marrow hematopoiesis is rewired toward myeloid lineages by d METHOD DETAILS
autoreactive T cells homing to bone marrow, suggesting that B Single-cell sequencing
the pro- or anti-inflammatory consequence of bone marrow B Bone marrow chimeric mice
Cell 185, 2234–2247, June 23, 2022 2245ll
OPEN ACCESS Article
B Induction and evaluation of EAE Di Rosa, F., and Pabst, R. (2005). The bone marrow: a nest for migratory mem-
B Flow cytometry ory T cells. Trends Immunol. 26, 360–366.
B BrdU incorporation essay Dong, Y., and Yong, V.W. (2019). When encephalitogenic T cells collaborate
B RT-PCR with microglia in multiple sclerosis. Nat. Rev. Neurol. 15, 704–717.
18 Goverman, J. (2009). Autoimmune T cell responses in the central nervous sys-
B F-FDG PET-CT imaging
B Drug administration tem. Nat. Rev. Immunol. 9, 393–407.
B Cytokine array analysis Grisk, O. (2020). The sympathetic nervous system in acute kidney injury. Acta
physiol. (Oxf) 228, e13404.
B Nanostring transcriptome sequencing
Hasselbalch, I.C., Søndergaard, H.B., Koch-Henriksen, N., Olsson, A., Ullum,
B Genetic knockdown of CCL5 and CXCR4
H., Sellebjerg, F., and Oturai, A.B. (2018). The neutrophil-to-lymphocyte ratio is
B Histology assessment
associated with multiple sclerosis. Mult. Scler. J. Exp. Transl. Clin. 4.
d QUANTIFICATION AND STATISTICAL ANALYSIS 2055217318813183. https://doi.org/10.1177/2055217318813183.
Herisson, F., Frodermann, V., Courties, G., Rohde, D., Sun, Y., Vandoorne, K.,
SUPPLEMENTAL INFORMATION Wojtkiewicz, G.R., Masson, G.S., Vinegoni, C., Kim, J., et al. (2018). Direct
vascular channels connect skull bone marrow and the brain surface enabling
Supplemental information can be found online at https://doi.org/10.1016/j.cell. myeloid cell migration. Nat. Neurosci. 21, 1209–1217.
2022.05.020.
Hohlfeld, R., Dornmair, K., Meinl, E., and Wekerle, H. (2016). The search for the
target antigens of multiple sclerosis, part 1: autoreactive CD4+ T lymphocytes
ACKNOWLEDGMENTS as pathogenic effectors and therapeutic targets. Lancet Neurol. 15, 198–209.
Janssen, W.J., Bratton, D.L., Jakubzick, C.V., and Henson, P.M. (2016).
The authors thank Drs. Y.-T. Ma, H.-B. Wang, W.-N. Jin, N. Cheng, and mem-
Myeloid cell turnover and clearance. Microbiol. Spec. 4, 1–24. https://doi.
bers of Jing-Jin Center of Neuroimmunology for patient recruitment and labo-
org/10.1128/microbiolspec.MCHD-0005-2015.
ratory assistance. The authors also thank Dr. S.-X. Shi for editorial input. This
study was supported in part by National Key Research and Development Proj- Jin, W.N., Shi, K., He, W., Sun, J.H., Van Kaer, L., Shi, F.D., and Liu, Q. (2021).
ect of Stem Cell and Transformation Research (2019YFA0112100), National Neuroblast senescence in the aged brain augments natural killer cell cytotox-
Key Research and Development Project of China (2021ZD0202400), National icity leading to impaired neurogenesis and cognition. Nat. Neurosci. 24, 61–73.
Science Foundation of China (81830038, 91949208, 82171284, 82101364, Kawakami, N., Lassmann, S., Li, Z., Odoardi, F., Ritter, T., Ziemssen, T., Klin-
82101373), and Tianjin Key Medical Discipline (Specialty) Construction kert, W.E., Ellwart, J.W., Bradl, M., Krivacic, K., et al. (2004). The activation sta-
Project. tus of neuroantigen-specific T cells in the target organ determines the clinical
outcome of autoimmune encephalomyelitis. J. Exp. Med. 199, 185–197.
AUTHOR CONTRIBUTIONS Korsunsky, I., Millard, N., Fan, J., Slowikowski, K., Zhang, F., Wei, K., Ba-
glaenko, Y., Brenner, M., Loh, P.R., and Raychaudhuri, S. (2019). Fast, sensi-
Q.L. and F.-D.S. formulated the concept and designed the studies. F.-D.S., tive and accurate integration of single-cell data with Harmony. Nat. Methods
T.C., and Z.R. recruited the patients. K.S., H.L., Y.K., C.Q., R.L., H.H., Z.R., 16, 1289–1296.
and T.C. performed the experiments. K.S., H.L., Y.K., R.L., Z.Z., and P.Z. Kouwenhoven, M., Teleshova, N., Ozenci, V., Press, R., and Link, H.
analyzed the results. K.S., W.H., T.C., J.Z., F.-D.S., and Q.L. interpreted the re- (2001). Monocytes in multiple sclerosis: phenotype and cytokine profile.
sults. K.S., F.-D.S., and Q.L. wrote and edited the manuscript. J. Neuroimmunol. 112, 197–205.
Leuschner, F., Rauch, P.J., Ueno, T., Gorbatov, R., Marinelli, B., Lee, W.W.,
DECLARATION OF INTERESTS
Dutta, P., Wei, Y., Robbins, C., Iwamoto, Y., et al. (2012). Rapid monocyte ki-
netics in acute myocardial infarction are sustained by extramedullary monocy-
The authors declare no competing interests.
topoiesis. J. Exp. Med. 209, 123–137.
Li, R., Perez, N., Karumuthil-Melethil, S., and Vasu, C. (2007). Bone marrow is a
Received: January 4, 2022
preferential homing site for autoreactive T-cells in type 1 diabetes. Diabetes
Revised: May 1, 2022
56, 2251–2259.
Accepted: May 23, 2022
Published: June 15, 2022 Li, Z., Li, M., Shi, S.X., Yao, N., Cheng, X., Guo, A., Zhu, Z., Zhang, X., and Liu,
Q. (2020). Brain transforms natural killer cells that exacerbate brain edema af-
REFERENCES ter intracerebral hemorrhage. J. Exp. Med. 217, e20200213.
Liu, Q., Jin, W.N., Liu, Y., Shi, K., Sun, H., Zhang, F., Zhang, C., Gonzales, R.J.,
Bar-Or, A., and Li, R. (2021). Cellular immunology of relapsing multiple scle- Sheth, K.N., La Cava, A., et al. (2017). Brain ischemia suppresses immunity in
rosis: interactions, checks, and balances. Lancet Neurol. 20, 470–483. the periphery and brain via different neurogenic innervations. Immunity 46,
Boettcher, S., and Manz, M.G. (2017). Regulation of inflammation- and infec- 474–487.
tion-driven hematopoiesis. Trends Immunol. 38, 345–357. Liu, Q., Sanai, N., Jin, W.N., La Cava, A., Van Kaer, L., and Shi, F.D. (2016).
Brioschi, S., Wang, W.L., Peng, V., Wang, M., Shchukina, I., Greenberg, Z.J., Neural stem cells sustain natural killer cells that dictate recovery from brain
Bando, J.K., Jaeger, N., Czepielewski, R.S., Swain, A., et al. (2021). Heteroge- inflammation. Nat. Neurosci. 19, 243–252.
neity of meningeal B cells reveals a lymphopoietic niche at the CNS borders. Louveau, A., Da Mesquita, S., and Kipnis, J. (2016). Lymphatics in neurological
Science 373, eabf9277. disorders: a neuro-Lympho-vascular component of multiple sclerosis and Alz-
Chapple, R.H., Tseng, Y.J., Hu, T., Kitano, A., Takeichi, M., Hoegenauer, K.A., heimer’s disease? Neuron 91, 957–973.
and Nakada, D. (2018). Lineage tracing of murine adult hematopoietic stem Mazzitelli, J.A., Smyth, L.C.D., Cross, K.A., Dykstra, T., Sun, J., Du, S., Mamu-
cells reveals active contribution to steady-state hematopoiesis. Blood Adv. ladze, T., Smirnov, I., Rustenhoven, J., and Kipnis, J. (2022). Cerebrospinal
2, 1220–1228. fluid regulates skull bone marrow niches via direct access through dural chan-
Cugurra, A., Mamuladze, T., Rustenhoven, J., Dykstra, T., Beroshvili, G., nels. Nat. Neurosci. 25, 555–560.
Greenberg, Z.J., Baker, W., Papadopoulos, Z., Drieu, A., Blackburn, S., et al. Meisel, C., Schwab, J.M., Prass, K., Meisel, A., and Dirnagl, U. (2005). Central
(2021). Skull and vertebral bone marrow are myeloid cell reservoirs for the nervous system injury-induced immune deficiency syndrome. Nat. Rev. Neu-
meninges and CNS parenchyma. Science 373, eabf7844. rosci. 6, 775–786.
2246 Cell 185, 2234–2247, June 23, 2022ll
Article OPEN ACCESS
Melenhorst, J.J., Scheinberg, P., Chattopadhyay, P.K., Gostick, E., Ladell, K., Reder, A.T., Genç, K., Byskosh, P.V., and Porrini, A.M. (1998). Monocyte acti-
Roederer, M., Hensel, N.F., Douek, D.C., Barrett, A.J., and Price, D.A. (2009). vation in multiple sclerosis. Mult. Scler. 4, 162–168.
High avidity myeloid leukemia-associated antigen-specific CD8+ T cells pref-
erentially reside in the bone marrow. Blood 113, 2238–2244. Rumble, J.M., Huber, A.K., Krishnamoorthy, G., Srinivasan, A., Giles, D.A.,
Zhang, X., Wang, L., and Segal, B.M. (2015). Neutrophil-related factors as bio-
Miller, A.E., Chitnis, T., Cohen, B.A., Costello, K., Sicotte, N.L., and Stacom, R.;
markers in EAE and MS. J. Exp. Med. 212, 23–35.
National Medical Advisory Committee of the National Multiple Sclerosis Soci-
ety (2021). Autologous hematopoietic stem cell transplant in multiple sclerosis: Shi, S.X., Shi, K., and Liu, Q. (2021). Brain injury instructs bone marrow cellular
recommendations of the National Multiple Sclerosis Society. JAMA Neurol. 78, lineage destination to reduce neuroinflammation. Sci. Transl. Med. 13,
241–246. eabc7029.
Moser, T., Akgün, K., Proschmann, U., Sellner, J., and Ziemssen, T. (2020). The
role of TH17 cells in multiple sclerosis: therapeutic implications. Autoimmun. Stuart, T., Butler, A., Hoffman, P., Hafemeister, C., Papalexi, E., Mauck, W.M.,
Rev. 19, 102647. 3rd, Hao, Y., Stoeckius, M., Smibert, P., and Satija, R. (2019). Comprehensive
integration of single-cell data. Cell 177, 1888–1902.e21.
Muraro, P.A., Martin, R., Mancardi, G.L., Nicholas, R., Sormani, M.P., and Sac-
cardi, R. (2017). Autologous haematopoietic stem cell transplantation for treat- Thompson, A.J., Baranzini, S.E., Geurts, J., Hemmer, B., and Ciccarelli, O.
ment of multiple sclerosis. Nat. Rev. Neurol. 13, 391–405. (2018). Multiple sclerosis. Lancet 391, 1622–1636.
Naegele, M., Tillack, K., Reinhardt, S., Schippling, S., Martin, R., and Sospe-
dra, M. (2012). Neutrophils in multiple sclerosis are characterized by a primed Wang, X., Wen, Y., Xie, X., Liu, Y., Tan, X., Cai, Q., Zhang, Y., Cheng, L., Xu, G.,
phenotype. J. Neuroimmunol. 242, 60–71. Zhang, S., et al. (2021). Dysregulated hematopoiesis in bone marrow marks
severe COVID-19. Cell Discov. 7, 60.
Nylander, A., and Hafler, D.A. (2012). Multiple sclerosis. J. Clin. Invest. 122,
1180–1188. Xie, X., Liu, M., Zhang, Y., Wang, B., Zhu, C., Wang, C., Li, Q., Huo, Y., Guo, J.,
Ransohoff, R.M., Hafler, D.A., and Lucchinetti, C.F. (2015). Multiple sclerosis-a Xu, C., et al. (2021). Single-cell transcriptomic landscape of human blood cells.
quiet revolution. Nat. Rev. Neurol. 11, 134–142. Natl. Sci. Rev. 8, nwaa180.
Cell 185, 2234–2247, June 23, 2022 2247You can also read