Global Market Assessment for Electric Cooking - Modern ...
←
→
Page content transcription
If your browser does not render page correctly, please read the page content below
Global Market Assessment for
                       Electric Cooking

  Will Coley, Aran Eales, Simon Batchelor, Jon Leary, Stuart Galloway
                                     University of Strathclyde

                                                 May 2021

MECS is funded by UK Aid through the Foreign, Commonwealth, and Development Office. It is a partnership
between researchers, innovators, policy makers, and ESMAP drawing on their expertise and relevant work from
around the world to co-construct new knowledge with practitioners and the private sector. It is led by Loughborough
University, UK. The views expressed do not necessarily reflect the UK government’s official policies.

                                                                                                                 1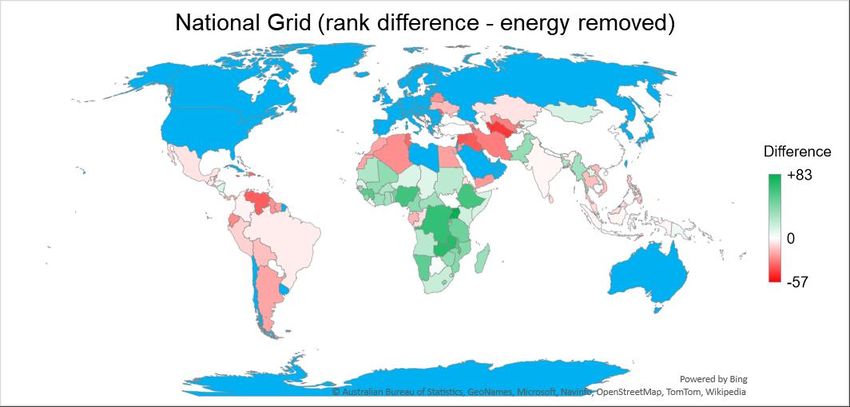
www.mecs.org.uk

Executive Summary
Globally, approximately 2 billion people have access to some form of electricity but do not have access to clean cooking,
the majority of which rely on the traditional use of biomass. Cooking with biomass leads to an estimated 3.8 million
deaths per year attributed to household air pollution. The widespread practise of cooking with non-renewable wood fuels
also contributes to ecosystem degradation and the emission of approximately 1 gigaton of CO2/year (2% of global
emissions total). According to the State of Access to Modern Energy Cooking Services report by the World Bank, ESMAP
and MECS, not progressing beyond the status quo is costing the world more than US$2 trillion each year; US$ 1.4 trillion
from the negative impacts on health, US$ 0.2 trillion per year from climate impacts and environmental degradation and
US$ 0.8 trillion per year from its adverse effects specifically on women.

A growing body of evidence is showing that, in many settings, modern energy cooking services such as electric cooking
are already cost-effective alternatives. For many countries in the Global South with a strong enabling environment
(including having access to affordable, reliable electricity and the presence of a strong, active modern cooking sector) a
transition to electric cooking is already taking place, mainly among the consumer class. For other countries where many
households have limited or no access to modern energy, a suite of innovative business models and technologies are
rapidly expanding opportunities to transition to electric cooking via mini-grid and off-grid systems.

To understand where the greatest opportunities and challenges for a scale up of electric cooking in the Global South lie,
a Global Market Assessment (GMA) for electric cooking has been conducted by the Modern Energy Cooking Services
(MECS) programme which seeks to “to rapidly accelerate the transition from biomass to clean cooking on a global scale”.
The GMA has drawn on the experience of a range of stakeholders to identify the key factors which influence the viability
of a scale up of electric cooking and represents this as a weighted score constructed from 37 indicators covering 130
countries in the Global South. As electric cooking relies on a electricity which can now be supplied in a variety of different
ways, the GMA provides a score for national grid, mini-grid1 and off-grid (standalone)1 supported electric cooking.

Overall findings
Energy infrastructure and human development are key enabling factors for scaling up electric cooking. There
are groups of key indicators which enable a strong GMA score and which are broadly similar across national grid, mini-
grid and off-grid scenarios: “energy” enablers have a particularly strong effect on GMA score (including indicators on the
strength of electricity infrastructure and clean cooking market), as do “development” enablers but to a lesser extent
(including human development, gender inequality, ICT adoption, logistics and business indices). For all scenarios, the
regulatory environment was also an enabler, while for the mini-grid and off-grid scenarios the market size and strength
for these technologies were enablers, as well as aid and renewable energy finance flows.

There are a number of countries where a scale up of electric cooking is both viable and urgently needed.
Comparing countries with high GMA scores, for one or more of the scenarios, and those with large proportions of people
likely to already be paying significant amounts for polluting fuels (such as kerosene and charcoal) highlights China,
Malaysia, Thailand, Laos, Kenya, Myanmar, Philippines, Nigeria, Tanzania, Uganda and Rwanda. Having high GMA
scores and the presence of large numbers of people paying for polluting fuels suggests that pivoting to electric cooking
could be both viable and affordable in these countries. With high GMA scores and very large absolute numbers of people
paying for polluting cooking fuels, China and Nigeria amongst others present opportunities for transition on a huge scale.

Many countries have high GMA scores and the need to transition but ability to pay may be a challenge, as many
people cook using cheap or freely gathered fuels (e.g. firewood, or waste from animals or crops). Countries with
high GMA scores and many people cooking with these commonly collected fuels include China, India, Laos, Bangladesh,
Nepal, Kenya, Myanmar, Afghanistan, Vietnam, Nigeria, Serbia, Uganda, Sri Lanka, Rwanda and the Philippines. These
countries have large proportions of their populations in need of a transition but likely to have lower expenditures on
cooking fuels and therefore less ability to pay for modern energy cooking services. The GMA also highlights India, China,
Nigeria and Bangladesh amongst others which have huge absolute numbers cooking with cheap or freely gathered
polluting fuels as well as strong GMA scores.

1In this report “mini-grid” and “off-grid (standalone)” refer to renewables powered systems (e.g. hydro mini-grids, solar
home systems) only; non-renewable sources (e.g. diesel generators) are excluded from these terms.
                                                                                                                            2
www.mecs.org.uk

In many cases a scale up of electric cooking on the national grid needs to be coupled with decarbonisation of
generation infrastructure. Many high scoring countries have relatively low renewable energy shares and as such need
to couple a transition to electric cooking with decarbonisation of their generation infrastructure. This means that for a
transition to electric cooking to have the most positive impact in terms of reducing air pollution and CO2 emissions, it
needs to be supported by increased investment in and focus on renewable electricity generation which is already often
cheaper than generation from fossil fuels. On this basis, Kenya has particularly strong potential for a transition to electric
cooking, with strong GMA score, 89% renewable grid electricity and high proportions of its population paying for polluting
fuels for cooking (others include Laos, Honduras, Montenegro, Guatemala and Ghana). Conversely, other high scoring
countries with significant proportions using polluting fuels have carbon intensive grids; these include China (28%
renewable), Malaysia (18%), India (21%), Thailand (19%) and Vietnam (28%), and so need to couple a transition to
electric cooking on the national grid with significant efforts to decarbonise generation.

The GMA calculates the viability of scale up of national grid, mini-grid and off-grid (standalone) supported electric
cooking. The following sub-sections summarise these results, which are also represented as “maps”, and followed by
conclusions, methodology, limitations and further resources.

National grid enabled potential for scale up of electric cooking
The GMA score for the viability of scale up of national grid supported electric cooking (see figure below) is highest for
countries with the highest levels of “development”; also described as “emerging markets”, with strong electrical
infrastructure and clean cooking fuel markets where large proportions of people are already using modern cooking fuels
(including LPG and electricity). These include China, Turkey, Colombia, Brazil, Indonesia, Malaysia, Mexico, India,
Thailand and Argentina. A number of other countries such as Costa Rica, Georgia, Panama, Laos, Paraguay, Serbia
and Kenya also have strong viability for scale up on the national grid. Despite many high scoring countries having strong
clean cooking markets and electrical infrastructure, some of these still have large numbers of people doing some, or all
their cooking with polluting fuels. Through comparing national grid GMA scores and the proportion of people cooking
with biomass, the top countries with not only an opportunity but also a need for scaled up transition on national grids
can be shortlisted to include China, Malaysia, India, Thailand, Laos, Serbia and Kenya. These countries are where
continued efforts to transition to electric cooking on the national grid is not only most viable, but also pressingly needed.

However, as previously mentioned, many high scoring countries for this scenario have relatively low renewable energy
shares. As such, to most effectively reduce air pollution and CO 2 emissions many countries need to couple a transition
to electric cooking with decarbonisation of their generation infrastructure.

                                                                                                         High score (dark blue)
                                                                                                              indicates stronger
                                                                                                         viability for scale up of
                                                                                                                 electric cooking.

                                                                                                                 GMA

                                                                                                                      Not
                                                                                                                      scored
                 +
                                       National grid supported electric cooking

                                                                                                                                     3
www.mecs.org.uk

The importance of mini-grids
For the mini-grids scenario, the viability of a scale up of electric cooking is again topped by emerging markets with strong
development indicators and electrical infrastructure including China, India, Indonesia, Peru, Malaysia, Thailand, Turkey,
South Africa and Argentina (see figure below). However, other countries with particularly strong mini-grid infrastructure
also perform well including Nepal, Bangladesh, Myanmar, Afghanistan, Nigeria and Tanzania. However, the accuracy
of the scores for the mini-grid scenario is restricted due to the available data on mini-grids only covering two thirds of
countries, lacking detail on energy access tier and fuels used for cooking specifically for those connected to mini-grids.

                                                                                                        High score (dark blue)
                                                                                                             indicates stronger
                                                                                                        viability for scale up of
                                                                                                                electric cooking.

                                                                                                                GMA

                                                                                                                     Not
                  +                                                                                                  scored

                                       Mini-grid supported electric cooking

Off-grid (standalone) electric cooking
The off-grid scenario also highlights India, Kenya, Bangladesh, Nigeria, China, Uganda, Indonesia, Sri Lanka, Nepal,
Rwanda, Malaysia and Tanzania as the highest scoring (see figure below), as they have strong off-grid renewables
sectors and consistent development indicators. Again, the accuracy of the scores for the off-grid scenario are particularly
affected by a lack of datasets on off-grid markets which adequately cover the Global South (currently available datasets
only cover half of the countries in this study).

                                                                                                        High score (dark blue)
                                                                                                             indicates stronger
                                                                                                        viability for scale up of
                                                                                                                electric cooking.

                                                                                                                GMA

                                                                                                                     Not
                  +                                                                                                  scored

                                       Off-grid (standalone) supported electric cooking

                                                                                                                                    4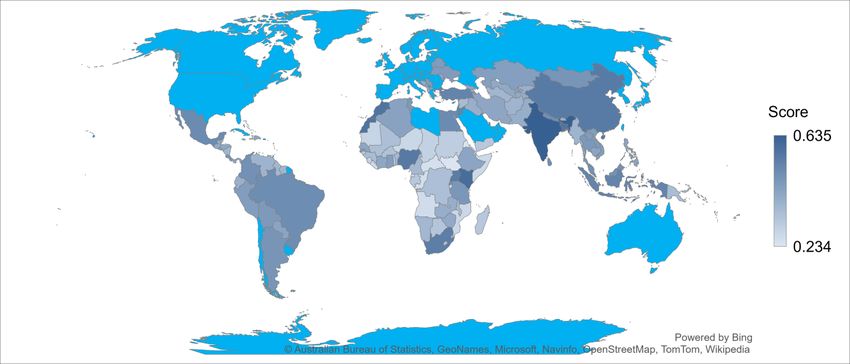
www.mecs.org.uk
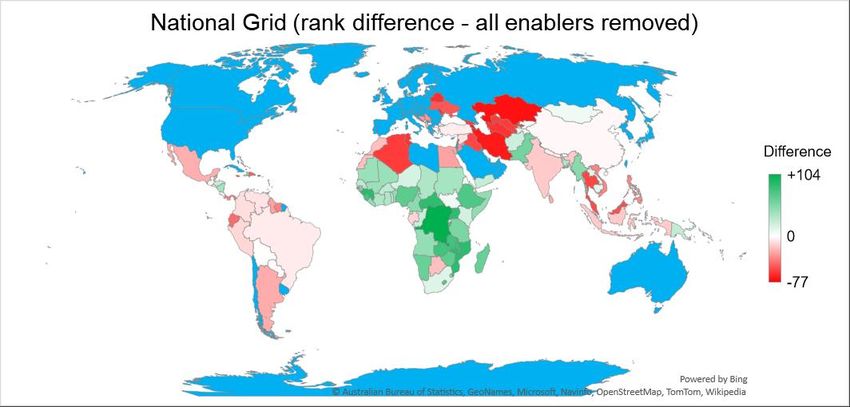
Enabling factors – energy infrastructure, human development and other key indicators
Comparing GMA scores with and without including the previously mentioned enabling indicators shows that the viability
of a scale up of electric cooking, particularly on the national grid, is most significantly restricted by having poor electricity
infrastructure and weak clean fuel markets, while lower levels of human development are also a hindrance but to a
lesser extent. This indicates that particularly improvements in electricity infrastructure (including access and reliability),
as well as growth in clean cooking markets, are strong catalysts for a scale up of electric cooking. Such improvements
could come through mini-grid or off-grid (standalone) technologies, or expansion and upgraded access to the national
grid. Almost by definition, those with large amounts of off-grid infrastructure, are countries where development indicators
are lacking. They often have large populations, the majority of which are using polluting fuels for cooking.
Improvements in energy (i.e. access and reliability) and human development (i.e. gender equality, Ease of Doing
Business, ICT/internet adoption) indicators are needed particularly in much of sub-Saharan Africa. For example, the
GMA analysis indicates that improvements in energy indicators would significantly improve the viability of scaling up
electric cooking in countries such as: Uganda, Zambia and Namibia (on national grids); Madagascar, Democratic
Republic of Congo and Niger (on mini-grids); Zambia and Malawi (on off-grid (standalone) systems).
However, some countries in sub-Saharan Africa already present strong potential for scale up of electric cooking for one
or more scenarios. Kenya is relatively less affected by the removal of enabling indicators for the national grid scenario,
while the same can be said for Nigeria and Tanzania for the mini-grid scenario (this affect is less prevalent for off-grid).
Conclusion
The GMA, perhaps unsurprisingly, highlights the role of energy infrastructure and human development indicators in
enabling a scale up of electric cooking. It draws attention to Asia (particularly China, India and Indonesia), which already
have many of these enabling factors in place and yet still have large parts of their populations using polluting fuels for
cooking. India for instance has made major gains over the last 5 years in its grid infrastructure which could enable a
more rapid scale up of modern energy cooking services among its poor. China and Indonesia have very strong electricity
infrastructure but still have large populations paying for polluting fuels. As the world necessarily decarbonises energy
systems, from household up to national scale, there is both a need to develop, and an opportunity to harness, enabling
factors in accelerating the transition to modern energy cooking services through greater uptake of electric cooking.
The last ten years have seen significant progress in pursuit of reaching SDG7 (ensure access to affordable, reliable,
sustainable and modern energy for all), including improvements in finance for off-grid electricity and upgraded access
to national grids. While clean cooking is sometimes considered a marginal issue, the political will for reaching SDG7
could be leveraged such that electrification planning includes cooking loads and supporting services, i.e. incorporating
innovative business models and enabling policies for on- and off-grid transitions to modern energy cooking services.
International Climate Finance (ICF) is likely to play an increasing role in the coming decade in enabling this transition.
As a UKAid-funded programme, MECS has focused on countries facing perhaps greater challenges regarding a
transition to modern energy cooking services; i.e. predominantly those in South Asia and sub-Saharan Africa. The GMA
finds that within these clusters there are some countries who have strong enabling factors that could be leveraged to
drive forward the adoption of electric cooking and create substantial development impact for low-income households
currently cooking with polluting fuels. For example: Kenya on national grids; Nepal, Bangladesh, Myanmar, Nigeria and
Tanzania on mini-grids; Kenya, Bangladesh, Nigeria, Uganda, Sri Lanka, Nepal, Rwanda and Tanzania on off-grid
(standalone) systems. Again unsurprisingly, the opportunities in these regions are comparatively greater for mini-grid
and off-grid supported electric cooking. With continued and accelerated progress towards the provision of energy access
for all, there are opportunities across all scenarios which will continue to grow; particularly throughout the coming decade
which the European Energy Centre, and others, have referred to as the “decade of renewables”.
Ultimately the GMA is indicative and prompts more contextual examination of current and developing policies, private
sector enabling environments and cooking cultures amongst other factors, to understand the possibilities around
addressing the enduring problem of cooking with biomass and its associated health, environmental and gender equity
challenges. The GMA highlights possibilities both now and in the coming decade for leveraging modern energy
infrastructure to accelerate the transition towards electric cooking and other modern energy cooking services.
5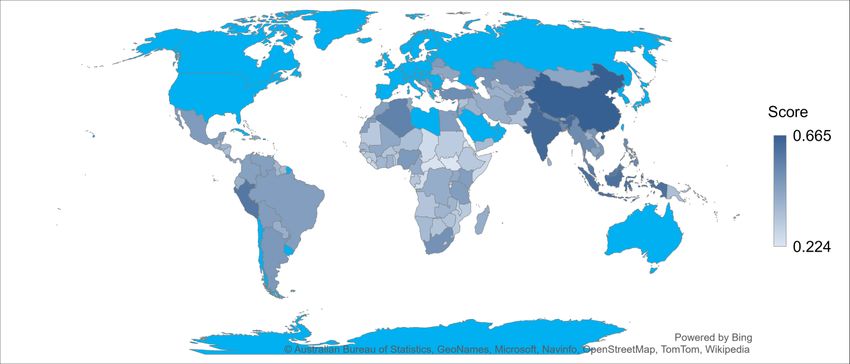
www.mecs.org.uk

Additional resources
In addition to this report, the GMA project has also produced two other outputs:
-    Online GMA visualisation tool (link TBC) – providing public access to the GMA data with the capability to manipulate
     and to display scores and rankings according to user needs (to be released).
-    Country fact sheets (link TBC) – detailing information as to the opportunities for, and barriers to, a scale up of
     electric cooking in a number of target countries (to be released).

Online visualisation tool                                       Country fact sheets

                                                                          Fact sheets image to be inserted

                                                                                                                       6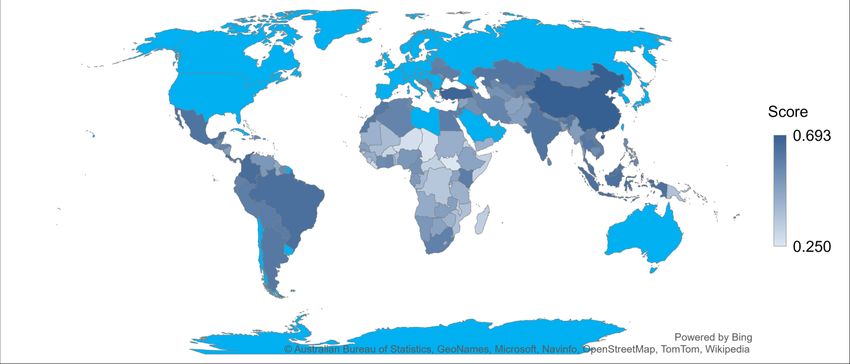
www.mecs.org.uk

Contents
1.   Background ............................................................................................................................. 8

2.   Methodology .......................................................................................................................... 10
     2.1. (Re)assessment of scope ......................................................................................................... 10
     2.2. Identification of factors and representative datasets ................................................................. 11
     2.3. Calculating indicator weightings................................................................................................ 12
     2.4. Data pre-processing ................................................................................................................. 14

3.   Limitations ............................................................................................................................. 17

4.   Results and Findings ............................................................................................................. 18
     4.1. National grid supported electric cooking ................................................................................... 18
     4.2. Mini-grid supported electric cooking.......................................................................................... 22
     4.3. Off-grid (standalone) supported electric cooking ....................................................................... 26
     4.4. All round high scoring countries ................................................................................................ 29

5.   Further analysis ..................................................................................................................... 31
     5.1. Correlation of indicators and GMA score .................................................................................. 32
     5.2. Enabling environment indicators ............................................................................................... 33
     5.3. Negatively correlated indicators ................................................................................................ 37

6.   Discussion ............................................................................................................................. 40

7.   Recommendations ................................................................................................................. 42

8.   References ............................................................................................................................ 43

9.   Appendices ............................................................................................................................ 45

                                                                                                                                                7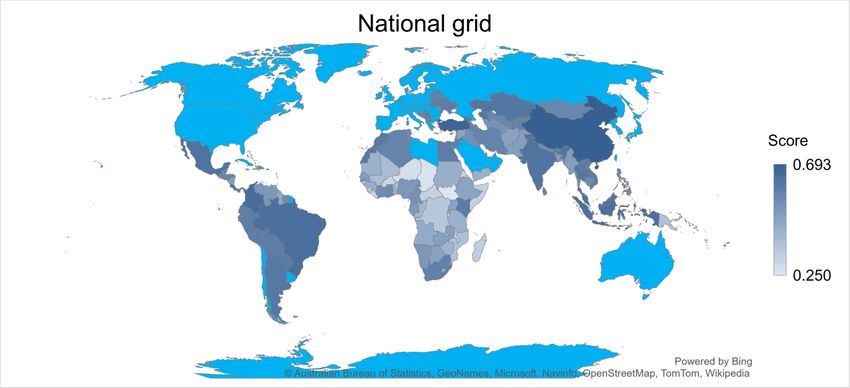
www.mecs.org.uk

1. Background
It is estimated that approximately 3 billion people globally are without access to clean cooking (the majority of which rely
on the traditional use of biomass of cooking) [1]. Meanwhile, just 770 million are now without access to electricity [2],
meaning that around 2 billion people have access to some form of electricity, but continue to cook with polluting fuels.
Furthermore, using the expanded definition of ‘modern energy cooking services’2 as many as 4 billion do not have access
to modern energy for cooking [3]. The widespread practice of cooking with non-renewable wood fuels also contributes
to ecosystem degradation and the emission of approximately 1 gigaton of CO 2/year (2% of global emissions total) [4] an
estimated 3.8 million deaths per year are attributed to smoke from cooking fires [5].

In some settings, using electric cooking appliances to cook with reliable grid electricity already offers a cost-effective
opportunity to enable clean cooking [6]. For people with unreliable electricity access, and those not connected to the
grid, a suite of new electric cooking technologies and business models is emerging to enable a transition away from
biomass fuels. To understand and prioritise the opportunities and challenges for accelerating access to electric cooking
in different countries, a global market assessment for electric cooking (GMA) was commissioned.

Market assessments aim to quantify the existing potential for the product or service to meet demand, and to identify the
opportunities and barriers to increasing this potential through understanding of both the enabling environment and the
aspirations, current practices, and characteristics of the consumers/target market. In the context of the MECS
programme, a market assessment aims to understand the enabling environment surrounding modern energy cooking
services and the needs and motivations of all involved stakeholders, including but not limited to end-users,
manufacturers, policymakers, development partners and energy system operators.

In 2017 a GMA was carried out as part of the preliminary stages of MECS research [7], with the intention of focusing
efforts in priority areas and to elaborate upon the problem statement to be addressed by the programme; “to rapidly
accelerate the transition from biomass to clean cooking on a global scale”. Official Development Assistance (ODA)
recipient countries’ favourability towards implementing grid-connected (battery supported) and standalone solar (battery
supported) electric cooking were considered through using a multi-criteria decision analysis (MCDA) methodology. This
provided a ranked list of countries, with their respective scores broken down by the contributing factors, along with a
more detailed analysis of the most favourable/highest ranking contexts as well as others with interesting market
dynamics which were not reflected in the ranked lists. The viability index was then complimented by estimates of market
size for key target market segments, such as the number of people living in rural, off-grid regions. These results were
used to direct intervention and to identify target countries for the current MECS programme.

Since the 2017 GMA the MECS programme has grown and developed into a large network of researchers and
practitioners conducting a variety of activities. A number of national and community scale activities, including market
assessments, have been conducted to better understand cooking in specific countries and regions and to direct future
MECS activities [8]. This process has improved the understanding of the factors which influence the viability of modern
energy cooking services in a variety of contexts and uncovered new target market segments not considered by the 2017
GMA. In addition, the cost of enabling technologies such as efficient, low-powered cooking devices, renewable energy
generation and energy storage are falling while their quality and availability is improving, and traditional cooking fuels
are becoming scarcer and more expensive. Concurrently, the political environment for such technologies is opening up
and renewable decentralised energy generation is increasing in popularity alongside other enabling social, cultural and
political factors. As such, the enabling environment for modern energy cooking services, offered through a widening
variety of product offerings, is changing across the globe. Therefore, by applying the enhanced knowledge and
experience of the MECS programme and drawing on the most recent information, an improved GMA has been
conducted to provide an up-to-date picture of the global environment for electric cooking.

This report provides a description of the GMA methodology, followed by a review of the results and additional information
on countries where a scale up of electric cooking is shown to be most viable. This is followed by further analysis to
identify the key factors which influence the viability of a scale up of electric cooking and the countries/regions where
these are strongest and weakest.

2   Defined as lacking “the ability to cook efficiently, cleanly, conveniently, reliably, safely, and affordably” [3].
                                                                                                                          8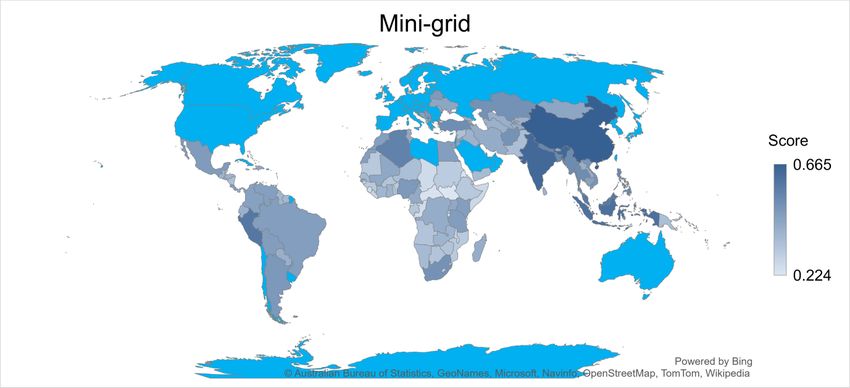
www.mecs.org.uk

Additional outputs
In addition, to effectively and quickly scale-up modern energy cooking services, stakeholders from a number of non-
academic sectors including the private (e.g. manufacturers, distributors, retailers, energy services), finance (e.g.
microfinance/carbon finance institutions) public and third sectors (e.g. policy makers, development organisations) need
to be aware of the drivers and opportunities and informed by accurate, up-to-date information. As such, two additional
outputs have been produced to broaden the reach of this study’s findings and provide improved accessibility to the
MECS programme’s growing body of context specific research:

-   Online GMA visualisation tool (link TBC)

This study has produced a huge quantitative dataset
containing a wealth of data pertinent to the aims of the
MECS programme that is now available in a single
location. Such a dataset presents the opportunity to
perform further analysis by all stakeholders (as well as
researchers) based on their needs and preferences.
Therefore, an online visualisation tool has been created to
provide anyone with the ability to manipulate the data
through an easy-to-use interface and display the results
as an attractive graphic. The source excel database
including the raw datasets is also available via the tool.
Screenshots of the online visualisation tool are shown in
Figure 1.

                                                                      Figure 1 - Online visualisation tool screenshots
-   Country fact sheets (link TBC)

While there was once a dearth of understanding of cooking practises and markets, MECS has developed an ever-
growing knowledge base around these topics, particularly for MECS focus countries. However, so far, outputs of these
activities have largely been aimed at academic audiences and used to inform the design of successive MECS activities.
Therefore, to communicate the results of the GMA more effectively, alongside context-specific information about the
opportunities and barriers for modern energy cooking services, detailed country “factsheets” have been created.

Insert screenshots when available

                                                                                                                         9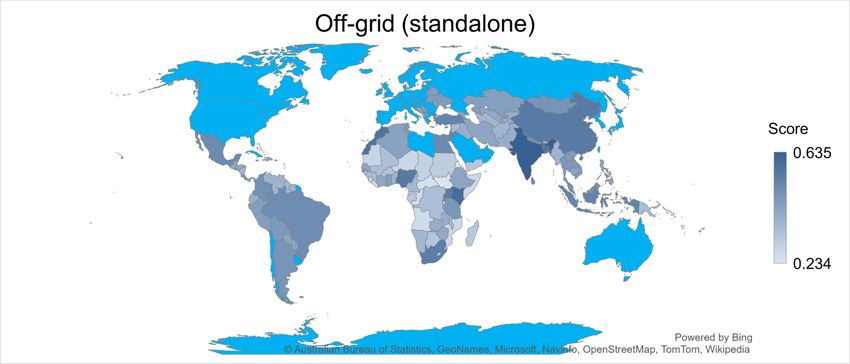
www.mecs.org.uk

2. Methodology
The methodology used to carry out this study draws on that used by Leary et. al [7] which centres around using publicly
available datasets to represent the viability of a scale up of electric cooking across the 130 countries on the Development
Assistance Committee (DAC) list of Official Development Assistance (ODA) recipients [9]. These datasets are collated
into a database of indicators, grouped into sub-categories and categories, weighted according to their relative
importance and summed to produce a score which represents the relative viability of a scale up of electric cooking3. This
methodology is detailed in the following sub-sections.

In addition, by drawing on the expertise of researchers and experts within and outside the MECS programme, a project
steering group was set up to oversee its direction and development. This steering group included representatives from
MECS, the World Bank Group’s Energy Sector Management Assistance Program (ESMAP) and the Clean Cooking
Alliance (CCA).

    2.1.         (Re)assessment of scope
Electric cooking at its most fundamental level relies on a supply of electricity which, particularly across the Global South,
is provided in a variety of different ways. The first iteration of the GMA focussed on two target market segments: “PV-
eCook… regions where no grid infrastructure exists (nor is it likely to in the near future), i.e. rural off-grid HHs” and “Grid-
eCook… the fringes of the grid, where the infrastructure is weakest, i.e. urban slums or rural grid-connected HHs”.

This study has included and supplemented these markets by expanding the Grid-eCook market to represent households
on both strong and weak grids4, and supplemented them by considering mini-grid supported electric cooking. In addition,
to emphasise the need for focus on context as well as technologies, these target markets were renamed as “national
grid”, “mini-grid” and “off-grid (standalone)” scenarios (shown in Figure 2). These terms refer to mini-grid and off-grid
(standalone) systems powered by renewable sources (e.g. hydro mini-grids, solar home systems) only; non-renewable
sources (e.g. diesel generators) are excluded.

                           +                   = National grid supported electric cooking

                           +                   = Mini-grid supported electric cooking

                           +                    = Off-grid (standalone) supported electric cooking

                                                   Figure 2 - GMA scenarios

3 There are numerous examples of this overall methodology is used in the construction of multidimensional indices,
including: ESMAP’s Regulatory Indicators for Sustainable Energy (RISE) [31], BloombergNEF’s Climatescope [32], and
the World Bank’s Ease of Doing Business Index [33].
4 Separate weak and strong grid scenarios were considered, but a lack of differentiating datasets meant little distinction

could be made between them. These were therefore combined into the “national grid” scenario.
                                                                                                                             10
www.mecs.org.uk
2.2. Identification of factors and representative datasets
Beyond the fundamental requirement of having access to electricity, the viability of a scale up of electric cooking is reliant
on a wide range of factors from spheres including the political, economic, social and technical. Using the first iteration
of the GMA as a starting point, a review of these viability-influencing factors was carried out by consulting with the project
steering group and a wide range of MECS researchers, MECS collaborating partners and contacts.
To represent as many of these factors within the GMA database as possible, a thorough review of publicly available
datasets was performed, identifying over 100 potential indicators from over 50 different sources. The criteria for inclusion
in the GMA database was based on importance (in representing the viability of electric cooking), coverage level (across
the 130 DAC listed countries) and availability of equivalent or better alternatives. Finally, these datasets were given
“indicator” names (describing the factor they represent) and grouped into sub-categories and categories. As shown
below in Table 1, the analysis for all three scenarios included 37 indicators 5, 18 sub-categories and four categories. The
sources for these indicators can be found in Appendix 1.
Table 1 – List of indicators, sub-categories and categories
Category Sub-category Indicator
Users of electric cooking
Clean fuel users Users of clean alternatives (e.g. LPG, biogas)
Users of commercialised polluting fuels (e.g. charcoal)
Unrealised potential for electric cooking
Fuel markets
ECONOMICS Affordability of electricity
Credit rating
Mobile money
Finance
OECD aid flows
Renewable energy finance flows
Solar resource Photovoltaic power potential
PHYSICAL
Deforestation Tree cover loss
Capacity ICT/internet adoption
Business Ease of Doing Business Index (EoDB)
Policy Regulatory Indicators for Sustainable Energy (RISE)
Health Household Air Pollution (HAP) attributable deaths
Gender Gender Inequality Index (GII)
HUMAN Demographics Urban population growth
Development Human Development Index (HDI)
Number of displaced persons (DPs)
DPs using clean cooking fuels (grid)
Displacement
DPs using clean cooking fuels (off-grid/mini-grid)
DPs with unrealised potential for electric cooking
Logistics Logistics Performance Index (LPI)
Manufacturing and imports Manufacturing, value added (% of GDP)
Access to electricity (all areas)
Access to electricity (urban)
Grid Electricity access projections (grid)
Renewable energy share
Grid reliability
Access to electricity (all areas)
Access to electricity (rural)
INFRASTRUCTURE
Electricity access projections (mini-grid)
Mini-grid
Off-grid renewables capacity (mini-grid)
Number of mini-grid developers
Number of people connected to mini-grids
Access to electricity (all areas)
Access to electricity (rural)
Off-grid Electricity access projections (off-grid)
Off-grid renewables capacity (standalone)
Off-grid lighting/appliance customers
5Table shows 40 indicators as two indicators appear more than once: access to electricity (rural) for both mini-grid and
off-grid scenarios, and access to electricity (all areas) for all three scenarios.
11www.mecs.org.uk
2.3. Calculating indicator weightings
To represent the extent to which the above indicators contribute to the viability of a scale up of electric cooking is
incorporated into the GMA, each indicator, sub-category and category is multiplied by a “weighting”. These weightings
represent their relative importance for each scenario while also considering the reliability and coverage of the indicators’
dataset; lower weightings given to indicators with less reliable data and/or poorer coverage. A group of key stakeholders,
including representatives from MECS, ESMAP, CCA and FCDO 6, was asked to provide these relative importances
through employing Multi-Criteria Decision Analysis (MCDA) techniques. These were gathered initially using the Delphi
method [10] and SMART technique [11] (via two rounds of anonymous questionnaires) and finally through a focus group
discussion. The process is summarised below:
a) As per Delphi method, blank questionnaire distributed to group members alongside training on how to complete
it. Anonymously, group members use the SMART technique to assign relative importance to indicators following
the below steps (also shown in Figure 3):
(1) Assign weight of 100 to most influential indicator in sub-category
(2) Weight each indicator against others in sub-category, repeat for all sub-categories
(3) Follow same process, weighting sub-categories within categories
(4) Follow same process, weighting categories against each other.
b) Responses collated and analysed. Condensed questionnaire re-distributed, highlighting indicators, sub-
categories, and categories with poor agreement or where that member’s responses vary significantly relative to
the rest of the group. Group members asked to revise weightings and/or provide comment or justification.
c) Focus group discussion held to agree, by consensus, on final weightings with particular focus on areas where
disagreement still present.
Figure 3 - Weighting process using SMART technique, highlighting the indicator weightings assigned to the Finance sub-category.
6 Two weightings groups were originally targeted, to represent: “impact” – highlighting where electric cooking could have
the greatest development impact; and “investment” – highlighting where electric cooking could present the most
attractive investment or business opportunity. However, due to difficulties in fostering interest from investment
stakeholders, the weighting process was only completed for the impact group.
12www.mecs.org.uk
An example of the relative importances gathered by the MCDA techniques and used for the national grid GMA scores
are shown in Table 2. These were used to calculate the final weightings for multiplication with the indicators using the
steps outlined in Table 3. The final weightings used in the study are represented in Figure 4.
Table 2 - Indicator, sub-category and category relative importances for national grid scenario
Category Wt. Sub-category Wt. Indicator Wt.
Users of electric cooking 100
Clean fuel users 90 Users of clean alternatives (e.g. LPG, biogas) 70
Users of commercialised polluting fuels (e.g. charcoal) 70
Unrealised potential for electric cooking 100
Fuel markets 100
ECONOMICS 90 Affordability of electricity 70
Credit rating 65
Mobile money 70
Finance 80
OECD aid flows 40
Renewable energy finance flows 100
Solar resource 50 Photovoltaic power potential 100
PHYSICAL 25
Deforestation 100 Tree cover loss 100
Capacity 45 ICT/internet adoption 100
Business 80 Ease of Doing Business Index (EoDB) 100
Policy 100 Regulatory Indicators for Sustainable Energy (RISE) 100
Health 85 Household Air Pollution (HAP) attributable deaths 100
Gender 50 Gender Inequality Index (GII) 100
HUMAN 80
Demographics 95 Urban population growth 100
Development 50 Human Development Index (HDI) 100
Number of displaced persons (DPs) 35
Displacement 25 DPs using clean cooking fuels (grid) 60
DPs using clean cooking fuels (off-grid/mini-grid) 100
Logistics 60 DPs with unrealised potential for electric cooking 100
Manufact. & imports 65 Logistics Performance Index (LPI) 100
Manufacturing, value added (% of GDP) 100
INFRASTRUCTURE 100 Access to electricity (all areas) 100
Grid 100 Access to electricity (urban) 80
Electricity access projections (grid) 75
Renewable energy share 70
Table 3 - Process for calculating indicator weightings from relative importances
Steps Example (grid scenario)
1) Relative importances are divided by the Users of electric cooking (importance fraction):
total of the importances in the sub- 100 / (100+70+70) = 0.416…
category/category/overall to calculate the
Clean fuel users (importance fraction):
“importance fraction”.
90 / (90+100+80) = 0.333…
Economics:
90 / (90+25+80+100) = 0.305…
2) These importance fractions are multiplied Users of electric cooking (adjusted fraction):
by the number of other importance 0.416… * 3 = 1.25…
fractions within the sub-category/category.
Clean fuel users (adjusted fraction):
0.333… * 3 = 1
Economics (adjusted fraction):
Remains unchanged (0.305…)
3) These fractions are multiplied together Users of electric cooking (unscaled weighting):
and scaled so that the total of all the 1.25… * 1 * 0.305… = 0.381
fractions is equal to one.
Users of electric cooking (final weighting):
0.381… / 8.04… = 0.0473…
13www.mecs.org.uk
Sub-category and category weightings
100% Logistics
Manufacturing & imports
90%
Grid
Mini-grid
80%
Off-grid
70% Capacity
Business
60% Policy
Weighting
Health
50%
Gender
Demographics
40%
Development
30% Displacement
Solar resource
20% Deforestation
Clean fuel users
10%
Fuel markets
Finance
0%
GRID MINI-GRID OFF-GRID
Figure 4 - Sub-category and category weightings
2.4. Data pre-processing
To calculate the score for all countries for each scenario, a weighted sum model requires a complete database without
any gaps. The first step towards achieving this was to remove countries with insufficient coverage by the indicators
(threshold set at 70%). As such, the initial list of 142 DAC listed countries was reduced to 130 7.
The second step was to apply upper and lower bounds to datasets. Upper bounds were set using the following criteria
(bounds used for all indicators shown in Appendix 2):
- If indicator is a percentage (e.g. % users of electric cooking), set upper bound at 100%
- If indicator is an index, upper bound set at theoretical limit (e.g. Logistics Performance Index limit = 5)
- If indicator has no theoretical limit, upper bound set at the global maximum value
o If indicator datapoint is identified as an outlier, upper bound set at 90th percentile.
7Removed countries: Wallis and Futuna, Saint Helena, Montserrat, Tokelau, Niue, West Bank and Gaza Strip, Kosovo,
North Korea, Tuvalu, Nauru, Libya, Cuba
14www.mecs.org.uk
An example dataset is shown in Figure 5 to show the effect of gaining greater detail through applying bounds.
Before bounds applied After bounds applied
90000 4500
GNI (per capita PPP) / Electricity price
GNI (per capita PPP) / Electricity price
80000 4000
70000 3500
60000 3000
50000 2500
40000 2000
30000 1500
20000 1000
10000 500
0 0
Datapoints in order of magnitude Datapoints in order of magnitude
Figure 5 - Effect of imposition of bounds on affordability of electricity indicator
The third data pre-processing step normalises the indicators; scaling the datapoints so that the minimum value is zero
and maximum value is one.
The final step before calculating country scores, fills all gaps in the GMA database using imputation. Although one of
the three criteria for indicators’ inclusion in the analysis was their level of global coverage, in some cases their importance
in representing the viability of a scale up of electric cooking and a lack of appropriate alternatives meant that some with
poor coverage were included (see section 2.4.2). In order to produce an accurate, but also complete database, two
imputation methods were used: imputation by regression, and imputation by grouping.
2.4.1. Imputation by regression
Indicators with inadequate coverage (less than 90% of countries with datapoints) were compared with all other indicators
in the database and selected additional datasets to find strong correlation. A polynomial fit using regression techniques
is undertaken to characterise the relationship between pairs of variables. The coefficient of determination8 is used to
quantify the variation between pairs of variables and this provides a value between 0 and 1 that provides a ‘goodness
of fit’ measure. Where strong enough correlation was found (R2 the coefficient of determination) takes a value at least
0.7 imputation by regression was used to fill gaps (using interpolation) and significantly improve global coverage. Table
4 shows the results of imputation by regression indicating coverage before and after, with source and proxy used for the
imputation. Figure 6 shows an example data set comparison before and after imputation.
Table 4 - Coverage, source and proxies for imputation of indicators by regression
Coverage
Indicator Source Proxy
Before After
Mobile money 72% 97% WB - Global Findex Database Broadband Subscriptions * GNI per capita
Gender Inequality Index (GII) 83% 99% UNDP - Gender Inequality Index HDI
DPs using clean fuels (grid) 73% 100% MEI - Refugees and Cooking Access to clean fuels %
DPs using clean fuels (off/mini grid) 73% 100% MEI - Refugees and Cooking Access to clean fuels % (rural)
DPs with unrealised potential for eCook 73% 97% MEI - Refugees and Cooking Access to electricity %
Logistics Performance Index (LPI) 81% 100% WB - Logistics Performance Index E-Government Participation Index * HDI
Electricity access projections (grid) 45% 100% GEP - Electrification Projections Access to electricity % * HDI
Grid reliability 65% 96% WB - Ease of Doing Business EoDB (Getting electricity score) * HDI
Electricity access projections (mini-grid) 45% 100% GEP - Electrification Projections Access to electricity % * HDI
Electricity access projections (off-grid) 45% 100% GEP - Electrification Projections Access to electricity * HDI
8 https://online.stat.psu.edu/stat462/node/95/
15www.mecs.org.uk
Pre-imputation R² = 0.7859 Post-imputation
90 90
Electricity access projections (off-grid)
Electricity access projections (off-grid)
Original data
80 80
Imputed data
70 70
60 60
50 50
40 40
30 30
20 20
10 10
0 0
0 20 40 60 80 0 20 40 60 80
Access to electricity % * HDI Access to electricity % * HDI
Figure 6 – Effect of imputation by regression on electricity access projections (off-grid) indicator
2.4.2. Imputation by grouping
After imputation by regression, all indicators (apart from those where no suitable proxy indicator could be found 9) had at
least 90% coverage. To complete the database to 100% coverage, a three-stage process, using loosening grouping
criteria, imputed values based on the median of other countries with datapoints in the same group 10 (shown in Table 5).
The first grouping stage sees missing values replaced with an average from other countries in the same region, income
group [12] and whether they are classified as heavily indebted [13], a small state [14] or fragile state [15]. The second
stage sees these criteria loosened, with missing values replaced by an average from other countries in the same region
and whether they are a small state or not. To fill the small number of remaining gaps, the criteria is further loosened to
take an average based on the small states grouping only.
Table 5 - Imputation by grouping stages and completeness
Pre- Imputation stage
imputation 1 2 3
Completeness 97.2% 98.9% 99.7% 100.0%
Region
Grouping
Income group
criteria
Heavily indebted
Small States
Fragile state
2.4.3. Calculate GMA score and rank
The final scores for each country were calculated by multiplying the datapoints for each indicator, by its respective
weighting (as produced by method detailed in section 2.3). Countries were ranked for each scenario, with the highest
scoring countries having the best ranking (see section 4. Results and Findings).
9 No proxy found for six indicators. Two had moderate coverage (RISE 74%, off-grid renewables capacity (mini-grids)
80%), so were included in imputation by grouping. Four had poor coverage (no. mini-grid developers 57%, no. people
connected to mini-grids 63%, off-grid renewables capacity (standalone) 48%, and off-grid lighting/appliance customers
65%); countries with no data for these indicators were given a value of zero.
10 Groupings: Region – East Asia & Pacific, Europe & Central Asia, Middle East & North Africa, Latin America &
Caribbean, South Asia, Sub-Saharan Africa; Income group – high, upper middle, lower middle, low; Heavily indebted –
yes, no; Small state – yes, no; Fragile (and conflict affected) state – yes, no.
16www.mecs.org.uk
3. Limitations
The purpose of creating a composite indicator is to distil the complexity of a problem into a series of quantitative
indicators which are combined into a single score which is simpler to understand, communicate and interpret for a wider
range of stakeholders. Common criticisms of this approach are that it can over-simplify complex issues and be
misleading or misused when poorly understood, especially when unreliable datasets are used [16] [17] [18]. To avoid
some of these pitfalls, this report has provided a detailed methodology and results (with more information available via
the excel tool11) and engaged with a multidisciplinary steering group at all stages. In addition, key limitations associated
with the availability and accuracy of data are summarised below.
During the “identification of factors and representative datasets” stage (as detailed in section 2.2) a wide range of factors
which influence the viability of a scale up of electric cooking were long- and short-listed through consultation with
stakeholders from multiple disciplines. Through an extensive review of publicly available sources, datasets were
matched with these factors to represent them in the GMA database, but for a number of factors suitable datasets were
not available. Three key areas are listed below:
Cost competitiveness of electric cooking – lack of fuel prices data
To the authors’ knowledge, there is no publicly available dataset for the cost of cooking fuels (LPG, charcoal and
kerosene in particular) across the Global South, preventing comparison with the cost of cooking on electricity (electricity
prices across the globe are available from the Ease of Doing Business database). Significant attempts to source this
information were made, including via an online survey sent to Clean Cooking Alliance (CCA) networks (amongst others),
but were able to collect a small number of responses from only 20 countries.
Knowledge gaps around the relationship between cuisines, cooking practices and cooking energy consumption
There is still much to be learned about the differences in energy required to cook foods on different devices, and how
this varies according to the cooking processes involved for cooking “typical daily/weekly” menus across the world. For
example, a diet which often includes boiling or stewing foods for long periods (e.g. tripe, beans) are well suited to energy-
efficient insulated and pressurised electrical devices, while cooks often prefer LPG when quickly shallow frying.
Cooking fuels and electricity access – global datasets still lack multi-dimensionality.
Some of the highest weighted, and therefore most influential indicators relate to the cooking fuels used (drawing on the
WHO household energy database [19]) and access to electricity (drawing on the World Bank DataBank [20]). However,
these datasets still lack the necessary nuance to account for fuel stacking and tiers of electricity access (as highlighted
by ESMAP [3]) which vary hugely across the Global South and is likely to strongly influence the viability of a scale up of
electric cooking. In order to account for fuel stacking to some extent the “upper bound” (rather than the average) of
household cooking fuels is used in the GMA scores, however, until a much larger number of countries have implemented
data gathering methodologies such as ESMAP’s Multi-tier Framework [21] or incorporated more nuance into energy and
cooking questions in household censuses this will continue to hinder national, regional and global analyses.
Mini-grid and off-grid market size and strength – poor global coverage
The availability of data on the size and strength of mini-grid and off-grid markets varies significantly between countries
with many having little or no data. The GMA’s mini-grid and off-grid infrastructure indicators use datasets (see Appendix
1 for more information) which rely on countries voluntarily updating open access resources (such [22] and [23]),
governments keeping publicly available records of their sectors or being members of an association which collects such
data [24] which leads to databases of varying quality for around half of the countries included in the GMA. Given the
current growth of the mini-grid and off-grid markets, and its expected continued acceleration in the coming years,
significant improvements in such resources are needed, alongside understanding of which cooking fuels are currently
being used by those with different tiers of energy access (perhaps more useful than current datasets which focus on the
arbitrary disaggregation of rural vs urban).
11 Link TBC
17www.mecs.org.uk
4. Results and Findings
This section outlines the results of the GMA as a global ranking and score for each of the national grid, mini-grid and
off-grid (standalone) supported electric cooking scenarios. A high score/ranking indicates better viability for a scale up
of electric cooking, and a low score/ranking indicates a worse viability. Short descriptions of selected countries’ scores
(grouped when of countries’ scores are similar) are also provided. This is followed by further analysis (in section 4.4)
highlighting “enabling environment” indicators and comparing GMA scores with and without selected indicators.
4.1. National grid supported electric cooking
The scale up of national grid supported cooking (Figure 7 and Table 8) is most viable in China, with other strong
economies (e.g. Turkey, Colombia, Brazil, Indonesia, Malaysia, Mexico and India) also inside the top 10. The ranking
list suggests that national grid supported electric cooking is most viable in countries classified as “emerging markets”.
In fact, using Morgan Stanley Capital International (MSCI) market classifications [25], eight of the top ten countries in
the ranking list are considered emerging markets, while Costa Rica and Kazakhstan make up the remainder of the top
10. The lowest scoring countries are predominantly concentrated in sub-Saharan Africa (with the bottom 14 all countries
from this region). High scoring countries for the viability of scale up of national grid supported electric cooking often have
widespread access to reliable electricity, but low numbers of people using it for cooking (and thus high unrealised
potential for electric cooking) and usually already have large proportions of using clean alternatives to electric cooking
(e.g. LPG, biogas). They also have high scores for indicators in the human and economics categories (e.g. large OECD
aid and renewable energy finance flows, and high Ease of Doing Business and sustainable energy policy scores).
GMA
Not
scored
All maps in this report Powered by Bing,
© Australian Bureau of Statistics, GeoNames, Microsoft, Navinfo, OpenStreetMap, TomTom, Wikipedia
Figure 7 – Choropleth of GMA score for national grid scenario
Nevertheless, there are still significant proportions of people cooking with biomass in these countries (Table 6). For
example, especially given their large populations, China and India still have large numbers of people cooking on
biomass, while they score very highly on the national grid scenario. However, particularly in India, many of these
are likely to be cooking on freely-collected biomass (as they have relatively low numbers of people using commercialised
polluting fuels), so have little existing cooking energy expenditure, and are perhaps likely to have weaker energy
infrastructure (due to living in remote or informal settlements).
Malaysia, Thailand, Laos, Serbia, Kenya and Vietnam (and a number of other countries shown in Table 6) also have
significant numbers in need of a transition whilst also scoring well for the national grid scenario. More analysis
relating cooking fuels and the GMA score included in section 5.3.2).
18www.mecs.org.uk
Table 6 - Countries (from top 40) with significant proportions using commercialised polluting fuels and/or biomass for cooking
*Commercialised
**Biomass (%)
polluting fuels (%)
Lower Primary Upper Lower Primary Upper
Rank Country bound fuel bound bound fuel bound
1 China 1 7 21 11 28 50
7 Malaysia 0 0 30 0 1 20
9 India 0 2 10 26 48 69
11 Thailand 4 10 22 4 10 20
16 Laos 9 26 54 41 65 85
18 Serbia 0 0 8 16 33 53
19 Kenya 9 22 44 52 66 79
23 Vietnam 0 2 14 18 32 49
27 Bhutan 0 0 10 3 21 52
34 Bosnia and Herzegovina 0 0 7 22 54 89
35 Honduras 0 3 10 17 40 60
38 Sri Lanka 0 1 7 49 67 83
39 Montenegro 0 2 11 20 42 67
40 North Macedonia 0 2 27 10 30 56
41 Mongolia 8 15 27 23 34 48
42 Uzbekistan 0 0 13 0 13 50
45 Philippines 5 12 24 26 41 56
47 Dominica 0 1 48 0 11 42
48 Guatemala 0 2 16 36 50 66
49 Ghana 21 31 46 28 40 53
*Commercialised polluting fuels = kerosene, charcoal, coal,**Biomass = wood, crop waste, dung
It is evident that high scoring countries for this scenario also often score highly across what may be called “development”
indicators including HDI, GII, Ease of Doing Business, RISE and ICT/internet adoption (more in section 4.4).
However, many high scoring countries have relatively low renewable energy shares (average of 40% for the top
10) and as such need to couple a transition to electric cooking with decarbonisation of their generation
infrastructure; such countries include: Thailand, Kazakhstan, India, Mexico, Malaysia and Indonesia. High scoring
countries with relatively high renewable energy shares are shown in Table 7 and comparing this with Table 6 highlights
the potential for a transition to electric cooking in Kenya, with strong GMA score, 89% renewable grid electricity and high
proportions of its population using polluting fuels for cooking (others include Laos, Honduras, Montenegro, Guatemala
and Ghana). Conversely, other high scoring countries with significant proportions using polluting fuels have carbon
intensive grids; China (28% renewable), Malaysia (18%), India (21%), Thailand (19%) and Vietnam (28%), despite
evidence that renewable generation is (and has been for some years) often cheaper than fossil fuels [26]–[29].
Table 7 - Countries (from top 50) with renewable energy share over 50%
Renewable
Rank Country
energy share (%)
3 Colombia 74.0
4 Costa Rica 99.2
5 Brazil 83.1
12 Georgia 76.9
15 Panama 82.1
16 Laos 57.5
17 Paraguay 100.0
19 Kenya 89.2
25 Peru 61.7
26 El Salvador 67.6
27 Bhutan 100.0
28 Tajikistan 93.1
29 Ecuador 78.9
32 Kyrgyzstan 92.4
35 Honduras 74.9
37 Albania 100.0
39 Montenegro 63.0
44 Belize 96.4
48 Guatemala 59.4
49 Ghana 50.2
19www.mecs.org.uk
4.1.1. Notable countries in the top 20 (national grid scenario)
Costa Rica – has a strong market of clean fuel users (electricity primary fuel 48% (LB 38%, UB12 58%)) and LPG primary
fuel 46% (LB 36%, UB 56%) and universal access to reliable electricity (SAIDI13 0.5hrs/yr) which is almost entirely
renewable (99%). There are some using biomass for cooking (primary fuel 5% (LB 2%, UB 9%)) which could be targeted
as a priority to achieve a complete transition to clean cooking fuels. Although not considered an emerging economy it
also has good scores across several human indicators, including HDI, ICT/internet adoption and gender inequality.
Georgia and Panama – also have strong clean fuel markets (users of clean alternatives 93% and 97% respectively)
and widespread access to reliable electricity (SAIDI 4.7 and 7.8hrs/yr respectively). Their renewable energy shares are
high (77% and 82% respectively) which means a transition from the dominant fuel in the countries, LPG, would be
environmentally beneficial. However, transitioning the significant proportion who still use biomass for cooking in the two
countries (primary fuel: Georgia 19% (LB 7%, UB 38%), Panama 11% (LB 2%, UB 29%)) should be the main priority,
particularly in Georgia which has the third highest number of HAP attributable deaths in the top 33 countries. As such,
there is still a need for many to reduce their reliance on polluting fuels in Georgia and Panama and both countries are
well positioned for this to be realised.
Laos – has almost universal access to electricity which is reliable (SAIDI 4hrs/yr) and relatively renewable (57%) and
has some of the highest levels of investment in renewables both from public and international sources despite being a
relatively small country. However, almost everyone in the country cooks with biomass (primary fuel 65% (LB 41%, UB
85%)) and/or charcoal (primary fuel 26% (LB 9%, UB 50%)), it has the highest levels of HAP attributable deaths in the
top 33, and one of the highest levels of tree cover loss. This indicates that Laos has an urgent need to transition its
population onto modern energy cooking, and also the opportunity to harness its strong electricity infrastructure in
affecting this transition.
Paraguay – has a mixture of cooking fuels, with many using clean fuels such as LPG (primary fuel 52% (LB 41%, UB
64%)) and also electricity (primary fuel 15% (LB 7%, UB 25%)). Like many others at the top of the national grid GMA
rankings, Paraguay has universal access to electricity, which is relatively reliable (SAIDI 21.9hrs/yr) and affordable. In
addition, the national grid is 100% supplied by renewables. However, there are still many who rely on biomass (primary
fuel 25% (LB 17%, UB 34%)) and/or charcoal (primary fuel 7% (LB 4%, UB 10%)) and tree cover loss is one of the
highest of any country. As such, with its completely renewable national grid, Paraguay has huge potential to increase
adoption levels of electric cooking by those using traditional fuels, as well as those using LPG.
Serbia – has the highest existing level of electricity use for cooking (primary fuel 47% (LB 30%, UB 66%)) of any country
in the top 26, with the electricity being accessible to all, reliable (SAIDI 3.9hrs/yr) and relatively cheap. Serbia also has
good scores for human indicators (e.g. HDI, gender inequality index and Ease of Doing Business), but makes relatively
little investment in renewable energy and has a national grid which is just 32% renewable. Despite being what could
perhaps be considered a more developed nation than many others in the GMA analysis, the use of biomass for cooking
is still common (primary fuel 33% (LB 16%, UB 53%)). As such, there is the potential for significant health, environmental
and gender impacts by encouraging more widespread adoption of modern energy cooking services which would be
augmented by efforts to decarbonise electricity infrastructure more broadly.
Kenya – scores highly across all GMA scenarios (particularly off-grid (2nd)) but is also 19th for the national grid scenario
with a highly renewable national grid (89%) which is reliable (SAIDI 12hrs/yr). The country has strong policy (2nd highest
RISE score excluding emerging markets), strong Ease of Doing Business score and finance indicators (e.g. third highest
for mobile money and high levels of investment in renewables). Kenya also has the second highest proportion of people
using commercialised polluting fuels (primary fuel 22% (LB 9%, UB 44%)) in the top 46 of the national grid scenario and
so has large numbers of people with the need, as well as ability to pay for, a transition to electric cooking which is
strongly viable in all contexts.
12 GMA database uses UB (95% confidence interval upper bound of proportion of population with primary reliance on
fuel) as proxy indicator for the proportion of households for whom the fuel is part of their 'fuel stack'; i.e. they cook with
it but not necessarily as their primary fuel.
13 System Average Interruption Duration Index (SAIDI) is the number of hours of electricity supply interruption the
average customer experiences per year (as provided by Ease of Doing Business database)
20You can also read