Global listed infrastructure - 'Buy' time looming? - Global Matters 26 - 4dinfra.com
←
→
Page content transcription
If your browser does not render page correctly, please read the page content below

4dinfra.com

Global Matters 26
Global listed infrastructure –
‘Buy’ time looming?

April 2020

Global listed infrastructure – ‘buy’ time looming?                                                                                                  2

The COVID-19 pandemic has very likely pushed the international economy into recession and cut a
swathe through global equity markets. From 21 February through to the end of March 2020, the
US S&P 500 equity index was down 23.2% and the MSCI World index was down 23.1%.
Listed infrastructure has certainly not been immune to this value erosion, with the infrastructure
indices down 18-32% over the same period. This price weakness could continue for a while yet,
until it becomes clearer that health authorities around the world are getting on top of the
outbreak. However, it is important to remember that infrastructure is a very long duration asset
with a 5-10+ year investment horizon. Indeed, once we move past the worst impacts of the virus
and the world’s economy returns to a more stable environment, infrastructure, in all its forms, will
be integral to the economic recovery and returning society to ‘situation normal’. There is no global
growth recovery without roads, railways, pipelines, power transmission networks, communication
infrastructure, ports and airports.
In this paper Sarah Shaw, Chief Investment Officer and Global Portfolio Manager from 4D
Infrastructure, revisits listed infrastructure’s unique and compelling characteristics, outlining why
4D continues to love the sector and why we believe it will be central to the global economic
recovery when it comes. Sarah then provides an overview of how far some of the key
infrastructure sectors and stocks have fallen in the COVID-19 equity market sell-off. Blending these
two thematics, and given the extent to which the market has already fallen, she concludes that we
are indeed at the precipice of a real investment opportunity in listed infrastructure over the
coming 6-12 months.

Contents
1.      Introduction ......................................................................................................................... 3
2.      GLI’s key characteristics and driving global thematics ............................................................ 3
     Infrastructure’s key characteristics..................................................................................................... 3
     Two distinct subsets within the infrastructure asset class ................................................................. 4
     The long-term structural investment opportunity for infrastructure remains intact ........................ 4
3.      COVID-19 – the response so far ............................................................................................. 8
     What may economic life look like ‘on the other side’? ...................................................................... 8
     Government stimulus from all corners of the globe .......................................................................... 8
     Lower global interest rates: supportive of valuations and infrastructure ‘bond proxies’ ................ 11
     Are infrastructure companies feeling a liquidity squeeze? .............................................................. 12
     Unlisted infrastructure revaluations versus listed equity falls – who has it right? .......................... 13
4.      ‘Buy’ time looming? ............................................................................................................ 14
     Attractive entry point ....................................................................................................................... 14
5.      Conclusion.......................................................................................................................... 15
Appendix – Why 4D believes the 2020 equity market sell-offs have been overdone ..................... 17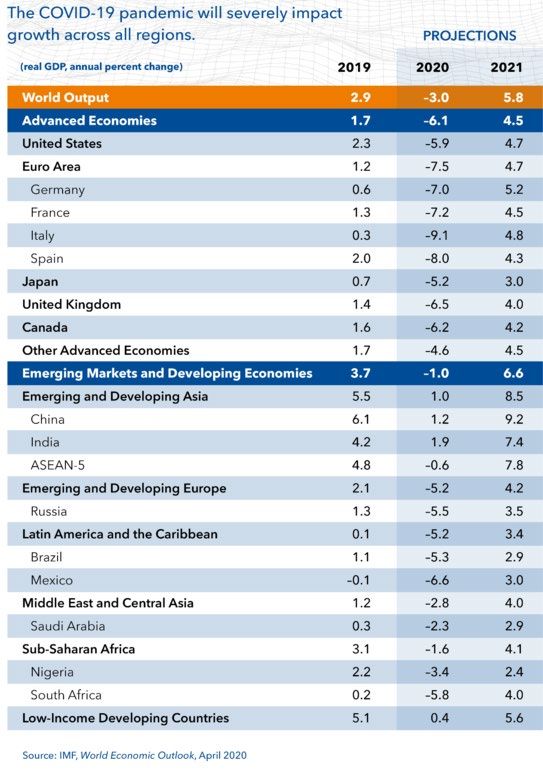
Global listed infrastructure – ‘buy’ time looming?                                                       3

1. Introduction
Infrastructure as an asset class is increasingly on the radar of investors and their advisers. In the face
of the COVID-19 pandemic, we remain optimistic about the prospects for the global listed
infrastructure (GLI) asset class in 2020 and beyond. Indeed, we believe infrastructure will be integral
to the global recovery on the other side of the current health crisis.

2. GLI’s key characteristics and driving global thematics
Infrastructure provides basic services essential for communities to function and for economies to
prosper and grow. For us at 4D Infrastructure, this equates to the publicly listed owners and
operators of essential services (regulated utilities in gas, power and water); and user pay assets (toll
roads, airports, ports, rail where a user pays for the service).

Infrastructure’s key characteristics
At 4D we look for assets with the following qualities:
     •    monopolistic market positions, or ones with high barriers to entry;
     •    returns under pinned by regulation or contract;
     •    a largely fixed operating cost base;
     •    high up-front capital costs and then very low ongoing maintenance spend;
     •    inflation hedges within the business;
     •    long dated, resilient and visible earnings and cash flows; and
     •    an attractive yield or potential yield.
It is the combination of the above attributes that sees infrastructure labelled a ‘defensive asset class’
with generally lower volatility of earnings and higher yields than broader equities. It is these
attributes that attracts investors, including ourselves, to the asset class.
History supports this earnings resilience or ‘defensiveness’, with the 4D Infrastructure universe
continually reporting positive annual earnings momentum (see Chart 1). This is since 2004 (when
listed infrastructure was recognised as its own asset class), so covers periods of economic boom and
bust including the debt driven global financial crisis (GFC).
Chart 1: Resilience of EBITDA growth

Source: Bloomberg Consensus & 4D Infrastructure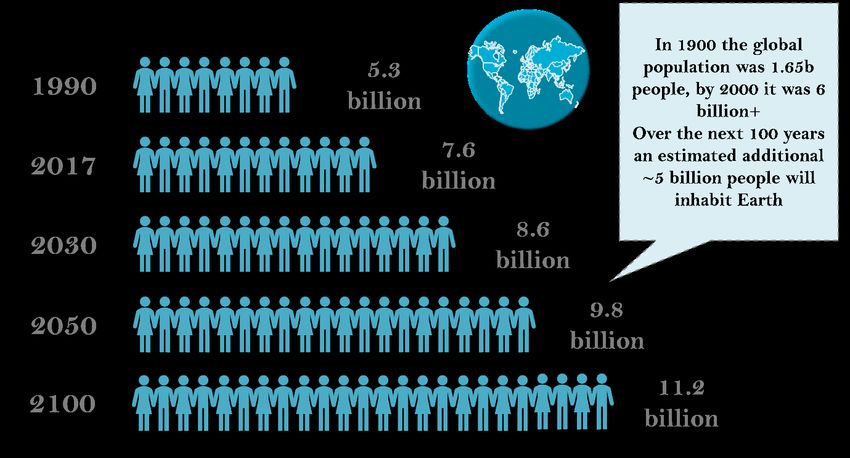
Global listed infrastructure – ‘buy’ time looming?                                                       4

Two distinct subsets within the infrastructure asset class
Despite all infrastructure assets sharing many of the attractive defensive characteristics discussed
above, diversity of sub-sector and region offers the opportunity to actively manage a portfolio for all
points of the economic or market cycle. As noted above, infrastructure comprises two quite distinct
and economically diverse asset subsets: Essential Services and User Pays.
Essential Services are the regulated utilities in the power, gas and water space. These assets are
largely immune to economic shifts (up or down), as a function of them being:
    •   a basic need; and
    •   the structure of their regulatory environment, which measures returns independent of
        volumes.
These assets are more ‘bond proxy’ in nature, particularly over the shorter term. They are more
immediately adversely impacted by rising interest rates/inflation and are slower to realise the
benefits of economic growth. At the same time, they are less exposed to economic contraction and
benefit from lower interest rates. These assets are an attractive overweight investment in depressed
economic environments, as they can offer earnings growth and yield support even in weak growth
scenarios.
In contrast, User Pay assets are positively correlated to GDP growth and wealth creation. Typical
User Pay assets are airports, toll roads, rails and ports, where users pay to use the asset. These
stocks capture GDP growth via volumes and often have built-in inflation protection mechanisms
through their tariffs. As interest rates/inflation increase over time, this macro correlation leads to
earnings upside. This should then be reflected in the relevant stock price and performance. As such,
these assets are well suited to growth environments or buoyant economic climates.
Therefore, listed infrastructure portfolios can be actively managed to take advantage of the
economic cycle. While a diversified portfolio with exposure to both subsets is always optimal, in
tough macro environments Essential Services are the preferred overweight as the earnings of these
assets generally hold up well due to them being largely immune to the macro environment. In
contrast, when there is a solid, growth-oriented economic backdrop User Pays are the preferred
overweight.
Further, infrastructure offers truly global exposure with assets across developed Asia, Europe and
North America as well as emerging markets. This allows investors to capitalise on in-country
economic cycles and gain exposure to domestic demand stories. With economic trends currently
diverging, certain regions offer better relative upside at present and we can position for this.
We believe infrastructure is truly unique as an asset class in offering this portfolio positioning
flexibility.

The long-term structural investment opportunity for infrastructure remains intact
Infrastructure offers defensiveness with economic diversity as discussed above. These attributes,
coupled with a significant growth opportunity, create a very attractive long-term thematic for the
sector which is intact despite the near-term concerns of COVID-19.
There is a huge and growing need for infrastructure investment globally as a result of decades of
underspend, and the changing dynamics of the global population.
Replacement spend
There has been a chronic underspend on critical infrastructure in virtually every nation over the past
30 years, if not longer, which was largely due to governments having other spending priorities. For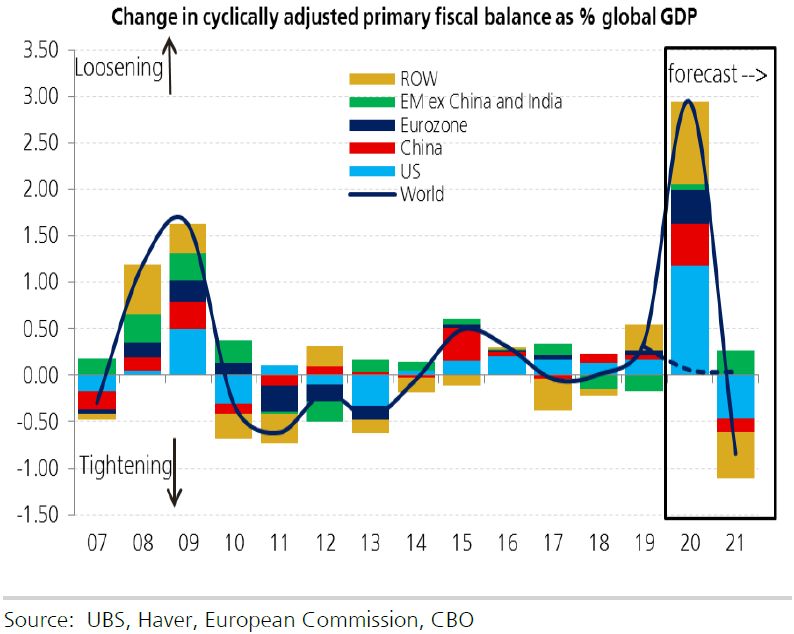
Global listed infrastructure – ‘buy’ time looming?                                                        5

example, during the GFC the priority was saving the global banking system – not replacing water
mains. However, the infrastructure need is now critical. To put this in context:
    •   over 50% of London’s water mains are over 100 years old;
    •   the 2018 Genoa bridge collapse in Italy has highlighted the age of much of the European
        transport infrastructure – it was a ‘mere’ 51 years old. Sadly, since then a further two Italian
        bridges have collapsed; and
    •   in the United States, close to 80% of the water pipes are over 30 years old and some are
        over 100 years old. In some cases, wooden water pipes are still being used by the global
        ‘superpower’ to service their communities’ water needs.
The photos below are all examples of developed market infrastructure in dire need of investment.

Population growth & environmental considerations
The second driver of the need for infrastructure investment is quite simply population growth. In
1900 the global population was approximately 1.65 billion people, and by 2000 that number had
grown to close to 6.1 billion – keeping in mind that some of the infrastructure we are still using
today was built to service that 1.65 billion. By the turn of the next century, the global population is
expected to be over 11 billion, underpinning the need for yet more spend. As a society we need to
first play catch-up, and then invest for the future generations.
Importantly, much of this population growth is coming from the emerging world, where
demographic trends are very supportive of economic evolution and infrastructure investment as
discussed below.
Global listed infrastructure – ‘buy’ time looming? 6 Chart 2: Projected world population to 2100 Source: UN Department of Economic and Social Affairs, Population Division 2017 This population growth has also raised a number of environmental and climatic challenges that underpin the need for even more spend on infrastructure to ensure the sustainability of the planet. To that end, renewable energy and the coal-to-gas transition are thematics to which infrastructure investors can gain access. Demographic trends support infrastructure investment Longer-term demographic trends also further support the infrastructure asset class and the need for investment. While the COVID-19 pandemic may lead to a temporary pause in these thematics, we believe they will re-assert themselves once the crisis is behind us. The emergence of the middle class, particularly in emerging markets (EMs), is a theme 4D finds very exciting at present, and one we believe will provide enormous opportunity for investors. Given the potential size of the middle class in EMs (China, India and Indonesia alone account for 40% of the global population), changes in spending and consumption patterns will have significant implications for global business opportunities and investment for decades to come. From an individual’s perspective, as personal wealth increases in a country (reflected by a growing middle class) consumption patterns inevitably change. This starts with a desire for three meals a day, then moves to a demand for basic essential services such as clean water, indoor plumbing, gas for cooking/heating and power (all this requires infrastructure). With power comes the demand for a fridge or a TV, which increases the need for port capacity and logistics chains (more infrastructure). Over time this evolution progresses to include services that support efficiency and a better quality of life, such as travel – with a demand for quality roads (on which to drive that new scooter and then car) and airports (to expand horizons). Importantly, one of the clear and early winners of the emergence of the middle class is infrastructure, which is needed to support the evolution. For example, at present only around 10% of the Chinese population has a passport (and less than 5% in India), yet pre COVID-19, airports globally were reporting record passengers driven by Chinese tourists. At the World Economic Forum in Davos last year, the CEO of Chinese travel provider Ctrip, Jane Sun, predicted the number of
Global listed infrastructure – ‘buy’ time looming?                                                                 7

Chinese passport holders would grow to 240 million by 2020. At the time, about 120 million Chinese
citizens, 8.7% of the population, held a passport. And in our view this is just the start. The theme will
re-assert post COVID-19.
Chart 3 shows that as disposable income has grown in China, so too has the amount of travel
undertaken by Chinese residents, both domestically and overseas. While this chart is a little old, the
trend has continued and post a COVID-19 blip we expect it will continue for years to come.
Chart 3: Rising disposable income/capita in China has had a positive impact on domestic trips/person
and outbound departures

        Domestic trips per person in China                           Outbound Chinese departures % of population

Source: Morgan Stanley Research, Blue paper: Why we are bullish on China, February 2017

A further example of the impact of an expanding middle class is the natural correlation between
growth in GDP per capita and vehicle ownership, as shown in Chart 4. China, like India and
Indonesia, still has a low level of vehicle penetration. However, as each nation’s GDP per capita
continues to climb, it can be expected that so too will each country’s level of vehicle ownership. Car
production can therefore be expected to be strong, as will the demand for new and improved roads.
Chart 4: China/India/Indonesia’s auto penetration v other nations 2015

Source: Morgan Stanley Research, Blue paper: Why we are bullish on China, February 2017

From an infrastructure investment perspective, the consequences of this changing demographic are
enormous. This includes the domestic demand story within the EMs by way of utility,
communication and transport investments, as well as a growing need for new and expanded
Global listed infrastructure – ‘buy’ time looming? 8
international (and domestic) airports, toll roads, port infrastructure and utility services more
generally.
When you put all these factors together (developed market replacement spend, population growth
largely driven by the EMs, and the emergence of the middle class in EMs), the need for global
infrastructure investment over the coming decades is clear. It is also clear that governments, the
traditional providers of infrastructure, are simply not going to be able to fully fund this need –
thereby creating a huge investment opportunity for the private sector over the coming years. That
opportunity is a key thematic to which investors can gain exposure, and a thematic not derailed by
COVID-19 – in fact, it is in all likelihood increased.
3. COVID-19 – the response so far
What may economic life look like ‘on the other side’?
The COVID-19 pandemic has very likely pushed the international economy into recession and cut a
swathe through global equity markets. This value erosion could well continue for a while yet until it
becomes clearer that health authorities around the world are getting on top of the outbreak and/or
a vaccine is developed.
While the health crisis continues, increasing focus is turning to what economic life may look like on
the other side. The IMF draws the analogy with a war, where there are two phases. Phase 1 is the
war, where the pandemic is in full swing with mitigation measures curtailing economic activity – this
lasts at least 1-2 quarters; and Phase 2 is the post-war recovery with the pandemic under control.
The pace of this recovery will crucially depend on policies undertaken during the crisis. If policies
ensure workers do not lose their jobs, renters and homeowners are not evicted, companies avoid
bankruptcy, and business and trade networks are preserved, the recovery will occur sooner and
more smoothly.
Another characterisation of Phase 2 is whether we experience a V-shaped 1 economic recovery,
where the economic policies implemented in Phase 1 are effective in delivering the outcomes
described above; a U-shaped economic recovery, where more pain is borne by society in the form of
business closures, unemployment etc; or, worst case, a deep and prolonged recession or even
depression.
Government stimulus from all corners of the globe
What we do know is the economic response to the COVID-19 pandemic from governments and
central banks around the world has been massive and continues to grow. For example, to date:
• UBS, in early April 2020, estimated the global fiscal boost in response to the COVID-19 crisis
at 2.94% of global GDP, compared to 1.66% during the GFC. Additional fiscal packages are
expected;
1 The letter designation (V, U, L, W) to an economic recovery refers to the speed and shape by which certain economic
indicators (such as GDP growth) recover from the slowdown. A ‘V’ shaped recovery suggests a strong, ongoing bounce-
back in those economic variables; a ‘U’ shaped recovery is not as rapid; ‘L’ shaped suggests a prolonged period of no
recovery – potentially a depression; and a ‘W’ shaped recovery is one categorised by a recovery, then a regression back to
negative/low growth, followed by another bounce then regression etc. This is sometimes referred to as a ‘double dip’
recession.Global listed infrastructure – ‘buy’ time looming? 9
Chart 5: Change in cyclically adjusted primary fiscal balance as a % of global GDP
Chart 6: Contributions to change in global fiscal impulse (2020)
• As at 31 March, the US Senate had negotiated a nearly US$2 trillion emergency bill that
aims to counter some of the economic toll of the COVID-19 pandemic;
• the US is already talking of another roughly $2 trillion package and President Trump is
pushing for increased infrastructure spending as part of this new plan;
• leaders of the G20 major economies have pledged to inject US$5 trillion in fiscal spending
in the global economy to blunt the impact of COVID-19 and ‘do whatever it takes to
overcome the pandemic’;Global listed infrastructure – ‘buy’ time looming? 10
• Germany has launched a program which roughly translates to ‘whatever it takes’, which
suggests the lengths it is willing to go to in order to support its economy and populous;
• in Australia, the government has already launched three tranches of stimulus which, as at
the end of March, represented A$320 billion in economic support, or 16.4% of GDP;
• there has been a strong global monetary response with, for example, the US Fed cutting
interest rates, massively expanding its repo operations and re-initiating QE with the
purchase of US$500 billion in treasury bonds and US$200 billion in mortgage backed
securities; and
• faced with interest rates at zero, a number of other central banks have launched new QE
programs since January 2020.
Chart 7: Rate cuts and QE since January 2020
While it is too early to tell what the above combination of policies will deliver, it appears to us that,
collectively, governments are targeting at least a ‘U’ and preferably a ‘V’ shaped recovery. On 6-7
April 2020, Focus Economics surveyed 77 institutions. Most see a global recession lasting two
quarters, with 88% expecting a ‘U’ or ‘V’ shaped recovery, 7% expecting an ‘L’ or ‘W’ shaped
recovery, and 5% ‘other’.
On 14 April 2020, the IMF released their updated global growth forecasts as shown in Chart 8 below.
The IMF believes the ‘Great Lockdown’ recession will be the steepest in almost a century and
warned the world economy’s contraction and recovery could be worse than anticipated if COVID-19
lingers or returns. In its first World Economic Outlook report since the spread of the virus and
subsequent freezing of major economies, the IMF estimated that global GDP will shrink 3% this year.
That would likely mark the deepest dive since the Great Depression of 1929-33. However, the IMF
anticipates strong growth of 5.8% next year, but it cautioned risks are tilted to the downside. Much
depends on the longevity of the pandemic, its effect on activity and related stresses in financial and
commodity markets.Global listed infrastructure – ‘buy’ time looming? 11
Chart 8: IMF Global growth projections
However, it is important to remember that once we move into the economic recovery phase,
infrastructure in all its forms will be integral to that recovery and returning society to ‘situation
normal’. There is no global economic recovery without roads, railways, pipelines, power
transmission networks, communication infrastructure, ports and airports. Accordingly, and given the
market correction we have seen to date, we believe we are indeed at the precipice of a real
investment opportunity in listed infrastructure over the coming 6-12 months as the global recovery
unfolds.
Lower global interest rates: supportive of valuations and infrastructure ‘bond proxies’
We have previously published several articles on our analysis of the relationship between
infrastructure assets and interest rates, which we addressed briefly above and summarise as follows.
• In rising interest rate environments the traditional Essential Services assets, or Regulated
Utilities, is the sub-sector within infrastructure that is most negatively impacted (at least
over the short term). In many cases utility returns can be squeezed as interest rates moveGlobal listed infrastructure – ‘buy’ time looming? 12
higher due to the regulated nature of their returns. For a Regulated Utility to recover the
cost of higher inflation or interest costs, it must first go through its regulatory review
process. This involves making submissions to the regulator, arguing that prevailing economic
conditions have changed and that they should be entitled to recover those increased costs
via increased rate charges to their client base. While a regulator is required to have regard
for the changing cost environment the utility faces, the process of submission, review and
approval can take some time. In addition, the whole environment surrounding costs,
household rates and utility profitability can be highly politically charged. As a result, both the
regulatory review process and the final outcome can at times be unpredictable.
• Further, utility stocks are often priced in the market based on the differential between their
yield and the market’s risk free (Rf) rate. Therefore, in a rising interest rate environment, as
the Rf rate rises so too must the Regulated Utility’s market yield in order to maintain the
Rf/yield relationship that the market seeks. All other factors held constant, this is achieved
by a fall in the share price of the Regulated Utility asset while its dividend payout is held
constant. This is the so called ‘bond proxy’ relationship.
• In contrast, our analysis has shown that in rising interest rate environments User Pay assets
tend to hold up reasonably well as they typically have built-in inflation protection in their
concession deeds and are capturing the buoyant environment which has predicated the rate
rise.
Of course, in the current environment we are in a period of falling interest rates or at least a period
of lower for longer. Lower interest rates are supportive for all infrastructure investment. For the
opposite reasons to the points we made above regarding Regulated Utilities in a rising rate
environment, falling interest rates will be supportive of their earnings and share price as the gap
between regulated returns and real costs widens (along with the yield dynamic).
All things equal, we also expect User Pay assets to hold up well in a low interest rate environment
simply because their cost of funding and the Rf rate used by the market to value their future
cashflows will both be lower which, using a traditional discounted cash flow (DCF) valuation
methodology, translates into a higher stock price valuation. However, this is not an all things being
equal environment, as COVID-19 will have a direct and sharp earnings impact on User Pay assets as
quarantine arrangements play out. This will impact near-term earnings and create downward
pressure on valuations. The lower interest rate environment will mitigate some of this valuation
downside. We take a closer look at this dynamic in the appendix, but believe share prices have
reacted drastically to the near-term earnings shock and we suggest have over-sold.
Are infrastructure companies feeling a liquidity squeeze?
Importantly, solid well-managed infrastructure companies are not feeling a liquidity squeeze at
present, with reserves in place and balance sheets in strong starting positions (in many cases much
stronger than prior to the GFC). Companies are communicating robust liquidity positions, including
even the hard-hit airport sector, which should sustain them through COVID-19 into 2021 and
beyond.
Prudently, some companies are cutting dividends in order to further improve available cash, as well
as appease social expectations from domestic governments. However, these are not what we would
call forced cuts but rather a sensible reaction to a very uncertain environment.
Management teams are also taking the opportunity of open credit markets and low interest rates to
secure financing from both financial institutions and the bond markets to ensure ongoing liquidity
through the COVID-19 period. Despite near-term uncertainty around economics and the duration of
the pandemic, the underlying fundamentals of these assets remain attractive to debt investorsGlobal listed infrastructure – ‘buy’ time looming? 13
which should go some way to reassuring equity investors. This is particularly true given that, during
the GFC, debt markets were generally far better indicators of pending market problems than were
equity markets.
There are numerous recent examples, across both utilities and user pay stocks, of successful debt
raisings, including those below.
Recent debt raisings by GLI companies
Date: 2020 Transaction
26 March French airport group ADP issued a total of €2.5 bn via 2 bonds – the first a 6.5 year bond for €1bn with
a fixed coupon of 2.125% pa (300bps over mid-swap rate) and the second a 10-year bond for €1.5bn
with coupon of 2.75% pa
31 March US tower operator Crown Castle issued 2 bonds which together raised US$1.25bn – the first US$750m
was for 10 years at a 3.30% pa coupon, and the remaining US$500mn was for 30 years at 4.15% pa
March US utilities such as AEP Corp have raised US$1bn in credit facilities, Union Electric raised US $465mn in
senior notes at a spread of 221bps/2.95% annual coupon
1 April Spanish utility Iberdrola issued a 5-year Green Bond for €750mn at a spread of 115bp/coupon of
0.875% pa – this offer was over-subscribed by more than 11 times, which allowed the company to
narrow the spread from a guidance range of 130-170bps
1 April Spanish airport group AENA secured an additional €1.08bn in financing from various financial
institutions for a period of between 1-4 years to sure-up its liquidity position – available cash and
credit facilities now stand at ~€2.5bn
1 April Canadian midstream operator TransCanada issued a 7-year C$2bn bond at a spread of 243bps over
the Canadian Govt Bond, equating to a coupon of 2.98% pa. The company also narrowed the pricing
from original guidance of +325bps
1 April German utility EON issued a 7.5-year Green Bond for €750mn with an overall coupon of 1% pa/130bp
spread, and was 8x oversubscribed
1 April Australian toll road operator Transurban issued a €600mn 10-year bond priced ‘below current debt
maturities’
1 April Australian listed toll road operator Atlas Arteria issued a €500mn 7-year bond at a spread of
150bp/coupon of 1.25% pa
9 April UK regulated utility National Grid issued a £400mn, 20 year bond with a coupon of 2% pa
Source: 4D Infrastructure
Unlisted infrastructure revaluations versus listed equity falls – who has it right?
There has long been discussion in the market about the relative volatility of listed infrastructure
assets compared to their unlisted peers. Interestingly, over short-time frames, the correlation
between listed and unlisted valuations is often very low – keeping in mind that we are talking the
same type of asset if not the same exact asset. However, over longer periods the correlation has
proven to be higher. This is a function of listed equities being priced daily versus unlisted valuations
which are adjusted less frequently (e.g. quarterly/annually), as well as some subjectivity allowed by
managers/valuers of unlisted assets.
As a result of the COVID-19 global contagion, equity markets have fallen on average over 20%, with
listed infrastructure down a similar amount, but with hard-hit sectors such as airports down over
35%.
Unlisted infrastructure players have also recently assessed the impact of COVID-19 and adjusted
their asset valuations down, but by a much smaller percentage than the listed market falls. For
example, press reports:Global listed infrastructure – ‘buy’ time looming? 14
• Australia’s Unisuper has cut the value of its holdings in unlisted infrastructure by 6% (this
investment portfolio includes the Brisbane and Adelaide airports); and
• AustralianSuper, the nation's largest super fund, has cut the value of the unlisted assets on
its books by 7.5% (which includes infrastructure).
We believe the real fundamental valuation impact on these assets of the COVID-19 pandemic is
more closely aligned with the unlisted valuation shift. There is clearly a significant near-term
earnings impact for some of the infrastructure sectors, namely airports, toll roads and other User
Pay sectors that justifies a cut to valuations. However, the fundamentals of the stocks/sector suggest
the listed market has completely oversold these assets on what 4D considers to be an event-driven
earnings shock. We believe this will prove to be a buying opportunity for these assets if investors can
look through the near-term earnings hit.
Take an airport as an example. The grounding of flights has an immediate impact on revenues and,
given airports are a high fixed-cost business, the impact to the bottom line is even greater. This
impact is clearly real and warrants a correction in valuations. What should that correction be? Any
investor valuing an airport on a one-year price-to-earnings (PE) multiple will be slashing their target
prices as the one-year earnings outlook of the airport is dramatically cut. However, as we said at the
outset, infrastructure is a very long duration asset class, with a 5-10+ years investment horizon.
Accordingly, 4D (along with other infrastructure investors) values these assets using a long-term DCF
methodology to determine an intrinsic fair value for the stock. While a one-year earnings (cash flow)
hit will impact this valuation, for 50/60/75-year duration assets a one-year hit does not justify a 35%
drop in value. Our view is premised on the fact that this is an event-driven earnings shock, not a
long-term structural industry shift. We believe that while COVID-19 is causing significant disruption
and earnings impacts globally, it will resolve and life will return to a new normal. We also believe the
long-term structural opportunity for airports remains intact and very strong – traffic will recover and
with it, earnings.
We believe this widening value disconnect between listed and unlisted valuations represents a
significant opportunity for listed infrastructure investors.
4. ‘Buy’ time looming?
At 4D, we believe the combination of attractive fundamentals, long-term thematics (as discussed
above), the COVID-19 response (also addressed above) and currently very attractive stock prices
represent a unique buying opportunity for listed infrastructure.
Attractive entry point
While we believe the intrinsic value of infrastructure assets is best represented by DCF modelling, it
is worth highlighting that, on a multiple basis, listed infrastructure stocks are trading at the low end
of their historical trading ranges. As the charts below reflect Bloomberg one-year forward consensus
data, we expect further earnings revisions to forecasts for certain sectors.
However, we do believe it highlights the attractiveness of the infrastructure universe at this point in
time, which is further enhanced by the current dividend yields on offer reflected in Chart 10 below.
This is particularly true when you consider where these sectors were sitting at 31 December 2019 (as
depicted in the blue dots on the charts below relative to now, the red dots).Global listed infrastructure – ‘buy’ time looming? 15 Chart 9: 10-year average EV/EBITDA multiples Source: Bloomberg as at 31 March 2020, using 1-year fwd consensus forecasts & 4D Infrastructure Chart 10: 10-year average dividend yields Source: Bloomberg as at 31 March 2020, using 1-year fwd consensus forecasts & 4D Infrastructure To illustrate the extent of the present investment opportunity, the 4D research team has provided a summary of the impact of COVID-19 on their coverage universe (see the appendix) in order to demonstrate just how much recent share price movements have impacted them and where the most attractive opportunities lie. So, to bring all the above arguments together, we believe this is a time to refrain from panic, and employ what Berkshire Hathaway’s Charlie Munger describes as ‘sit on your ass investing’, while taking advantage of any extraordinary opportunities the market might offer. 5. Conclusion We believe the COVID-19 issue will pass, but not without obvious and significant personal and economic pain including its impact on global growth. Some of the world’s best and brightest medical research minds are focused on developing a vaccine. The reward for success is likely high in both financial and global recognition terms. The virus has clearly caused considerable economic damage and seen equity markets fall by over 20% to the end of March. However, we believe this has created a unique investment opportunity in GLI. Once the virus is contained and/or a vaccine developed, we believe the current pandemonium surrounding daily life will ease. While we have not yet reached that point, when we do the impact of
Global listed infrastructure – ‘buy’ time looming?                                                                        16

the massive global monetary and fiscal policy response will show, driving up global economic
growth. Global infrastructure will be fundamental to that growth, and we expect asset values to
respond accordingly. As stated at the outset, there is no global growth recovery without roads,
railways, pipelines, communication infrastructure, power transmission networks, ports and airports.
These assets are currently offering very attractive value to investors willing to be patient and work
through the ongoing turbulence that we are likely to see for a few months yet.

For more insights from 4D Infrastructure, visit 4dinfra.com

This information is issued by Bennelong Funds Management Ltd (ABN 39 111 214 085, AFSL 296806) (BFML) in relation to
the 4D Global Infrastructure Fund and 4D Emerging Markets Infrastructure Fund. The Funds are managed by 4D
Infrastructure, a Bennelong boutique. This is general information only, and does not constitute financial, tax or legal advice
or an offer or solicitation to subscribe for units in any fund of which BFML is the Trustee or Responsible Entity (Bennelong
Fund). This information has been prepared without taking account of your objectives, financial situation or needs. Before
acting on the information or deciding whether to acquire or hold a product, you should consider the appropriateness of the
information based on your own objectives, financial situation or needs or consult a professional adviser. You should also
consider the relevant Information Memorandum (IM) and or Product Disclosure Statement (PDS) which is available on the
BFML website, bennelongfunds.com, or by phoning 1800 895 388 (AU) or 0800 442 304 (NZ). BFML may receive
management and or performance fees from the Bennelong Funds, details of which are also set out in the current IM and or
PDS. BFML and the Bennelong Funds, their affiliates and associates accept no liability for any inaccurate, incomplete or
omitted information of any kind or any losses caused by using this information. All investments carry risks. There can be no
assurance that any Bennelong Fund will achieve its targeted rate of return and no guarantee against loss resulting from an
investment in any Bennelong Fund. Past fund performance is not indicative of future performance. Information is current
as at the date of this document. 4D Infrastructure Pty Ltd (ABN 26 604 979 259) is a Corporate Authorised Representative
of BFML.
Global listed infrastructure – ‘buy’ time looming?                                                                          17

Appendix – Why 4D believes the 2020 equity market sell-offs have been
overdone
These tables highlight some of the investment opportunities we believe are emerging in the
infrastructure sector as a result of the recent market sell-offs.

                     Equity Market Indices 21 February to 31 March 2020 Performance
 MSCI World Index (GDDUWI                       -23.1%           S&P Global Infrastructure Index                  -31.7%
 Index) [US$]                                                    (SPGTINTR) [US$]
 US S&P 500 (SPX Index) [US$]                   -23.2%           4D Investment Universe (Equal                    -18.2%
                                                                 Weight) [A$]
 Australian ASX 200 (AS51 Index)                -28.2%           AUD/USD                                          -7.3%
 [A$]
 FTSE 50/50 Infrastructure Index                -18.2%
 (FGCIICAT) [A$]

                    4D Infrastructure Sectors/Stocks February/March 2020 Performance*
 4D Sector/Stock
  Perf 21 Feb to                                    Commentary                                               Notes
   31 Mar 2020
 Global Utilities     Global utilities have not been immune to the equity market sell off.         Strong buying
                      We believe the sell off has been very much overdone. These assets            opportunity for pure play
 -20.1%
                      offer earnings resilient to economic activity as a function of them          regulated Utilities as a
                      being a basic need as well as the structure of their regulatory              result of limited economic
                      environment which measures returns largely independent of                    exposure, and low/falling
                      volumes/economic activity.                                                   long term interest rates
                                                                                                   creating valuation upside.
                      Not to ignore the potential fundamental negatives though.
                      Commercial and industrial customers could be impacted by lower
                      demand reducing energy utilisation delivered by utilities which could
                      temporarily reduce utility earnings, but this is a short term impact
                      corrected by the regulatory model over time.
                      We believe this is a buying opportunity for the sector but have looked
                      at regional impacts and outcomes below.

 Canadian             Canadian utilities sell off over done: 1) quality of earnings with limited   Buying opportunity in line
 Utilities            exposure to changes in GDP; and 2) growth in earnings tied to                with sector opportunity
                      replacing aged infrastructure and accommodating changes in                   set.
 -19.5%
                      electricity/gas infrastructure (e.g. increasing renewables).

 US Utilities         US utilities have been heavily sold off. US utilities have little direct     Buying opportunity in a
                      exposure to reduced economic activity or GDP growth and there are            sector that has until
 -21.1%
                      other factors that, on balance, support US Utility valuations:               recently looked relatively
                                                                                                   expensive. Extended low
                      1) Lower energy/commodity prices as a result of COVID-19 are a pass
                                                                                                   commodity prices would
                      through for utilities, so reduce customer bills while not impacting
                                                                                                   be supportive of
                      gross margins. Reduced customer bills should facilitate more
                                                                                                   customer bill headroom
                      investments and shareholder value (e.g. Sempra Energy has stated
                                                                                                   to facilitate further
                      that reduced gas and energy costs will contribute to greater
                                                                                                   investment for those
                      investment in the network, driving rate base growth (9% to 2024) and
                                                                                                   companies where fuel is a
                      earnings growth); and
                                                                                                   pass through.
                      2) US Treasury bond yields are down (10yr @0.63%; 30yr at 1.24% as
                      at 6 April 2020) which is supportive of Utility valuations.
Global listed infrastructure – ‘buy’ time looming? 18
European As with their North American peers, the European utilities look Buying opportunity for
Utilities oversold despite strong earnings profiles largely immune to economic regulated assets.
activity. Leading the sell off were the Italian utilities post COVID-19
-21.0%
arriving in the continent via Italy.
The largest near-term risk to this sector is increased government
intervention or social policy, e.g. the French government is pressuring
companies to cancel dividends and in Spain a new social policy
restricts utilities from terminating non-paying customers and has
extended the social tariff. However, these measures will have limited
impacts on valuations.
E.g. Italian Italian stocks including utilities have sold off heavily as the country has Italian Utilities are
Utilities struggled to get on top of COVID-19. The outbreak has been looking very attractive at
predominantly concentrated in the Northern Region, with Lombardy present. They benefit
-23.2% the worst affected. This region is the economic heartland of the from a consistent
country, responsible for ~50% of Italian GDP. The utility sell off feels regulatory framework,
like an overreaction by the market, given utilities: high rates of regulated
returns, strong
• have either no or very little exposure to economic activity
management teams and
and GDP. For example, pureplay utilities like SNAM have superior valuations
over 90% earnings from regulated activities and are largely
supported by high yields.
insulated; This is a fundamental
• other utilities operate outside the badly impacted North buying opportunity.
(ACEA has over 80% regulated EBITDA in the capital Rome,
which is located in the less affected south of the country
but has not been immune to the sell off); and
• the Italian Government has set up a €1.5bn fund to help
customers meet utility bills which in turn supports utility
cash flows.
EM Utilities The EM utilities have been mixed with those with: 1) commodity 4D is looking for quality in
exposure; and/or 2) weaker balance sheets selling off dramatically, an uncertain economic
-22.6%
while those with strong balance sheets and supportive regulatory environment, so we
environments have held up better than the market. continue to target those
companies with strong
balance sheets and
E.g. Brazilian Brazilian utilities (as a group) look attractive, with earnings either regulated earnings.
Utilities contracted or regulated, government supportive of increased
investment, privatisations on the agenda and balance sheets to
-29.7% support volatility and increased investment. They look significantly
oversold.
E.g. Chinese Gas
Utilities Have held up relatively well as China sees the light at the end of the
tunnel as regards COVID-19. While the gas utilities reported volume
-15.1%
declines of 10-12% in January and February, by the end of March
indications are that volumes are rapidly recovering. While companies
are anticipating a resurgence in demand, they are closely monitoring
the global response and overall economic impact of COVID-19.
Developed Asian Developed Asian utilities have held up pretty well relatively. As with Attractive entry points in
Utilities global peers, Australian regulated utilities have earnings effectively Australia.
underpinned by regulation and are not directly impacted by the
-9.9%
COVID-19 outbreak. Interestingly the Hong Kong regulated utilities
(HKEI & CLP) have also remained relatively resilient since the COVID-
19 outbreak, despite the early impact.
Canadian Canadian midstream share price volatility is overdone due to Recognising the
Midstream perceived correlation with the oil price, which has been considerably likelihood of near- term
weaker since late February, hitting $20 during March. Any volatility in volatility we see thisGlobal listed infrastructure – ‘buy’ time looming? 19
-48.2% the oil price has limited fundamental impact on Canadian midstream weakness as an ultimate
because the majority of earnings are contracted. This is typified by buying opportunity -
4D’s portfolio holding in Enbridge, which has 98% of its cashflows Canadian midstream is
contracted with 93% of its cashflows with investment grade more conservatively
counterparties. levered (than US peers)
with a high proportion of
earnings contracted.
Monitoring closely.
US Midstream Huge sell-off in US midstream as a result of low commodity prices. Ultimately a buying
Low commodity prices may directly impact some midstream opportunity for
-41.6%
companies’ earnings if their contractual structures have commodity midstream companies
exposure. However, the stocks that 4D identifies for investment have with strong yields and
significant protections, such as: that have demonstrated
earnings strength in
1) contracted, fee based earnings with little direct commodity
previous low commodity
exposure and often with minimum volume protections;
environments (such as
2) operate in preferred basins with low wellhead costs so producers 2015-2016). However, it
continue to drill at low commodity prices; and is clear that the overhang
from low commodity
3) have stronger balance sheets able to withstand earnings shocks prices (rather than
without the need to raise cash or reduce dividends. earnings) will continue to
affect share prices over
the short/medium term,
Please refer to our recent Global Matters: The impact of the oil shock and while we see
on North American midstream assets significant fundamental
value we are monitoring
the market moves closely
before adding.
E.g. Cheniere Cheniere has sold off significantly as a result of: Despite Cheniere already
Energy being a top 10 position
1) the fear of lower global LNG prices impacting earnings; for 4D, this will represent
-33.8% a strong fundamental
2) the possibility that counterparties will attempt to break/renegotiate
contracts; and buying opportunity
because:
3) diminished possibility of contracts for new projects being signed. 1) there is nothing to
suggest that
Cheniere is protected by take-or-pay contracts, with little commodity
counterparties can legally
exposure and investment grade contract counterparties, which
break existing contracts;
typically covers 90% of Cheniere's LNG capacity on each train
2) Cheniere is not
developed. As Cheniere delivers operational LNG trains early, volumes
exposed to low
produced prior to the commencement of the contracting period are
commodity prices
sold on global markets at prevailing prices. In 4Q19 reporting,
throughout 2020, and
Cheniere management outlined that 72% of Cheniere's current
only has around 20%
volumes were under contract, and the price for the remaining 28% of
exposure thereafter - it
uncontracted volumes are hedged through 2020. The proportion of
requires a prolonged
contracted volumes will increase over time as trains enter their
period of low commodity
contracting period until reaching the 90% contracted position.
prices to have any impact
Cheniere management has insisted that their take-or-pay contracts
on earnings; and
are legally solid and there is no opportunity for off-takers to break
3) business development
them without compensation to the company. Recently, Naturgy
for Corpus Christi Phase 3
indicated to Cheniere that it would not take a ship delivery but is still
is still progressing with
required to fully compensate the company under the contract.
only a small amount of
Cheniere is in continued discussions with potential customers in filling capacity to fill to achieve
the remaining 2.2Mtpa of capacity unallocated on the proposed Final Investment Decision
Corpus Christi Phase 3 development (total 10-11 Mtpa of capacity). (FID). There is plenty of
This process may take slightly longer than expected, but shouldn't time to do so with
interrupt the delivery date which isn't expected until post 2023. delivery not until post
2023.Global listed infrastructure – ‘buy’ time looming? 20
Global Airports There has been a huge sell off in global airports on the back of COVID- Having stress tested
19 as passenger volumes move towards zero for the immediate future models based on
-38.2%
as a result of quarantines and border closures grounding planes. This significantly reduced
will have a fundamental impact on 2020 earnings profiles for the 2020 passenger volumes,
global airports, although some are impacted more than others at this we believe the sell off has
stage of the virus contagion. This earnings impact will be compounded been overdone. This is a
by any sustained economic deterioration as airports are an fundamental buying
economically sensitive sector. On a positive note, lower commodity opportunity for quality
prices will provide some support to airlines (lower fuel prices) for a names that should see a
period. significant re-rating once
the virus is contained. We
However, the sell off to date has been severe and we believe is an
recognise there is likely
over-reaction. It must be remembered that these assets have very
ongoing short-term stock
long concession lives, or are perpetuity assets, with strong balance
pressure and will monitor
sheets (on balance) and in some cases regulatory frameworks that will
this and ultimately use
ultimately address the traffic deterioration within the regulated arm
the weakness to add.
of the business (e.g. Mexico). To lose close to 40% of value is clearly a
response to a short-term earnings shock, not fundamental value.
Importantly, history tells us that when the ‘event’ resolves air traffic
rebounds very quickly. This sector will remain volatile as the globe
works through COVID-19, but is also offering incredible value at these
levels.
Global Toll Toll roads are economically sensitive stocks but are more domestically Assessing individual
Roads driven than airports. The direct impact of COVID-19 on the toll road stocks on a case by case
sector comes from quarantine arrangements and as the virus leads to basis, we see a buying
-27.6%
a sustained economic deterioration. On the positive side, truck traffic opportunity within this
could increase in the short term (at expense of the consumer) if more sector.
online shopping activity results from restricted movement.
As with airports though, toll road assets have long concession lives,
and a near-term earnings shock does not warrant stocks losing ~30%
of value.
Chinese Toll Unsurprisingly, the Chinese toll road sector has been sold off on Buying opportunity. Even
Roads market sentiment coupled with investor concerns regarding the short- with the implementation
to-midterm traffic outlook. These were compounded on 17 Feb when of the toll-free policy, our
-18.8%
the Chinese Ministry of Transport announced an indefinite toll-free internal stress testing
policy for all vehicles nationwide amid the COVID-19 outbreak. highlights that the sector
Operators face an immediate liquidity crunch, with immediate zero and our holdings have
cash inflow from road operations. The rationale behind the cut is to adequate balance sheet
facilitate rapid work resumption and provide strong support for the capacity and flexibility to
stabilisation of the overall economic and social situation in China. The absorb the current
government has pledged supportive measures for the toll-road situation.
operators, though it’s currently uncertain what form this will take and
whether this will provide immediate financial support to toll-road
operators. Our bear-case analysis assumes the toll-free policy lasts the
entire current year (despite consensus views of the most extreme case
being until June this year) and no compensation measures (despite
government pledge), under which scenario we still see robust
fundamental valuation metrics.
Global Ports This is a relatively small sector and as with other user pays has been Stress testing of models
sold off on fears of slowing global economic activity. Ports are with significantly reduced
-28.2%
sensitive to economic shifts and stock fundamentals need to be volumes from reduced
assessed on a case by case basis. To date we have not seen port economic activity sees
closures, as unlike airports they transport goods, not people, and have the sector under-valued.
not been responsible for the spread of the virus.
The sector was already relatively cheap on concerns of a slowing
global economy and the current situation has compounded the
impact. Quality names have been oversold.Global listed infrastructure – ‘buy’ time looming? 21
Global Rail The global rail sector is dominated by N.American rail and Japanese Fundamental preference
rail names with small exposures in other countries. Japan has felt the for N.American rail and
-15.0%
impact of COVID-19 early and this is reflected in the rail stocks, which EM rail names.
rely on consumer volumes where quarantine will impact near-term
earnings. In North America, economic concerns have been reflected
early and we believe are overdone.
North American N.American rail share price volatility is overdone. N.America rail has Buying opportunity, no
Rail sensitivity to both local and global GDP. N.America is exposed to change in view, having
imports due to intermodal volumes transporting containers from the already adopted a
-22.2%
port to inland cities (e.g. Chicago) and to exports due to transporting relatively defensive
commodities such as grain, potash, coal, etc. Acknowledging mindset on N.American
N.American rail sector sensitivity and global economic indicators being rail going into FY20.
relatively weak heading into FY20,we believe the recent sell off has
been overdone.
E.g. Kansas City KSU share price is down 27.5% since 21 February. KSU is a US/Class I KSU earnings should hold
Southern (KSU) rail company with a trunk line along a longitudinal line between US up due to: 1) advantages
and Mexico. Because of this, the majority of its volumes hauled are of rail over road on cost
-27.5%
intra North America facilitating manufacturing (e.g. automotive, and security (especially in
industrial) and energy (e.g. petroleum products) transport across Mexico); 2) out-sourcing
North America (linking Canada, US, and Mexico). While it is difficult to of manufacturing to
quantify the impact of COVID-19, we expect KSU volumes will be Mexico due to lower GDP
negatively impacted the next few quarters. Quarterly volatility in per capita; and 3)
volumes is commonplace in rail haulage due to supply chain issues proximity to developed
and other exogenous variables (e.g. weather, strikes, etc). markets US and Canada.
Importantly, COVID-19 will have no structural impact to the long run Hence, this is a buying
investment thesis. opportunity although
expect near-term
volatility as growth
outlooks shift.
Communications Communication infrastructure share price volatility is overdone due to Significant buying
earnings tied to: 1) demand for data (e.g. video telephony); and 2) opportunity,
-16.3%
with limited exposure to changes in GDP. We could actually see communications
increased data usage as a result of the virus and associated infrastructure earnings
quarantines, which could see earnings upside. will have little or no
impact from changes in
economic activity.
* Local currency performance. Sector performance is the average stock performance for stocks in the 4D Core Investible Universe, in the
indicated sector, over the indicated time period.
Source: 4D Infrastructure
The comments in the table above are based on the opinion of the research team at 4D and have been prepared without taking account of
your objectives, financial situation or needs. Please consult a professional adviser.You can also read