Gas Winter Outlook 2022/23 - October 2022 - National Grid
←
→
Page content transcription
If your browser does not render page correctly, please read the page content below
Gas Winter Outlook
2022/23

October 2022

Welcome
Welcome to this year’s Gas Winter Outlook. The invasion of Ukraine by Russia and resultant reduction in gas supplies to continental Europe has created unprecedented
uncertainty for energy markets. Whilst Great Britain is not reliant on Russian gas to the same extent as continental Europe, energy security in Great Britain and Europe
are related. The potential for a shortfall in gas supplies within continental Europe could have a range of knock-on impacts in Great Britain, creating risks around the
ability of GB to import from continental Europe if required.
GB uniquely benefits from a range of diverse and flexible sources of gas. Last winter, 70% of British gas supplies came from the UK continental shelf and Norway alone.
Flexible and reliable infrastructure, combined with robust market arrangements support these sources of supply which have historically delivered energy security for
Britain. Even during times of market tightness, the most recent example being the Beast from the East cold snap in 2018, Britain was able to secure sufficient supplies to
meet demand.
Despite this context, no one can accurately predict what will happen this winter against such a complex and uncertain backdrop. In light of this uncertainty, we have
developed three scenarios to illustrate how the market could balance supply and demand on the National Transmission System (NTS). These scenarios complement our
assessment of peak supply and demand capability that has been central to previous Winter Outlooks and illustrate the extent to which GB energy security is dependent
on flexible sources of imported gas supplies (such as LNG) throughout winter.
It is important to note that these scenarios are not forecasts, nor are they intended to illustrate a best or worst case. The actual mix of supplies on any given day will be
determined by the market.
Given the scale of uncertainty and risks associated with the current geopolitical situation as we head into this winter, we have reviewed the physical, commercial, and
market-based tools which enable us to respond to a supply and demand imbalance, should one arise, in our capacity as Residual Balancer. There may be days this
winter when we will need to utilise these tools, such as Margins Notices. Further details of the tools available to us, and how we are enhancing them, are set out in this
publication.
In the unlikely event there is insufficient gas supply available in GB to meet demand, and should the market be unable to resolve the resultant imbalance, we have the
tools required to ensure the safety and integrity of the gas system in the event of a Gas Supply Emergency. All possible measures would be taken to minimise the extent
to which we use these tools.
Finally, we continue to closely monitor the market and it is possible that the information and analysis underpinning this document may change as we progress through
winter. This is likely to be a challenging winter for energy supply throughout Europe. Factors beyond our control such as the weather, the potential for a shortfall of gas
supplies within continental Europe and the wholesale cost of gas will all influence the prevailing gas supply and demand situation in Great Britain.
To that end, we very much see this publication as the start of a conversation and part of our continued commitment to engage in open dialogue with our stakeholders as
we move through the winter. We hope that this year’s expanded publication helps you feel more informed and prepared as we enter the winter period, and we look
forward to continuing the conversation with you over the coming months.
National Grid                                                                                                                                                              2

Additional information about this
publication

We have structured this document to walk you through our analysis and assessments of
those scenarios. We have included important contextual information up front, such as
our role in operating the network and historic supply and demand analysis. We hope this
complements the existing forecast and margin information you’re used to seeing in the
Outlook, as well as helping to contextualise our scenario analysis and explain why they
are different to the central forecast.

Other Gas Transmission publications in this suite:
•    Gas Summer Outlook, published annually, with the next due in April 2023.
•    Annual Network Capability Assessment Report (ANCAR) published annually in
     June.
•    Gas Ten Year Statement (GTYS) including the ANCAR Annex, with the next due in
     November 2022.
•    Gas Future Operability Planning (GFOP), with the most recent published in
     October 2021.

National Grid                                                                             3
Contents page                                    Getting more from our data
                                                 Additional information relating to the data shared in this
                                                 publication is available within the Appendix and Data
 01     Executive summary                   05
                                                 Worksheet, the latter of which is available separately on our
                                                 website.
 02     Our role in operating the network   07

 03     Supply & Demand information         11

 04     Demand this winter                  16

 05     Supply this winter                  19

 06     Spotlight: connections to Europe    23

 07     Supply margins                      27

 08     Supply & Demand scenarios           31

 09     Contact us                          40

 10     Appendix                            42

 11     Glossary                            45

National Grid                                                                                              4
01
Executive
Summary
Executive summary
 Key Messages
                 • GB gas infrastructure has sufficient capability to meet peak (1 in 20)
Infrastructure     demand, with a positive supply margin under both intact and N-1 network
                   conditions

                 • GB is dependent on various sources of imported gas throughout winter to      Forecast (mcm/d)              2021/22   2022/23
                   meet demand, the actual mix of supplies on any given day will be
                   determined by the market                                                     1-in-20 peak demand            505       483
                 • A potential shortfall in gas supplies within continental Europe could        1-in-20 non-storage supply     492       488
                   impact the ability for GB to attract imports, should they be required
                 • A positive market price differential to both global and European markets     1-in-20 storage supply         117       117
                   will be needed for GB to attract sufficient LNG and imports from
                                                                                                Total 1-in-20 supply           609       605
                   continental Europe, when required
                 • We anticipate LNG to act as the primary source of supply flexibility this    1-in-20 margin                 104       122
  Markets          winter, supplementing UKCS and Norwegian supplies, with imports from
                   continental Europe only occurring during periods of elevated demand
                 • We anticipate the continuing high wholesale gas prices to result in a        Cold day demand                420       440
                   reduction in both domestic and industrial demand
                                                                                                Cold day non-storage supply    397       387
                 • We anticipate elevated gas demand for power generation in GB in
                   response to low imports / higher exports of electricity to Europe            Cold day storage supply         94        94
                 • We anticipate continuing gas exports to Europe at times where there is a     Total Cold day supply          491       481
                   supply surplus in GB
                 • We expect GB storage to provide flexibility to the market by responding to   Cold day margin                 71        41
                   imbalances between supply and demand, when required

                 • We have the necessary physical, commercial and market based tools to
    Tools          manage a supply and demand imbalance, including those related to a
                   Gas Supply Emergency, should it be necessary
 National Grid                                                                                                                                 6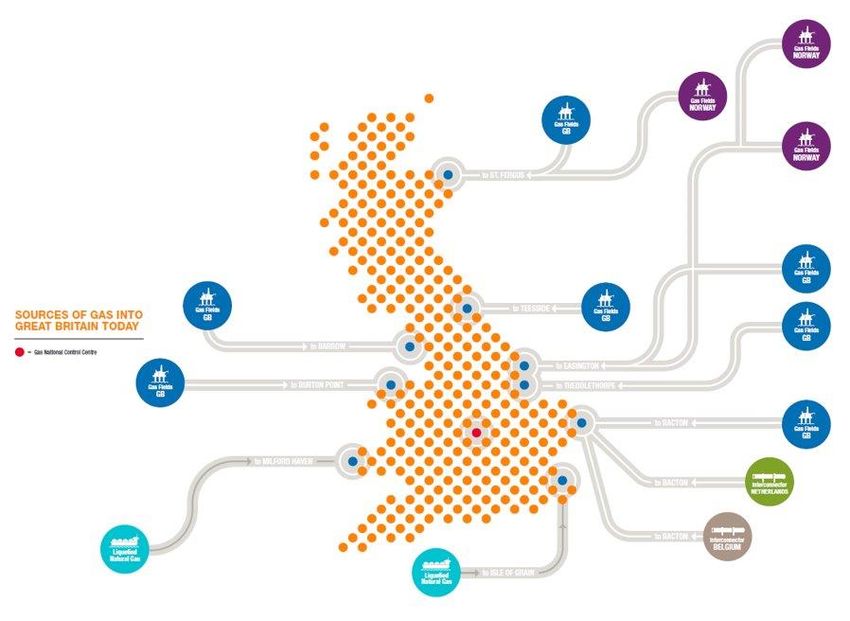
02
Our role in
Operating the
Network
Our role
In our role as the National Transmission System (NTS) Owner and Operator, we have
three key responsibilities:
•   Infrastructure provider
•   Residual balancer
•   Market facilitator
Our licence is established under the Gas Act 1986. It requires us to develop, maintain,
and operate economic and efficient networks and to facilitate competition in the supply
of gas in Great Britain. We have a responsibility to keep the NTS within safe operating
limits.
The underlying market arrangements in GB are predicated on the basis that the
market will provide the gas itself, and that the market will balance supply and
demand. Throughout the winter period, we will conduct daily assessments of gas
margins and communicate this to the industry via our market information portal.
When there is an imbalance between supply and demand, we act as residual balancer
by taking energy balancing actions via the On The Day Commodity Market (OCM).
The actions are designed to encourage shippers who are out of balance to take action
themselves and, if required, we can buy or sell volumes of gas to balance the system.
In the unlikely event there is insufficient gas supply available in GB to meet demand,
and should the market be unable to resolve the resultant imbalance, we have the
tools required to ensure the safety and integrity of the Gas system in the event of a
Gas Supply Emergency. These emergency tools include requesting additional gas
supplies be delivered to the NTS, or requiring gas consumers, starting with the largest
industrial consumers, to reduce or stop using gas. These tools will be used, if
required, subject to the authorisation of the Network Emergency Coordinator.

To read more about the tools available to us please visit our balancing website.

National Grid                                                                             8

Preparing for Winter
As a prudent system operator, we are working closely with BEIS, Ofgem, and National Grid ESO to assess the potential scenarios and associated risks that
may arise this winter. We have taken several steps to ensure we are well prepared to maintain safe and secure operation of the gas transmission system.
Specific areas of work include:
1. Margins notice 2. Operating Margin 3. Demand side 4. Exercise 5. MIPI winter
forecast Tender response reform Degree changes
We have added a new margins The Operating Margin (OM) is We have reviewed Demand We have expanded our regular We are making a number of
notice forecast in addition to our gas we can use to manage the Side Response (DSR) as part emergency exercise to ensure it changes to the Market
existing five-day-view. This is system at times of stress, as a of our winter preparedness focuses appropriately on Information Provision Initiative
intended to provide a view of short term measure. The activities. Network Emergency (MIPI) to make it easier for
what the day ahead trigger level Operating Margins Portfolio is Coordinator (NEC) stakeholders to access data
might be on any day out to D-7. comprised of LNG, gas in Following extensive communications with all and information.
storage and demand reduction engagement with customers industry participants, through all
We have based this forecast on Some of the key changes
contracts (including power and stakeholders, we are stages of an emergency, both in
the week ahead demand include:
generation). Currently we have exploring various the lead up, during, and post a
forecast and different storage • Week ahead view updated to
869GWh of OM procured for enhancements to the existing National Grid Supply
and LNG assumptions. show the difference between
2022/23. DSR process. Emergency (NGSE). Margins Notice Trigger and
Our intent is to publish daily on
During summer 2022, a The exercise will be held over Demand Forecast Values
National Grid Prevailing View The objective of these
reassessment was made of the four days during September • Live export flows to be made
from October to March. enhancements is to increase
requirement for 2022/23 and October this year and will available for each individual
the attractiveness of, and
following developments in the cover the following scenarios: Interconnector
maximise participation in, DSR
gas market since February, • Instantaneous flow graphs to
should the need arise.
which found that an additional • Emerging issues be updated to show flow
75GWh was needed. • Pre-emergency changes across a period of
• Emergency time rather than one
As a result of these findings, we
• Restoration individual snapshot
are tendering for additional OM,
• An additional two years worth
for a service from 01/12/2022
of historical supply and
until 30/04/2023.
National Grid demand data to be provided.
9
Operating the Network
Every winter our Gas Transmission system assets are configured and
operated to respond to, and deliver, the changing flows of gas on and off
the network. The operational configuration of the NTS changes throughout
the winter period and within day as it is highly dependent on the varying
sources of gas coming into the GB network, and the locations of demand.

Gas demand during the winter is largely driven by the requirement for
domestic heat. Demand tends to be highest in the south, particularly around
the Greater London area, where the population density is higher. This year,
due to the significant reduction of Russian gas supplies to continental
Europe, we may see continued gas exports to Europe through the
interconnectors, which are also located in the south of the network. We
therefore expect to have a greater reliance on the assets that move gas to
the south of England.

Gas supplies have become increasingly driven by market dynamics and
global prices, and the gas market has been particularly volatile this year.
This means the flexibility of the gas network will be more crucial than ever,
with the potential for interconnector flows to switch between large demands
and large supplies throughout the winter period. We are preparing the
network, particularly our compressors, to ensure they are available and
flexible enough to react to changing market conditions and subsequent
supply patterns.

We will continue to review what asset capability is required, included as
part of the Annual Network Capability Assessment Report (ANCAR) and
associated engagement.

National Grid                                                                   10
03
Supply & Demand
information
Contextual and historical information relating to
supply and demand
GB Sources of Demand
  The various types of GB demand, and what they mean, are split out below.

              Non daily metered (NDM) demand is associated with users where the meter is not read
Non Daily
              every day, such as residential properties and small to medium-sized industrial premises.
 Metered
              This demand is predominantly for heating and is therefore strongly weather driven. On
Demand
              cold days NDM consumption will be the highest proportion of demand.

              Daily metered (DM) demand is associated with users where the meter is read every day,
  Daily
              such as large industrial premises and small generators connected to the distribution
 Metered
              networks. DM demand also includes a few large industrial loads directly connected to
 Demand
              the National Transmission System (NTS).

              NTS power generation demand is associated with large power stations, usually
              Combined Cycle Gas Turbines (CCGTs), that are directly connected to the NTS. Gas-
NTS Power
              fired generation usually acts as a ‘balancer’ on the electricity network, filling the gap
Generation
              when more variable sources of generation such as wind and interconnectors are not
              available.

              The island of Ireland has some indigenous gas supplies, provided by the Corrib gas
 Island of
              field. This field is in decline and imports from the NTS meet around 75% of the island of
  Ireland
              Ireland’s gas demand, which predominantly consists of power generation, industry and
  exports
              residential.

              This source of demand is responsive to prevailing market conditions and is highly
Continental
              flexible. GB is physically connected to continental Europe via two gas interconnectors
 Europe
              (Belgium and Netherlands). Both interconnectors can export from GB to continental
 exports
              Europe with a combined maximum export capability of 75mcm/d.

  National Grid                                                                                           12
Historic demand behaviour by source
The historic behaviour of GB demand can be Figure 1
Demand volume ranges over the last five winters.
visualised by reviewing the range (minimum to
maximum) over the past five winter periods. Continental Europe
80
mcm/d
▪ Exports to continental Europe predominantly occur 60
40
in the earlier and later months of winter when GB 20
0
demand is generally lower. However, in winter
2021/22 exports to continental Europe in late
Daily metered
December and beyond were higher due to the 40
mcm/d
higher price of gas in continental Europe. 20
▪ Daily metered demand range is fairly consistent 0
throughout winter with limited variability due to
Moffat
weather. 30
mcm/d
20
▪ Non daily metered demand is strongly weather 10
driven and therefore there is historically a rise in 0
demand during the typically colder months of
winter. Non-daily metered
300
▪
mcm/d
NTS power generation is historically highly 200
100
dependant on the levels of renewable electricity 0
generation available and whether electricity
interconnectors are importing to GB. NTS power generation
mcm/d 100
50
0
October November December January February March
National Grid 13GB Sources of Supply
GB benefits from diverse and flexible sources of supply via several large supply points. The physical
capability of these supply points, in aggregate, can deliver daily volumes of gas in excess of that
required to meet maximum (peak day) GB demand.
UK These sources of supply historically deliver up to 117mcm/d (UKCS) and 100 mcm/d
Continental (Norway) throughout winter. Norway’s maximum supply capability to GB is 141mcm/d,
Shelf approximately 40mcm/d of this supply capability is price sensitive at maximum production
(UKCS) and rates. GB market conditions need to be favourable to continental Europe for this additional
Norway 40mcm/d of supply capability to flow to GB.
This source of supply typically provides a means of short-term balancing, with withdrawals
increasing to meet periods of high demand or responding to unforeseen supply interruptions.
GB Storage Sites typically maintain stock levels in the earlier part of the winter by limiting delivery, or take
advantage of lower demand periods by restocking their storage position. Deliverability varies
depending on storage stock levels, with a maximum capability of 117mcm/d.
This source of supply is responsive to prevailing market conditions. GB has one of the largest
Liquefied LNG re-gasification capabilities in Europe, with the ability to deliver up to 141mcm/d.
Natural Gas Sustaining flows at this level would require regular LNG cargoes throughout winter. LNG is a
(LNG) global commodity; GB market conditions would need to be favourable to other markets to UKCS
attract LNG cargoes not secured via long-term contracts.
Norway
This source of supply is responsive to prevailing market conditions and is highly flexible. GB LNG
Continental
is physically connected to continental Europe via two gas interconnectors (Belgium and
Europe
Netherlands). Combined, these interconnectors have the capability to deliver up to
imports Netherlands
125mcm/d.
Belgium
National Grid 14Historic supply behaviour by source
The historic behaviour of GB supply points can be visualised by Figure 2
reviewing the range (minimum to maximum) of deliveries over the past Supply volume ranges over the last five winters
five winter periods. Key observations include:
October November December January February March
150
• UKCS and Norway have provided a continuous base load of supply
throughout the period. Reductions in deliveries are predominantly
mcm/d
100
UKCS
driven by short-term asset faults, with minimal price sensitivity. 50
• Interconnectors have predominantly supplied gas to GB in the
0
winter, although as observed in winter 2021/22, can also export 150
gas to continental Europe based on the price differential.
•
mcm/d
LNG is highly flexible and responds heavily to price signals. 100
Norway
Deliveries during the coldest periods of the previous five years 50
have approached the theoretical maximum capability of our LNG 0
terminals, whilst reducing to near zero when the supply has not 150
been required.
mcm/d
100
• Storage withdrawal is highly flexible and is used to manage short- Belgium
term supply disruptions, or to top-up base supply during peak 50
periods. 0
150
Table 1
Historic supply by source for the last five winters
mcm/d
100
Netherlands
50
Supply Historic winter supply (bcm)
source 17/18 18/19 19/20 20/21 21/22 0
150
UKCS 19.7 18.6 18.3 17.1 16.8
mcm/d
100
LNG
Norway 21.0 18.6 15.8 18.6 19.0 50
LNG 1.8 7.8 13.4 8.9 11.4 0
150
Continental
7.8 2.3 0.3 4.8 0.5
Europe
mcm/d
100
Storage
Storage 3.8 1.9 2.4 2.1 1.9 50
National
Total
Grid54.1 49.2 50.2 51.5 49.6 0 1504 Demand this winter The demand forecast for this winter
8
    Demand forecast
                                                                                 Table 2
     Key messages:                                                               Forecast total gas demand for winter 2022/23, and weather corrected historical data for 2017/18 – 2021/22
     ▪ Total gas demand for winter 2022/23 is forecast to be higher compared                                             2017/18       2018/19   2019/20   2020/21    2021/22                             2022/23
       to the last five winters                                                  Winter demand (bcm)
                                                                                                                                     Actual demand, weather corrected                                     forecast
     ▪ Domestic and industrial demands are forecast to reduce from last winter    Non-daily metered (NDM)                  30.6            30.0            30.9            30.3            29.7              28.2
       due to high wholesale gas prices
                                                                                  Daily Metered (DM)
     ▪ Gas demand for power generation is forecast to increase in response to     (excluding NTS power                      4.8             4.5             4.5             4.4             4.0               3.8
       low imports/higher exports of electricity to continental Europe            generation)
     ▪ We expect continued exports of gas from GB to continental Europe           NTS power generation                     12.8            12.3            10.6            11.0            10.1              12.3
       during the early part of this winter
                                                                                  Total GB demand¹                         48.2            46.8            46.0            45.7            43.8              44.3

                                                                                  Island of Ireland exports                 1.8             2.1             2.6             3.0             2.8               3.2
    Non-daily metered demand, which represents the demand from
                                                                                  Continental Europe                        0.7             0.0             0.5             0.0             3.7               4.0
    domestic consumers and small to medium business premises, is
    expected to decrease from last winter as these users reduce their             Storage injection                         2.3             1.5             1.4             1.6             1.3               1.4
    demand in response to high prices.
                                                                                  Total gas demand²                        53.3            50.7            50.8            50.7            51.9              53.1
    Similarly, daily metered demand, which represents larger business
    premises and energy intensive users, is also expected to decrease.           ¹ Excludes exports to continental Europe and storage injection flows. Total gas demand includes NTS shrinkage and will therefore not tally
                                                                                 ² Includes exports to continental Europe and storage injection flows. Total gas demand includes NTS shrinkage and will therefore not tally
    Although electricity demand overall is expected to reduce, gas demand
    for power generation is expected to increase due to higher electricity
    exports, particularly to France.
                                                                                  We have seen a high level of gas exports from GB to continental Europe over the
    Gas demand in the island of Ireland is expected to [fall due to fuel          summer as Europe fills their storage ahead of the winter. We expect this trend to
    switching], however the continued decline of the Corrib gas field is          continue in the early part of the winter, supported by high LNG imports into GB
    expected to result in an overall increase in exports to Ireland compared      terminals.
    to last winter.

    National Grid                                                                                                                                                                                               17
8
GB and Island of Ireland demand
Demand levels are difficult to forecast due to the significant influence Factors that could influence the accuracy of this year’s forecast:
changing weather conditions have on energy requirements. This year is no
different in terms of the challenge of understanding the prevailing weather NDM demand
conditions we might see this winter or how cold a winter we should expect, • The weather – cold weather usually means that demand increases as people turn up
but there are also additional uncertainties to consider in the current geo- their heating and/or have the heating on for longer periods
political climate. • Prices – we are all seeing increasing energy costs and this may lead to consumers
turning their heating down and therefore lowering demand levels.
Our forecast demand profiles for GB are split out from the previous table
• Increased working from home – more people in their homes will mean a higher level of
below and we’ve outlined some of the key elements that could influence the
demand for heat and electricity. Whether this will be affected by higher prices (more
accuracy of this forecast.
people returning to the office/turning their heating down) remains unclear.
Please see our Spotlight section ‘Connections to Europe’ for our view of DM demand, including industrial customers
Interconnector export demand • The weather – cold weather usually means that demand increases as offices and
factories require more heat
• Prices – we are all seeing increasing energy costs and this, conversely, may lead to
Table 2a
reduced demand levels as businesses prioritise their spending
Forecast total gas demand for winter 2022/23, and weather corrected historical data for
2020/21 – 2021/22. • Economic growth – the level of demand for industrial and commercial use will be
2020/21 2021/22 2022/23 related to the level of activity in the economy
Winter demand (bcm)
weather corrected forecast
Electricity generation
Non-daily metered (NDM) 30.3 29.7 28.2 • The level of renewable generation – when the wind blows and/or the sun shines,
electricity is generated from renewables. This will increase or decrease the level of
Daily Metered renewable generation, which may have a direct impact on how much gas demand is
4.4 4.0 3.8 required for electricity generation
(DM, excluding Generation)
• The level of electricity exports to continental Europe – if there are significant exports of
NTS power generation 11.0 10.1 12.3 electricity to Europe, it is likely there will be additional gas demand for electricity
generation.
Island of Ireland 3.0 2.8 3.2 Island of Ireland
• Continuing declines in production from the Corrib gas field off the Irish coast may
mean that we see demand increase.
National Grid 1805 Supply this winter Including supply forecasts and additional detail relating to LNG and storage
Supply range and capability
Supply sources to GB continue to be diverse and flexible. Our network has             The observed range of supply for winter 2021/22, and the range of supply that we
sufficient physical capability to accept gas from each of these sources in            could see at each of the supply sources for the coming winter is shown in Figure 3.
response to how the market chooses to balance demand and supply (Table
3).
Gas from UKCS and Norway continue to be the main source of supply to GB,
with LNG, GB storage, and the European interconnectors providing flexible                    Figure 3
                                                                                             Comparison of actual ranges of supply capability (mean flow indicated by labelled yellow
supplies to meet total demand.                                                               bars, and Table 3) from last winter, against projected ranges over winter 2022/23.
It is difficult to forecast exactly which type of supply will turn up on any given           160
day. This is because flexible supplies are price driven and the pattern of
historical behaviour we’ve observed in the past has been impacted by several                 140
risks and uncertainties this winter due to the wider geo-political climate.
                                                                                             120
The next few pages will provide a focus on the sources of supply we expect
                                                                                                                        104
to flex the most over the winter period.                                                     100      93

                                                                                     mcm/d
    Table 3
                                                                                              80
    Actual and projected supply ranges for winter 2021/22 and winter 2022/23.                                                                                 63
                                                                                              60
                                              2021/22               2022/23

        Winter supply (mcm/d)            actual                                               40
                                                        mean    projected range
                                         range
                                                                                              20                                                                                11
     UKCS                                75-110          93          68-117                                                                 3
     Norway                              62-121         104          34-141                    0
                                                                                                    21/22     22/23    21/22    22/23    21/22     22/23    21/22    22/23    21/22     22/23
     Continental Europe                   0-32           3           0-125                          actual    range    actual   range    actual    range    actual   range    actual    range
     LNG                                  7-121          63          5-141                               UKCS             Norway           Continental
                                                                                                                                              BBL            Continental
                                                                                                                                                                LNG               Storage
                                                                                                                                                                                    LNG
     Storage                              0-59           11          0-117                                                                  Europe            Europe

National Grid                                                                                                                                                                               20
A focus on liquefied natural gas
Great Britain has one of the largest re-gasification capabilities in Europe,
and we have witnessed higher than average LNG supplies flow into GB
so far this year. These have enabled significant exports to continental
Europe, supporting European targets to fill storage stocks ahead of Figure 4
winter. Historical cumulative annual LNG supply flows for the past five calendar years and 2022 (to-date)
LNG (along with the interconnectors) has the greatest potential to
respond when GB demand is high. Last year we observed: 20
• A mean daily total LNG flow of 63 mcm/d 18
• A maximum daily total of 121 mcm/d. 16
The peak possible daily LNG supply for this coming winter remains 14
at 141 mcm/d, however actual flows will be determined by global markets.
12
Analysis by Mike Fulwood, Senior Research Fellow at the Oxford Institute
bcm
for Energy Studies, suggests that the flow of flexible LNG into the EU and 10
GB in 2022 so far is likely to continue, even in a cold winter, in the
absence of a dramatic rebound in Asian demand for LNG. GB is 8
especially well placed to receive LNG if NBP prices are competitive, with 6
more than enough spare capacity in our LNG import terminals, compared
to the import terminals in Northwest Europe which are running at very 4
high utilisation levels.
2
Similarly, a market-based report produced by Baringa indicates that the
volumes of uncommitted flexible cargoes of LNG should be sufficient to 0
meet GB demand, subject to GB successfully securing such volumes by Jan Feb Mar Apr May Jun Jul Aug Sep Oct Nov Dec
paying a sufficiently high price. 2017 2018 2019 2020 2021 2022
National Grid 21A focus on storage
Storage facilities connected to the NTS continue to be predominantly fast
cycle, with the potential to both increase to maximum stock levels in a small
number of days, and export large volumes of gas onto the NTS within short
time periods.
The amount of gas in GB storage at the start of winter 2022/23 is at the high
Figure 5
end of the five-year average (as shown in Figure 5). Storage levels have
GB storage stock levels from October 2017 – September 2022.
remained comparatively high compared to previous years and have refilled
quickly over the summer period when there has been less demand on the NTS. 1,800
1,600
European storage levels as a whole are also in a positive position ahead of
winter, having met their target of 80% storage fullness earlier than expected. 1,400
More information is available in Spotlight: connections to Europe. 1,200
Last year, we observed that: 1,000
• Storage facilities acted as expected, providing supplies onto the NTS in 800
response to market signals 600
• Increased deliveries of LNG supported the replenishment of storage stocks 400
in January
200
0
NB: we are aware of the Rough storage site resuming partial operation. Rough
injection and withdrawal numbers have not been included in this publication.
2017/18 2018/19 2019/20 2020/21 2021/22
National Grid 2206 Spotlight: Connections to Europe
Figure 7
      The European context                                                                             Russian pipeline imports to Europe (bcm/month).
                                                                                                       16
      Russian gas flows to North West Europe have now fallen to zero with the closure of
      the Nordstream 1 pipeline. Flows are not expected to recover this winter given recent            14
      reports of damage to both Nordstream pipelines in the Baltic Sea.
      Until the cancellation of European buyers contracts from Q2, Russian gas flows via               12
      Nordstream 1 had been fairly steady, operating at close to its 55bcm/yr. capacity level,
                                                                                                       10
      but a sharp drop in flows took place in July ahead of the pipeline’s maintenance. Flows

                                                                                                 bcm
      have continued to decline until the pipe was halted at the end of August with Gazprom
                                                                                                        8
      citing a lack of parts due to sanctions. Gazprom has the ability to re-route contracted
      flows to European buyers via other routes, but has opted not to do so. Overall,                   6
      Russian pipe supply to Europe is currently around 20% of the 2020 gas year average
                                                                                                        4

                                                                                                        2
       Figure 6
       LNG imports to Europe (bcm/month).                                                               0
      18                                                                                                    Jan-20 Apr-20 Jul-20 Oct-20 Jan-21 Apr-21 Jul-21 Oct-21 Jan-22 Apr-22 Jul-22
                                                                                                                                   North West Europe       Rest of EU
      16
      14                                                                                                LNG imports into Europe have significantly increased to help fill the gap from a drop in
                                                                                                        Russian gas supply. Year to date imports of LNG to Europe have amounted to
      12                                                                                                ~90bcm, up from ~50bcm imported during the preceding period. Over 45bcm of LNG
                                                                                                        has been imported into North West Europe’s LNG terminals, double the volume of the
bcm

      10                                                                                                previous year, with many running at above nameplate capacity for most of the
       8                                                                                                summer.
                                                                                                        Nearly 20bcm of additional LNG import capacity is expected to be bought online this
       6
                                                                                                        winter across North West Europe. The Eemshaven Floating Storage and
       4                                                                                                Regasification Unit (FSRU) in The Netherlands has already started receiving cargoes
                                                                                                        while Germany’s Brunsbuettel FSRU is expected to receive its first cargo from the
       2                                                                                                UAE in Q1 2023.
       0                                                                                                The impact on GB of this additional import capability in Europe is uncertain. On the
           Jan-20 Apr-20 Jul-20 Oct-20 Jan-21 Apr-21 Jul-21 Oct-21 Jan-22 Apr-22 Jul-22                 one hand, it may increase competition for scarce LNG spot cargoes; on the other, it
                          North West Europe    Iberia   Other Europe     UK                             should provide additional resilience to European gas supply and therefore increase the
                                                                                                        likelihood of interconnector imports to GB.
      National Grid                                                                                                                                                                          24
8
Impact on interconnector flows Figure 9
Continental Europe export levels for 2020/21 and 2021/22.
We have seen record levels of interconnector exports to continental Europe over 2.5
recent months (see figure 9). The rise in exports of gas from GB to Europe is largely
due to the impact of reduced gas flows from Russia, combined with Europe’s target to 2
have storage stocks 80% full by 1 November.
The supply constraints and demand levels being observed in Europe have caused the 1.5
market to respond as expected, with the price of gas in Europe higher than the prices
bcm
seen in GB, causing additional flows to be directed into continental Europe.
1
We expect exports to continue to be higher than usual during the early part of this
winter. This is evident in the exit capacity bookings for this winter when compared to
the previous winter (see figure 8). 0.5
0
Oct Nov Dec Jan Feb Mar Apr May Jun Jul Aug Sep
Figure 8
Bacton exit capacity bookings 2020/21 2021/22
1.50 Figure 10
Continental Europe import levels for 2020/21 and 2021/22.
1.25 3
1.00 2.5
bcm
2
0.75
bcm
1.5
0.50
1
0.25
0.5
0.00
Oct-22 Nov-22 Dec-22 Jan-23 Feb-23 Mar-23 0
2021/22 2022/23 Oct Nov Dec Jan Feb Mar Apr May Jun Jul Aug Sep
National Grid 2020/21 2021/22 258 Figure 11
Implications for this winter European Storage levels per year from April 2017 to September 2022
100
During winter, the GB market relies on flexible supplies (LNG and imports from 90
continental Europe, as well as additional flows from Norway) on higher demand 80
days. Over the past five winters, imports from continental Europe have 70
contributed an average of around 6% of total supply. 60
%
50
Gas flows between GB and continental Europe are price-driven, with gas flowing 40
to the market where the price is highest.
30
Whilst there is still significant uncertainty around the impacts of further disruption 20
of supplies to continental Europe, there are several factors that may positively 10
influence the ability of GB to import gas from continental Europe: 0
• Whilst prices have been high and volatile, the market has continued to
function, directing supply to where the price is highest. As shown in figure 12,
17/18 18/19 19/20 20/21 21/22 22/23
there is a strong correlation between price differential and interconnector
flows. Figure 12
• European storage stocks are currently over 80% full, having met their target NBP-TTF price differential compared to European interconnector flows
earlier than expected (see figure 11).
• The EU have reached an agreement on a voluntary reduction of natural gas 20
Net imports
40
NBP > TTF
NBP - TTF differential (p/therm)
demand by 15% between August and March, in light of the disrupted flows of
Net European Interconnector
10 20
gas from Russia. This agreement becomes mandatory if a supply alert is
triggered. 0 0
imports (mcm/d)
• Import and export capacity are currently being booked and sold on both
-10 -20
interconnectors, suggesting that the market is preparing for both imports and
exports over winter. -20 -40
Argus Media Ltd is the source of the price data contained in figure 12 which National Grid has produced. National Grid
obtains data from Argus Media under licence, from which data National Grid conducts and publishes its own
-30 -60
calculations. Argus makes no warranties, express or implied, as to the accuracy, adequacy, timeliness or
completeness of its data or National Grid’s calculations, or fitness for any particular purpose. Argus shall not be liable -40 -80
for any loss or damage arising from any party’s reliance on Argus’ data or National Grid’s calculations, and disclaims NBP < TTF Net exports
any and all liability relating to or arising out of the data and/or calculations to the full extent permissible by law. Any -50 -100
opinions expressed are those of National Grid and are not approved by Argus and do not (necessarily) represent
Argus’ position or views.
1 October 2021 to 31 March 2022
National Grid Day-ahead price differential, NBP-TTF Net flows
2607 Supply Margins Peak day Cold day
Introduction
Capability
The GB gas network has significant flexibility in its infrastructure, with a
potential capability in excess of the anticipated peak demand that can be
reasonably assumed during the winter period.
Market participants utilise this flexibility to deliver gas to a variety of supply
points across the network, to match supplies to the expected demand level
on any given day.
The charts on the following pages illustrate the supply capability for each
of the supply components and the supply margin against peak day and
cold day.
NB: as a consequence of how our network *     has evolved due to changing
supply patterns over the years, it is not possible to achieve the maximum
deliveries of continental European imports and LNG deliveries at the same
time for the Bacton and the Isle of Grain terminals. Our figures have been
adjusted to reflect this.
Commodity
The capability of the National Transmission System (NTS), as described
above, does not equate to the physical flow of gas (the commodity), which
we do not have control over. The price and source of supply that is
delivered each day is driven by market participants and the global market.
The charts shown on the following pages refer to capability, not
commodity.

National Grid                                                                        28
Peak day supply margin
 Forecast 1-in-20 peak demand has reduced by 22 mcm/d to 483 mcm/d. Expected
 reductions in domestic and industrial demand in response to higher prices have
 been partially offset by higher demand for gas for power generation.
 Peak supply is at a similar level to last winter, although we now expect LNG to form              Figure 13
 a higher proportion of imported supply given the impact of reduced Russian                        Peak day, N-1 largest loss supply and demand totals and margins, for the 2022/23 winter
 supplies to continental Europe and resultant lower imports via the interconnectors.               700
 The margin between forecast peak supply and 1-in-20 peak demand for winter                                     605 mcm/d
                                                                                                   600
 2022/23 is 122 mcm/d compared to a margin of 104 mcm/d last winter. (Figure 11,                                                              533 mcm/d
                                                                                                                     89
 Table 4).                                                                                                                                                                                         122
                                                                                                   500                                            89                         483 mcm/d   50
 Under N-1 conditions (an event resulting in the loss of the single largest piece of                                117                                                          29
 NTS infrastructure) the supply margin at peak 1-in-20 demand has increased from                   400                                                                          97

                                                                                           mcm/d
                                                                                                                                                  117
 last winter to 50 mcm/d.                                                                                                                                                       35
                                                                                                                    141
                                                                                                   300                                            69

                                                                                                   200              141                           141
Table 4                                                                                                                                                                         321
Peak day, N-1 largest loss supply and demand totals and margins, for the 2022/23                   100
winter                                                                                                              117                           117
 Forecast (mcm/d)                                   2021/22                2022/23                   0
                                                                                                                Peak supply               Peak Supply (N-1)              Peak demand*
 1-in-20³ peak demand                                505                      483
 1-in-20 non-storage supply                          492                      488
                                                                                                   UKCS                                              Norway
 1-in-20 storage supply                              117                      117                  LNG                                               Storage
                                                                                                   Continental Europe                                Non-daily metered
 Total 1-in-20 supply                                609                      605                  Daily metered (excluding NTS generation)          NTS power generation
                                                                                                   Exports to Ireland
 1-in-20 supply margin                               104                      122
 N-1 largest loss                                    -72                      -72                   *Peak day total demand contains shrinkage and therefore will not tally

 N-1 supply margin                                    32                      50
³The 1-in-20 peak day demand is a level of daily demand that in a long series of winter,
with connected Grid
 National      load held at the levels appropriate to the winter in question, would be                                                                                                        29
exceeded in 1 out of 20 winter, with each winter counted only once.
Cold day supply margin
The Cold day is more representative of the likely level of demand on a very cold
winter’s day than the peak 1-in-20 demand.
Forecast Cold day gas demand has increased by 20 mcm/d to 440 mcm/d. This Figure 14
Cold day supply and demand totals and margins, for the 2022/23 winter
shows that reductions in demand due to higher prices (estimated impact of
21mcm/d based on domestic properties turning their thermostat down by half a 600
degree) have been more than offset by higher demand due to power generation.
The margin between forecast Cold day supply and Cold day demand for winter 500 481 mcm/d
2022/23 is 41 mcm/d compared to a margin of 71 mcm/d last winter. (Figure 14, 75 440 mcm/d 41
Table 5). 27
400
78
mcm/d
94
32
300
Table 5 104
Cold day supply and demand totals and margins, for the 2022/23 winter
200
Forecast (mcm/d) 2021/22 2022/23 110 301
Cold day demand⁴ 420 440 100
Cold day non-storage supply 397 387 98
Cold day storage supply 94 94 0
Cold day supply Cold day demand
Total Cold day supply 491 481 UKCS Norway
LNG Storage
Cold day supply margin 71 41 Continental Europe Non-daily metered
Daily metered (excluding NTS generation) NTS power generation
⁴The supply of demand for the coldest day in an average (or seasonal normal) winter. The Exports to Ireland
Cold day is taken as day 1 of the Average Load Duration Curve, this is not a forecast
based upon current conditions. It is based on historic data over the period 1960 – 2012. * Cold day total demand contains shrinkage and therefore will not tally
National Grid 3008 Supply & Demand scenarios
Our demand scenarios
In light of the high level of uncertainty over demand and supply this
winter, this year’s Winter Outlook presents three scenarios that illustrate
how the National Transmission System could be balanced under a
range of credible demand profiles.
                                                                                         Figure 15
It is important to note that none of our scenarios are intended to illustrate            NTS demand range for the last 12 winters with the three scenarios highlighted.
a best or worst case for the forthcoming winter. The aim is to provide a
range of scenarios that highlight the extent to which flexible sources of                500
supply are available to GB to meet different demand levels.                              450

The chart to the right shows the range of NTS demands experienced                        400

                                                                                 mcm/d
over the last 12 winters, represented by the grey shaded area.                           350
Highlighted on this chart are our three demand scenarios, as
summarised in the table below.                                                           300

                                                                                         250

   Scenario                               Rationale                                      200
  Scenario 1:     We have chosen demands from winter 2019/20 as being                    150
 typical winter   representative of the daily demand we would experience
   (2019/20)      in a typical winter.                                                   100
                                                                                                                         Winter (1 October – 31 March)
                  We have chosen demands from winter 2010/11 as
  Scenario 2:     representative of a cold winter, as this period contains the
  cold winter     highest-ever daily gas demand level seen on the NTS,
   (2010/11)      with sustained high demands throughout the majority of
                  the winter.
                  We have chosen demands from winter 2017/18 as
  Scenario 3:     representative of demand levels during an extreme cold
   cold snap      snap as this period contains the ‘Beast from the East’
   (2017/18)      which resulted in some of the highest daily demand
                  levels seen in the last five years.
National Grid                                                                                                                                                             32
How we’ve defined our demand scenarios
How have we defined typical and cold demand? Figure 16
The normal distribution of temperature (expressed as CWV) in the UK from 1992 to 2022.
The demand profile on the GB gas network has changed dramatically 1
since natural gas was first introduced in 1972, and as such it is not Cold Warm
possible to use historic demand levels to categorise our different 0.9 In last 30 years, only In last 30 years, only
10% of winters have 10% of winters have
scenarios.
been this cold been this warm
0.8
During the winter period, the majority of GB gas demand has historically
been driven by domestic gas central heating and therefore is highly 0.7
influenced by the weather, particularly temperature. The Composite
Probability
Weather Variable (CWV) is a single measure of weather which takes into 0.6
account the actual temperature, wind speed, effective temperature and
seasonal normal effective weather and has a linear relationship with 0.5
domestic gas demand. By taking recent winters with supply/demand
conditions and infrastructure similar to the current environment we are able 0.4
to display them against historic winter CWVs to define cold and mild
scenarios. 0.3
The chart to the right (figure 16) illustrates the distribution of temperature in 0.2
the UK from 1992 to 2022, expressed as a function of the CWV.
0.1
• Our typical winter scenario is within the top 50% of winter temperatures
that have been observed over the previous 30 years and was 0
experienced in 2019/20. 4 5 6 7 8
• Our cold snap scenario is generally close to the mean temperature Temperature (CWV)
observed over the previous 30 years, but contains a short cold period
experienced in 2017/18. CWV distribution 10th percentile 50th percentile
• Our cold winter scenario is within the coldest 10% of the previous 30 90th percentile Cold winter (2010/11) Cold snap (2017/18)
winters and was experienced in 2010/2011.
Typical winter (2019/20)
National Grid 33Our modelling assumptions - demand
Our scenarios are based on actual historical demand data, to provide a realistic level of variability due to weather and other factors. To make our
scenarios as relevant as possible, we have made several adjustments to these historic demand numbers to reflect the expected situation for this
winter, particularly in respect of the impact of higher gas prices and the likelihood of higher exports of electricity to continental Europe.
Please see our ‘Continental Europe imports/exports’ assumptions on the next slide for our view of Interconnector export demand
Non-daily metered demand (domestic properties and small to medium-sized industrial premises) has been reduced by 6%,
Non-Daily equivalent to all properties turning down their thermostats by half a degree in response to higher prices. This assumption
Metered was included in the Consumer Transformation scenario in this year’s Future Energy Scenarios publication. We recognise
Demand that recent government intervention has been announced to mitigate the impact of higher prices on domestic and business
consumers, but we believe it is still reasonable to expect some element of price response in consumer demand this winter.
LDZ daily metered demand (such as large commercial and industrial premises) has been reduced by 6%, reflective of the
LDZ Daily
actual reduction in demand that we have observed over the past 12 months. We recognise that recent government
Metered
intervention has been announced to mitigate the impact of higher prices on domestic and business consumers, but we
Demand
believe it is still reasonable to expect some element of price response in consumer demand this winter.
NTS industrial demand has been reduced by 43%, reflective of the actual reduction in demand that we have observed over
NTS Industrial
the past 12 months. We expect a larger reduction in this sector of demand as energy is a much higher proportion of these
Demand
users’ costs.
We expect higher levels of electricity exports from GB to France this winter, driven by planned nuclear outages and high
European market prices. We have modelled the impact of this by converting all actual electricity interconnector exports to
continental Europe in the 2019/2020 winter to an equivalent gas volume. This represents a relatively high case and could
be regarded as an upper bound on the likely increase in gas demand.
NTS Power The GB generation landscape has changed considerably since 2010/2011 with a significant increase in renewable
generation capacity and some gas generation moving from baseload to providing flexibility. We have therefore used the
adjusted power demand for 2019/2020 in both the typical winter and cold winter scenarios. While this does not make a
specific adjustment for the colder weather in 2010/2011, as described above we consider our modelling assumption
National Grid 34
provides a credible upper bound for generation demand this winter.Our modelling assumptions - supply
Due to the complex global economic factors involved, no one can predict precisely how the GB and global markets will behave
throughout winter. However, based on historical GB market behaviour and our knowledge of market operation, we can outline In summary, our scenarios seek to
the potential order in which supplies may respond to balance the NTS in different situations. achieve a network balance in the
Our key assumptions, which underpin our scenario analysis, are as follows: following manner:
We expect the drivers that will influence both UKCS and Norwegian supplies this winter will be very similar to
last winter. In particular, high prices will continue to incentivise both sources to maximise production; and high Supply Surplus
UKCS and
European prices will incentive Norwegian supplies to maximise supply to continental Europe in preference to
Norway
GB. We have therefore used historical data from last winter (2021/22) for both UKCS and Norwegian supplies In the event the NTS is over-
to build some natural variability into our scenarios and represent a likely supply profile for this winter. supplied, gas is presumed to be
injected into GB storage and/or gas
In line with historic behaviours, we have assumed that GB storage will act as a short-term balancing source of exports to continental Europe will
supply, with withdrawals increasing to meet periods of higher demand or responding to unforeseen supply increase, before LNG supplies are
GB reduced.
interruptions. Storage sites typically maintain stock levels in the earlier part of the winter by limiting delivery, or
Storage
taking advantage of lower demand periods to restock their storage position. We have assumed GB storage
will re-fill when there is a GB supply surplus.
Supply Deficit
We assume LNG supplies will increase throughout the winter period based on overall GB demand and act as
the primary supply-side balancing mechanism. The potential for reduced imports from continental Europe In the event the NTS is under-
LNG
would necessitate increased LNG supplies, all other factors being equal. The reverse is true whereby imports supplied, it is presumed there will
from continental Europe will reduce GB reliance on LNG. be an increase in storage
withdrawal and LNG deliveries,
whilst reducing any continental
Typically, the behaviour of the European interconnectors is price sensitive and therefore highly flexible. We Europe exports, prior to requiring
Continental assume a continuing drive for exports from GB to continental Europe throughout the first half of winter when
Europe continental Europe imports and
Imports /
there is a supply surplus in GB. Should GB require gas imports beyond the levels that can be fulfilled by LNG, maximising storage withdrawal.
exports we assume the market will respond accordingly and create the required pricing signals for continental Europe
to export to GB.
National Grid 35Winter supply and demand Peak Day capability
Visualising winter 650 650
600 600
We are presenting additional charts and data this year
relating to our scenarios and assumptions. The visual aids to 550 550 89
the right have been created to explain how we are presenting 500 500
our scenarios. Please note that the tables and charts on this 450 450 117
page contain simulated data for illustrative purposes only and
400
do not represent any of our Winter Outlook scenarios. 400
mcm/d
350
Winter supply and demand 350
300 141
Illustrates the demand profile for the entire winter period 300
(dark blue line), with the volume of each supply source used 250
250
to meet this demand illustrated below it. 200
200 141
Peak Day capability 150
150
Each winter supply and demand chart is compared with the 100
Peak Day capability forecast. This allows you to compare the 100
50
modelled supply and demand chart levels with the full 50 117
potential supply capability. 0
Winter (1st October – 31st March) 0
Peak Day
Demand table UKCS Norway LNG Storage Continental Europe NTS demand capability
Provides a trace between the historic actuals for the base
demand scenario, and the aggregate impact of the Demand table Supply table
adjustments made for the impact of gas prices and higher Total winter demand (bcm)
Type Total winter supply Utilisation
levels of gas for electricity generation. Base year Change Scenario x Source
bcm % (%)
Supply table Non-daily UKCS 16.9 29 79%
36 - 2 34
Illustrates the aggregate volume of supply from each source metered Norway 18.8 32 73%
for that scenario and the percentage of the total supply. Daily metered 5 0 5 LNG 19.3 33 75%
Percentage utilisation is calculated as the average daily NTS power Continental
11 +3 13 2.2 4 10%
supply divided by the peak day capability, except for storage generation Europe
where utilisation is calculated as total withdrawals divided by Continental Storage 1.8 3 118%
1 +3 4
Europe GB Total 59.0
total working gas volume across all of the sites (excluding
Ireland 3 - 1 2
Rough).
Total 56 +3 59
National Grid 36Scenario 1: typical winter, increased gas Table 6
Total winter demand in scenario 1.
for power, European imports minimised Type
Total winter demand (bcm)
2019/20 Change Scenario 1
This scenario is based on the consumption demand experienced in the 2019/20 winter.
We have applied a reduction to the level of NDM and DM demand to reflect the impact of Non-daily metered 30.9 -2.6 28.3
the increased price of gas this winter. Power generation demand has been increased by Daily metered 4.5 -0.3 4.2
assuming no electricity interconnector imports are available. NTS power generation 10.6 +3.1 13.7
In line with prevailing forward price differentials, we have assumed exports to continental Continental Europe 0.5 +3.2 3.7
Europe in October and November, with the volume of export shown in table 6. Ireland 2.6 0.0 2.6
This scenario illustrates a level of LNG supply that could be required to achieve a supply- Total 50.5* +3.4 54.0*
demand balance in winter with a typical weather profile, and elevated demand for gas for *Total demand includes storage injection so values will not tally. Change does not include storage
power, without requiring any imports from continental Europe. injection difference.
Figure 17 Table 7
Scenario 1 supply and Peak Day capability. Total winter supply and utilisation of peak capability.
650 Total winter supply (bcm) Utilisation
Source
bcm % (%)
600
89 UKCS 16.9 31 79%
550
Norway 18.8 35 73%
500
LNG 15.9 29 62%
450 117
Continental Europe 0.0 0 0%
mcm/d
400 Storage 2.4 4 157%
350 GB Total 54.0
141
300
250 Key Observations:
200 141 • European imports are not required in this typical winter scenario if
150 sufficient alternate flexible supplies come to GB. Our scenario prioritises
100 LNG supplies to illustrate a level of supply that is elevated compared to
recent Winters, but well within system capability.
50 117
• The volume of LNG required to balance the scenario could be reduced by
0 higher supplies from UKCS or Norway, or by lower levels of exports
Winter (1 October – 31 March) Peak Day earlier in the winter.
capability • GB storage is utilised throughout the winter to meet higher demands.
National UKCS
Grid Norway LNG 37
Storage Continental Europe NTS demand Periods of lower demand provide the opportunity for GB storage to refill.Scenario 2: cold winter, increased gas
Table 8
for power, European imports minimised Total winter demand in scenario 2.
Total winter demand (bcm)
This scenario is based on the consumption demand experienced in the 2010/11 winter. We Type
have applied a reduction to the level of NDM and DM demand to reflect the impact of the 2010/11 Change Scenario 2
increased price of gas this winter. Power generation demand has been increased by Non-daily metered 34.6 -1.9 32.7
assuming no electricity interconnector imports are available. Daily metered 5.8 -1.1 4.7
In line with prevailing forward price differentials, we have assumed exports to continental NTS power generation 12.5 +1.2 13.7
Europe in October and November, with the volume of exports shown in table 8. Continental Europe 2.1 +1.3 3.4
This scenario illustrates that in a very high demand winter, imports from continental Europe Ireland 3.6 0.0 3.6
may be required to achieve a supply-demand balance. In such a scenario, in which GB Total 60.4* -0.5 59.4*
prices would need to show a premium to those at European hubs to incentivise imports, we *Total demand includes storage injection so values will not tally. Change does not include storage
would also expect to see a response from other sources, particularly Norway. injection difference.
Figure 18
Table 9
Scenario 2 supply and Peak Day capability.
Total winter supply and utilisation of peak capability.
650
Total winter supply (bcm) Utilisation
600 Source
bcm % (%)
550 89
UKCS 16.9 31 79%
500 Norway 18.8 35 73%
450 117 LNG 20.6 35 80%
mcm/d
400 Continental Europe 0.8 1 4%
350 Storage 2.2 4 144%
141
300 GB Total 59.4
250
Key Observations:
200 141
150 • Additional flexible supplies are required in this cold weather scenario to
supplement LNG, which reaches maximum capability on several days
100
during the winter.
50 117
• The volume of European imports shown could be reduced by higher
0 supplies from UKCS or Norway, or by lower levels of exports earlier in the
Winter (1 October – 31 March) Peak Day winter.
National Grid capability • GB storage is utilised throughout the winter to meet higher demands. 38
UKCS Norway LNG
Periods of low demand provide the opportunity for storage to refill.
Storage Continental Europe NTS demandYou can also read