Freeze/Thaw Resistance of Mortar with Recycled Tyre Waste at Varying Particle Sizes
←
→
Page content transcription
If your browser does not render page correctly, please read the page content below
materials
Article
Freeze/Thaw Resistance of Mortar with Recycled Tyre Waste at
Varying Particle Sizes
Riccardo Maddalena

                                            School of Engineering, Cardiff University, Cardiff CF24 3AA, UK; maddalenar@cardiff.ac.uk

                                            Abstract: There is a growing concern for finding alternative solutions to construction materials in
                                            order to minimise their environmental impact as well as enhancing their service life. This study
                                            investigated the durability of cementitious mortars prepared by replacing fine aggregate (sand) with
                                            recycled tyre shreds and crumbs, aiming at providing an alternative outlet to tyre waste disposal.
                                            Tyre shreds obtained at different particle sizes, from fibres of 0.5–5.0 mm to crumbs of 0.1–0.85 mm in
                                            diameter, were used as fine aggregate replacement at 20% by volume. The strength of the mortar
                                            samples, their thermal conductivity and their water absorption rate were tested at the age of 28 days
                                            and after 20 freeze/thaw cycles. The results showed that the mortar containing tyre crumbs at lower
                                            particle sizes resulted in negligible shrinkage, improved freeze/thaw resistance, a reduced water
                                            absorption by up to 52% and an improved thermal resistivity.

                                            Keywords: mortar; sorptivity; freeze/thaw damage; recycled tyre

                                            1. Introduction
                                                  It is estimated that approximately 1.5 billion waste tyres are disposed of annually, and
                                            this trend is likely to double in the next 10 years, contributing to a world-wide threat known
                                            as ‘black pollution’ [1,2]. Rubber tyres are made of carbon black, elastomers and additives
                                            and are reinforced by steel fibres. While efforts have been made in recovering carbon black
                                            and fibres from waste tyres, their recovery is otherwise energy-intensive [3,4]. However,
Citation: Maddalena, R.
                                            tyre waste can be reused as fuel for the production of electricity as well as materials
Freeze/Thaw Resistance of Mortar            for civil engineering applications, such as road construction, concrete manufacturing
with Recycled Tyre Waste at Varying         and bituminous composites [5,6], providing an alternative outlet to such waste, which is
Particle Sizes. Materials 2023, 16, 1301.   otherwise disposed of in landfill. With the current exponential increase in the demand
https://doi.org/10.3390/ma16031301          for construction materials, namely concrete, repurposing end-of-life rubber tyres will not
                                            only contribute to diverting millions of waste tyres from landfill disposal but it will also
Academic Editors: Jin Yang and
                                            contribute to the production of sustainable construction materials by reducing the amount
Xingyang He
                                            of natural resources (sand and aggregate) that is extensively used to produce concrete [7,8].
Received: 21 December 2022                        In construction materials, tyre rubber crumbs have been investigated as a replacements
Revised: 28 January 2023                    for fine aggregate in conventional concrete as well as in high-performance concrete and
Accepted: 1 February 2023                   alkali-activated systems [9–11]. Comprehensive review papers on rubberised concrete
Published: 3 February 2023                  and mortar illustrated that whilst the addition of rubber tyres particles may reduce the
                                            mechanical strength, depending on the aggregate replacement levels, there are beneficial
                                            effects such as abrasion resistance, improved durability and carbon-cost savings in the
                                            provision of sustainable construction materials [12–17].
Copyright:    © 2023 by the author.
                                                  Ince et al. (2022) investigated the replacement of fine aggregate in concrete with up
Licensee MDPI, Basel, Switzerland.
                                            to 10% by volume of tyre rubber (particle size 0.25–0.50 mm), showing a reduction in
This article is an open access article
                                            compressive strength by 35% [18]. However, when rubber particles were treated with
distributed under the terms and
conditions of the Creative Commons
                                            NaOH, their adhesion to the cementitious matrix was improved and led to an increased
Attribution (CC BY) license (https://
                                            strength and a mitigated alkali–silicate reaction [19–21]. On the contrary, their thermal
creativecommons.org/licenses/by/            resistivity performs better with untreated rubber, as it leads to a more porous matrix.
4.0/).

Materials 2023, 16, 1301. https://doi.org/10.3390/ma16031301                                                 https://www.mdpi.com/journal/materials
Materials 2023, 16, 1301 2 of 14
The effect of the adhesion and interfacial bonding between rubber particles and a
cementitious matrix was investigated by Huang et al. (2020), where a macro-porosity theory
was proposed to assess the strength reduction factor as a function of the rubber particle
size and replacement level (up to 80%) [22]. One way to counteract the strength reduction
is by combining rubberised concrete with hybrid fibres; this not only improves the overall
mechanical strength and impact resistance but it also contributes to the sustainability
and circular economy in the building materials sector [23,24]. High levels of aggregate
replacement with rubber crumbs have been investigated in numerous studies [25]. Raffoul
et al. (2016) highlighted the fact that a rubber content of up to 60% of total aggregate (fine
and coarse) is achievable with the use of supplementary cementitious materials (silica fume
and pulverised fly ash) to improve the concrete workability and final strength [26]. On the
other hand, Richardson et al. (2012) found that low levels of replacement of fine aggregate
with rubber crumbs (0.6% by mass) increased the resistance of the concrete to freeze/thaw
attack, with minimal scaling compared to the control concrete specimens [27]. Further
investigations confirmed that the durability factor is highly influenced by the particle
size of tyre crumbs, showing that particles smaller than 0.5 mm offer the maximum frost
resistance [1,28,29].
Whilst the addition of rubber tyre particles results in strength loss, it improves the
overall durability of mortar, reducing the chloride penetration potential by about 35% with
replacement levels at 15% by mass [11]. Other studies have concluded that low percentages
of tyre rubber powder up to 20% can decrease the chloride diffusion coefficient compared
to control specimens, as well as improving the resistance to carbonation [30–32]. The
presence of rubber crumbs also has a favourable effect on the thermal resistivity of concrete
and mortar, suggesting that such waste can be incorporated into cementitious systems for
non-structural applications [17,33,34].
Rubber tyre waste has also been investigated in geopolymers and 3D mortar printing.
Rubber particles in alkali-activated cementitious systems showed that a decrease in the
compressive strength at replacement levels up to 20% was coupled with an enhanced dura-
bility when exposed to sulphate attacks and an improved energy dissipation [10,35]. Such
applications have also shown to be promising in carbon emissions costing, as geopolymers
are often produced entirely from waste-derived binders [36]. Tyre waste particles and their
gradation have been shown to improve the rheological properties of 3D printed mortar,
increasing the interlayer bond strength and ductility at the expense of a reduction in the
mechanical strength [37,38].
The objective of this study was to assess the effect of the particle size of recycled
tyre crumbs on the freeze/thaw resistance of cementitious mortar. An optimal volume
fraction of 20% of either rubber shreds or crumbs with a decreasing particle size was
chosen. The effect of the varying particle sizes on the physical properties of the mortar
samples was evaluated, as well as their strength and shrinkage. The freeze/thaw resistance
was investigated by comparing the mechanical strength and physical properties (water
transport and thermal conductivity) of the mortar specimens before and after exposure to
freeze/thaw cycles.
2. Materials and Methods
2.1. Materials
Portland limestone cement CEM II/A-L 32.5R was used as the binder. River sand,
sieved to a diameter of 2.0 mm, was used as the fine aggregate. Cement and sand were
mixed using an orbital mixer at a ratio of 1:3 by mass with unit contents of 480 kg/m3
and 1440 kg/m3 , respectively, and with a water-to-cement (w/c) ratio of 0.5 (240 kg/m3 ),
following the mixing procedure outlined in BS EN 196-1:2016 [39].
Rubber crumbs obtained from the shredding and mechanical grinding of recycled
tyres were supplied by SRC Products Ltd. (Stockport, UK). The shreds and crumbs were
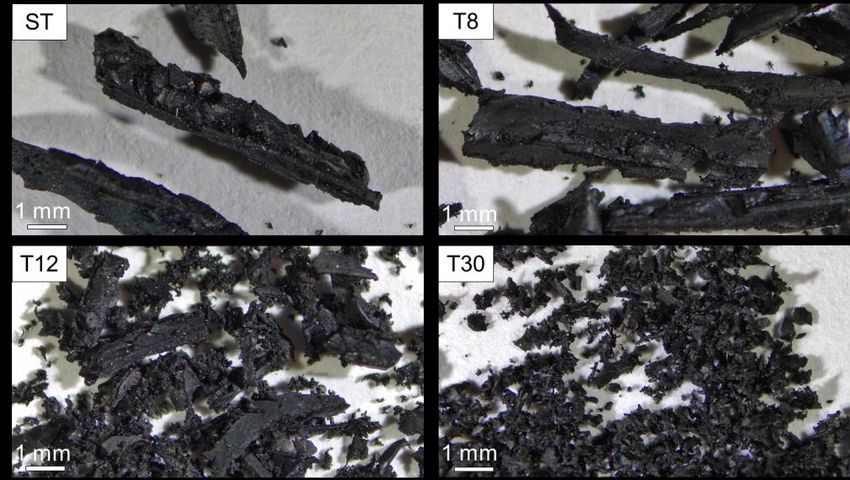
used as received, with no pre-treatment or washing. Four granulate sizes were selected:
coarse rubber shreds (ST), fibres with a typical length of 1.0–5.0 mm and a diameter of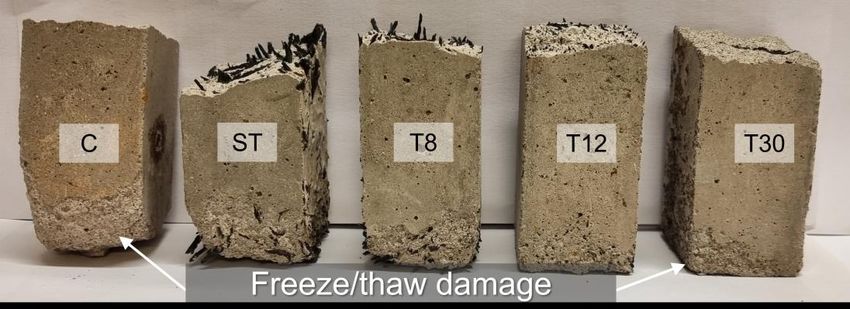
varied with changes in the granulate size.
Table 1. Particle size analysis for recycled tyre crumbs T8, T12 and T30.
Test Sieve T8 T12 T30 Test sieve T8 T12 T30
Materials 2023, 16, 1301 mm % Retained mass mm % Retained mass 3 of 14
3.35 – – 0.71 – 10–25 0–0.1
2.80 0–5 – 0.50 10–30 – –
2.36 0–15 – 0.425 – 10–25
1.0–2.0 mm, fine shreds (T8), acicular granulates with a length of 0.5–2.8 mm and two 0–1
1.70 crumb sizes
granulate 10–30of 0.4–0.85
0–0.5 mm (T12) and 0.15–0.4
0.355 mm (T30), – respectively,
– –
as shown
in Figure
1.181. The particle
– size10–40
analysis for the crumbs T8, T12 and –T30 is provided
0.25 0–5 in40–60
Table 1,
as supplied
1.00 by the40–60
manufacturer.
– The bulk density of the rubber
0.15 – shreds (350–500
– kg/m3 )
25–35
varied0.85
with changes–in the granulate
30–45 size. Pan 0.5 0–5 0–15
Figure
Figure 1.
1. Images
Images ofof recycled tyre rubber
recycled tyre rubber shreds
shreds(ST)
(ST)and
andrubber
rubbercrumbs
crumbs(T8,
(T8,T12
T12and
andT30)
T30)atat differ-
different
ent particle sizes.
particle sizes.
2.2. Methodology
Table 1. Particle size analysis for recycled tyre crumbs T8, T12 and T30.
Five series of mortar specimens were prepared by replacing virgin sand with one of
Test Sieve T8 the four
T12rubber shredsT30sizes at aTest
replacement
Sieve levelT8
of 20% by volume
T12 (74.3 kg/m 3) [1] in
T30
mm series ST, T8,
% Retained massT12 and T30, respectively,
mm and their mechanical, physical and
% Retained mass thermal prop-
erties were compared to a control series (C), without fine aggregate replacement.
3.35 – – 0.71 – 10–25 0–0.1
2.80 0–5 After
– mixing, three samples of0.50 each series were
10–30cast in standard
– prismatic –moulds
2.36 0–15 (160 mm – in length, with a cross-section
0.425of 40 × 40 mm)– with shrinkage
10–25 inserts, demoulded
0–1
1.70 10–30 after 24 h and then cured in water at
0–0.5 20 °C for 28 days.
0.355 – Shrinkage values
– were calculated
–
1.18 – 10–40
by measuring the length of the prisms0.25with a length–comparator device,
0–5 40–60in BS
as detailed
1.00 40–60 –
EN 12390-16:2019 [40]. The length of0.15
the prisms was –recorded upon–demoulding25–35 and after
0.85 – 30–45 Pan 0.5 0–5 0–15
water curing. Samples for thermal conductivity measurements were cast in cylinders (50
mm in diameter and 100 mm in height).
2.2. Methodology
Five series of mortar specimens were prepared by replacing virgin sand with one of
the four rubber shreds sizes at a replacement level of 20% by volume (74.3 kg/m3 ) [1]
in series ST, T8, T12 and T30, respectively, and their mechanical, physical and thermal
properties were compared to a control series (C), without fine aggregate replacement.
After mixing, three samples of each series were cast in standard prismatic moulds
(160 mm in length, with a cross-section of 40 × 40 mm) with shrinkage inserts, demoulded
after 24 h and then cured in water at 20 ◦ C for 28 days. Shrinkage values were calculated
by measuring the length of the prisms with a length comparator device, as detailed in
BS EN 12390-16:2019 [40]. The length of the prisms was recorded upon demoulding and
after water curing. Samples for thermal conductivity measurements were cast in cylinders
(50 mm in diameter and 100 mm in height).
At 28 days, three samples of each series were tested for their flexural strength following
the standard BS EN 196-1:2016. After flexural testing, the six broken halves of the three
prisms for each series were then subjected to compressive strength, porosity and sorptivity
measurements before and after 20 freeze/thaw cycles in saline water, as follows.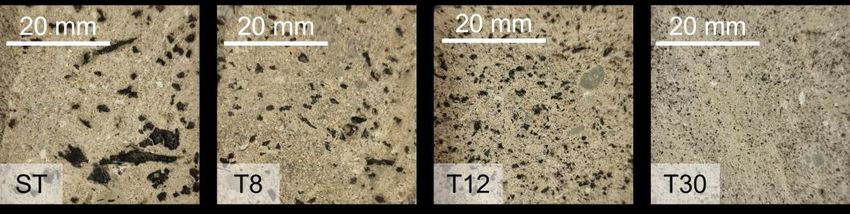
At 28 days, three samples of each series were tested for their flexural strength follow-
                            ing the standard BS EN 196-1:2016. After flexural testing, the six broken halves of the three
                            prisms for each series were then subjected to compressive strength, porosity and sorptiv-
Materials 2023, 16, 1301                                                                                                           4 of 14
                            ity measurements before and after 20 freeze/thaw cycles in saline water, as follows.
                                  Three of the six broken prisms for each series were oven-dried at 60 °C for at least
                            three days or until a stable mass reading was achieved (
3.1. Effect of Rubber Shreds on Strength and Shrinkage
The replacement of virgin sand with the rubber shreds reduced the flexural strength
of the samples by up to 26% compared to the control sample, as reported in Figure 3.
However, the specimens with ST fibres showed a reduction in strength of only 18% from
Materials 2023, 16, 1301 5 of 14
an average of 7.7 MPa for the control series to 6.3 MPa, which was in agreement with the
values found in the literature [50–52]. This was attributed to the ductile behaviour of the
rubber fibres and their aspect ratio (ST fibres) [14]. Decreasing the rubber particle size toFigure 4. Shrinkage of mortar samples at 28 days of curing. The error bars represent the sta
deviation.
A change in the tyre particle shape and size, from the fibres in the ST samples t
acicular-shaped particles in series T8, resulted in an improved shrinkage, which wa
Materials 2023, 16, 1301 6 of 14
proximately 48% lower than the control series, C, and 67% lower than the larger ST f
due to increased bonding with the cementitious matrix and high interlocking a
[54,55]. On the other hand, when the tyre crumbs were ground into granulate crumb
reduced with theshrinkage
reductionreduced
in the particle
with thesize. Series T12
reduction showed
in the an size.
particle improved
Seriesshrinkage
T12 showed of an impr
−188 µm/m (14% lower than the control series C), whilst series T30 showed a shrinkage
shrinkage of −188 µ m/m (14% lower than the control series C), whilst series of T30 sho
up to 90% lowerathan the control one ( − 20 µm/m) due to the lower particle size enhancing
shrinkage of up to 90% lower than the control one (−20 µ m/m) due to the lower pa
the adhesion with
sizethe cementitious
enhancing matrix. with the cementitious matrix.
the adhesion
3.2. Effect of Rubber
3.2. Shreds
Effect ofand Crumbs
Rubber on Freeze/Thaw
Shreds Resistance
and Crumbs on Freeze/Thaw Resistance
The freeze/thaw Theresistance
freeze/thawwasresistance
assessed by was characterising the material’sthe
assessed by characterising microstruc-
material’s micros
ture (porosity and
ture (porosity and density), mechanical properties (compressive absorption
density), mechanical properties (compressive strength), water strength), water ab
rate (sorptivity)tion
andrate
thermal conductivity
(sorptivity) before and
and thermal after exposure
conductivity beforetoand
freeze/thaw cycles.to freeze/
after exposure
A visual inspection of the samples (as reported in Figure 5) showed that after
cycles. A visual inspection of the samples (as reported in Figure 5) showed 20 cycles of that aft
freezing and thawing the addition of rubber shreds and crumbs improved the
cycles of freezing and thawing the addition of rubber shreds and crumbs improveresistance
of the samples to freeze/thaw
resistance of thecycling;
samples thetocontrol mortar
freeze/thaw (C) andthe
cycling; thecontrol
samples in series
mortar ST the sam
(C) and
exhibited the most severe surface damage, including scaling and surface cracks,
in series ST exhibited the most severe surface damage, including scaling and su whereas,
for the samples cracks,
with rubber crumbs
whereas, (series
for the T8, T12
samples withand T30), crumbs
rubber decreasing the T8,
(series rubber
T12particle
and T30), decre
size resulted in an increased resistance to scaling (series T30), which was in agreement
the rubber particle size resulted in an increased resistance to scaling (series with T30), w
previous studieswas[12,28,31].
in agreement with previous studies [12,28,31].
Figure 5. Visual inspection of samples
Figure 5. Visual after exposure
inspection of samplestoafter
freeze/thaw
exposurecycles.
to freeze/thaw cycles.
3.2.1. Compressive Strength
The rubber shreds and crumbs had a clear effect on the hardened mortar at 28 days,
as shown in Figure 6; they reduced the overall strength of the samples, as outlined in
previous studies [7,56]. The samples with rubber shreds (ST) showed a 28-day strength
of approximately 13 MPa (−60% compared to the control specimens). This was due to
the nature of the rubber material as well as its shape, length and hydrophobicity, which
prevented sufficient bonding with the matrix [15,49]. However, increasing the particle
fineness resulted in a better-performing mortar, with a strength of 28 MPa being obtained
when the finer rubber crumbs (T30) were used. Whilst the rubber crumbs affected the
strength of the mortar, they had a beneficial effect on the mechanical strength when exposed
to frost attacks. After the freeze/thaw cycles, the control specimens showed a decrease in
strength of approximately 51% as opposed to an average of 35% when the rubber shreds and
crumbs were used. When concrete and mortar are exposed to freeze/thaw cycles, expansion
and contraction occurs. The presence of the rubber shreds and crumbs provided a hardened
cementitious matrix with air pockets that absorbed the internal damage [8,27]. The lowest
particle size used in T30 provided a better mechanical strength after the freeze/thaw cycling
damage, which was measured at 17 MPa and was comparable to the control mix, C.
Whilst the compressive strengths for series ST, T8 and T12 were significantly lower
than those of the control series C and series T30 (structural strength class), their mechanical
performances before and after the freeze/thaw cycles suggested that the rubberised mortar
and concrete could be used for non-structural civil engineering applications, such as non-
load-bearing elements (walls, hollow blocks, bricks), lightweight concrete, pavements and
road applications (asphalt, road barriers) [34,57–61].the control mix, C.
Whilst the compressive strengths for series ST, T8 and T12 were significantly lower
than those of the control series C and series T30 (structural strength class), their mechani-
cal performances before and after the freeze/thaw cycles suggested that the rubberised
mortar and concrete could be used for non-structural civil engineering applications, such
Materials 2023, 16, 1301 7 of 14
as non-load-bearing elements (walls, hollow blocks, bricks), lightweight concrete, pave-
ments and road applications (asphalt, road barriers) [34,57–61].
Figure6.6.Compressive
Figure Compressivestrengths
strengthsofofseries
seriesC,
C,ST,
ST,T8,
T8,T12
T12and
andT30
T30before
beforeand
andafter
afterfreeze/thaw
freeze/thaw cycles.
cycles.
Theerror
The errorbars
barsrepresent
representthe
thestandard
standarddeviation.
deviation.
3.2.2.
3.2.2.Porosity,
Porosity,Density,
Density,Sorptivity
Sorptivityand
andThermal
ThermalConductivity
Conductivity
The open porosity and density values
The open porosity and density values measured measured forfor
allall
thethe
series were
series weretypical of mortar
typical of mor-
mixes, with the open porosity being in the range of 18–20%, the bulk
tar mixes, with the open porosity being in the range of 18–20%, the bulk density being density being in the
in
range of 1.7–2.0 g/cm 3 and the matrix density being in the range of 2.2–2.5 g/cm3 [62],
the range of 1.7–2.0 g/cm3 and the matrix density being in the range of 2.2–2.5 g/cm3 [62],
as
asshown
shownin inFigure
Figure7.7.The Thedensities
densities(bulk
(bulkandandmatrix)
matrix)werewere6–14%6–14%lower
lowerfor forthe
therubber
rubber
mortars
mortars (series ST, T8, T12 and T30) compared to the control mortar, which was dueto
(series ST, T8, T12 and T30) compared to the control mortar, which was due to
the
thelightness
Materials 2023, 16, x FOR PEER REVIEW lightnessof ofthe
therubber
rubberparticles
particles inin was
was agreement
agreement with with data
data in
in the
the literature
literature [30,63].
8[30,63].
of 15
However,
However,the thefreeze/thaw
freeze/thawcycles did
cycles notnot
did have a significant
have a significantimpact on the
impact onmeasured
the measuredporositypo-
and densities. A slight increase in the density (bulk and matrix) was
rosity and densities. A slight increase in the density (bulk and matrix) was observed after observed after the
freeze/thaw damage (see Figure 7b) due to the formation of cracks and subsequent NaCl
the freeze/thaw
NaCl damageWhilst
salt crystallisation. (see Figure
this was 7b)indue to the formation
contradiction with theofvisual
cracksinspection
and subsequent
of the
salt crystallisation. Whilst this was in contradiction with the visual inspection of the samples
samples shown in Figure 5, where evident damage (scaling and cracks) is visible, the
shown in Figure 5, where evident damage (scaling and cracks) is visible, the methodology
methodology
adopted to measure adopted thetoopen
measure the open
porosity porositydid
and density and notdensity
provide didthe
not provide the
resolution res-
needed
olution
to assessneeded to assess
the damage thepore
to the damage to theOn
structure. porethestructure.
other hand, On the
the effect
other of
hand, the effect of
the freeze/thaw
the freeze/thaw damage was clearly shown in terms of the capillary
damage was clearly shown in terms of the capillary water absorption rate (sorptivity), water absorption rate
(sorptivity), which is summarized
which is summarized in Figure 8. in Figure 8.
(a) (b)
Figure 7. Open porosity, bulk density and matrix density measured (a) before and (b) after
Figure 7. Open porosity, bulk density and matrix density measured (a) before and (b) after
freeze/thaw cycles. The error bars represent the standard deviation.
freeze/thaw cycles. The error bars represent the standard deviation.
The specimens prepared with rubber shreds (series ST) and rubber crumbs (series T8,
T12 and T30) showed a total water absorption value at 100 min that was in the range of
13–36% lower than the control specimens (series C), as reported in Figure 8. However,
after 20 freeze/thaw cycles, the rubber mortars absorbed less water than the control sam-
ple, specifically −32%, −50%, −58% and −61% for series ST, T8, T12 and T30 respectively,Materials 2023, 16, x FOR PEER REVIEW 9 of 15
Materials 2023, 16, 1301 8 of 14
Materials 2023, 16, x FOR PEER REVIEW 9 of 15
(a) (b)
(a) (b)
(c) (d)
Figure 8. Water absorption rate curves for series (a) ST, (b) T8, (c) T12 and (d) T30 before and after
Figure 8. Water absorption rate curves for series (a) ST, (b) T8, (c) T12 and (d) T30 before and after
freeze/thaw cycles compared to series C. The error bars represent the standard deviation. The dotted
freeze/thaw cyclesthe
lines represent compared to series C. The
linear interpolation usederror bars represent
to calculate the standard
the sorptivity deviation. The dotted
values.
lines represent the linear interpolation used to calculate the sorptivity values.
The specimens prepared with rubber shreds (series ST) and rubber crumbs (series T8,
T12 and T30) showed a total water absorption value at 100 min that was in the range of
13–36% lower than the control specimens (series C), as reported in Figure 8. However, after
20 freeze/thaw cycles, the rubber mortars absorbed less water than the control sample,
specifically −32%, −50%, −58% and −61% for series ST, T8, T12 and T30 respectively,
showing an increasing resistance to capillary absorption that was proportional to their
(c)fineness. This was due to their hydrophobicity and the subsequent (d) weak bonding with
the cementitious matrix [22]. The freeze/thaw cycles caused internal damage (i.e., cracks),
Figure 8. Water absorption rate curves for series (a) ST, (b) T8, (c) T12 and (d) T30 before and after
providing a pathway for water to come into contact with the surfaces of the rubber shreds
freeze/thaw cycles compared to series C. The error bars represent the standard deviation. The dotted
and
lines crumbs
represent
Figure [1,64], as shown
the linear
9. Microscopy images insamples
of Figure
interpolation used9.
to and
ST calculate
T8 andthe sorptivity
details of thevalues.
shreds and fibres, respectively.
The calculated sorptivity values before and after the freeze/thaw cycles are shown in
Figure 10. It was observed that, before the freeze/thaw damage, the capillary absorption
values were within the range of 0.12–0.18 mm/min0.5, which is typical of cementitious mor-
tar. However, all the specimens prepared with the recycled tyre waste exhibited an initial
sorptivity lower than the control specimens in series C, which was15% for the ST samples,
44% for the T8 samples, 18% for the T12 samples and 29% for the T30 series. Whilst this
contradicted the findings of Bisht and Ramana (2017), where a 5% rubber particles re-
placement led to an increased water absorption [63], the size of the particles used in this
study ere up to five-fold lower than those used in Bisht and Ramana (2017), demonstrating
the beneficial effect of rubber particle fineness on the capillary absorption of the samples.
Figure 9. Microscopy images of samples ST and T8 and details of the shreds and fibres, respectively.
After9.the
Figure freeze/thaw
Microscopy cycling,
images the water
of samples ST andabsorption rate
T8 and details of of
thespecimens
shreds and with
fibres,rubber shreds
respectively.
The calculated sorptivity values before and after the freeze/thaw cycles are shown in
Figure 10. It was observed that, before the freeze/thaw damage, the capillary absorption
values were within the range of 0.12–0.18 mm/min0.5, which is typical of cementitious mor-
tar. However, all the specimens prepared with the recycled tyre waste exhibited an initialMaterials 2023, 16, 1301 9 of 14
The calculated sorptivity values before and after the freeze/thaw cycles are shown in
Figure 10. It was observed that, before the freeze/thaw damage, the capillary absorption
values were within the range of 0.12–0.18 mm/min0.5 , which is typical of cementitious
mortar. However, all the specimens prepared with the recycled tyre waste exhibited an
initial sorptivity lower than the control specimens in series C, which was15% for the ST
samples, 44% for the T8 samples, 18% for the T12 samples and 29% for the T30 series. Whilst
this contradicted the findings of Bisht and Ramana (2017), where a 5% rubber particles
replacement led to an increased water absorption [63], the size of the particles used in this
Materials 2023, 16, x FOR PEER REVIEW 10 of 15
study ere up to five-fold lower than those used in Bisht and Ramana (2017), demonstrating
the beneficial effect of rubber particle fineness on the capillary absorption of the samples.
After the freeze/thaw cycling, the water absorption rate of specimens with rubber shreds
andcrumbs
and crumbssignificantly
significantlydecreased,
decreased,with withsorptivity
sorptivityvaluesvaluesthatthatwere
were35% 35%(ST),
(ST),44%
44%(T8),(T8),
47%(T12)
47% (T12)and and52%
52%(T30)
(T30)lower
lowerthan
thanthethecontrol
controlmortars.
mortars.Furthermore,
Furthermore,the thedecrease
decreaseininthe the
sorptivity, often used to assess the freeze/thaw resistance, was
sorptivity, often used to assess the freeze/thaw resistance, was proportional to the decrease proportional to the de-
increase in the size,
the particle particle
whichsize,
waswhich was in agreement
in agreement with Zhu et with Zhu et[29].
al. (2011) al. (2011) [29].trend
The same The same
was
trend was
observed whenobserved when
capillary capillaryrate
absorption absorption
values were rate values
compared were tocompared to thestrength,
the mechanical mechan-
asical
reported
strength, in Figure 11. Whilst
as reported before11.
in Figure theWhilst
freeze/thaw
before damage the larger
the freeze/thaw the particle
damage size,
the larger
the
thelower
particlethe size,
compressive
the lower strength, the strengthstrength,
the compressive variationthe after the freeze/thaw
strength variation damage
after the
was much lower
freeze/thaw (δstrength
damage was>much∆strength ); the(δparticle
lower size
strength > ∆ did
strength not particle
); the affect thesize
sorptivity
did notvariation
affect the
(δsorptivity ) before the damage. On the contrary, after the freeze/thaw
sorptivity variation (δsorptivity) before the damage. On the contrary, after the freeze/thawdamage, the capability
ofdamage,
the samples to absorbofwater
the capability via capillary
the samples actionwater
to absorb was significantly
via capillary influenced
action was by the
signifi-
particle size (δsorptivity
cantly influenced < ∆sorptivity
by the particle).size
The(δsamples
sorptivity < prepared
∆sorptivity). with rubber shreds
The samples preparedresulted
with in a
rub-
higher sorptivity,
ber shreds whereas
resulted the variation
in a higher sorptivity, in strength
whereas (∆ the ) wasin
variation
strength lower than(∆
strength that before
strength) was
the freeze/thaw
lower than that damage.
before the freeze/thaw damage.
Figure10.
Figure 10.Sorptivity
Sorptivityvalues
valuesofofseries
seriesC,C,ST,
ST,T8,
T8,T12
T12and
andT30
T30before
beforeand
andafter
afterfreeze/thaw
freeze/thawcycles.
cycles.The
The
errorbars
error barsrepresent
representthe
thestandard
standarddeviation.
deviation.
Measurements of the thermal conductivity for all series before and after freeze/thaw
damage are reported in Figure 12. The thermal conductivity (λ) of the control mortars
(series C) was shown to be typical of cementitious mortar [65–68]; however, when the
rubber shreds and crumbs were used, the λ-value decreased. This was due to the presence
of the rubber, a material with a significantly lower density (350–500 kg/m3 ) than mortar
constituents (sand and cement). The samples in series ST showed a reduction in thermal
conductivity of 35% when compared to the control mortar, whereas the samples in series
T8, T12 and T30 reduced the λ-values by approximately 23%, which was in agreement with
the literature [69,70]. After the freeze/thaw damage, the formation of internal damageMaterials 2023, 16, 1301 10 of 14
(pores and cracks) further decreased the thermal conductivity in the control samples by
42% due to the presence of air. However, the rubberised samples showed a reduction in
thermal conductivity of less than 10% for series T8, T12 and T13 and a reduction of 19% for
FigureST.
series 10.The
Sorptivity values
presence of series
of the rubberC, shreds
ST, T8, T12
andand T30 before
crumbs and afteraffected
significantly freeze/thaw cycles. The
the reduction
error bars represent the standard deviation.
in λ-values, and their particle size aided the freeze/thaw resistance of the system.
Materials 2023, 16, x FOR PEER REVIEW 11 of 15
Measurements of the thermal conductivity for all series before and after freeze/thaw
damage are reported in Figure 12. The thermal conductivity (λ) of the control mortars
(series C) was shown to be typical of cementitious mortar [65–68]; however, when the
rubber shreds and crumbs were used, the λ-value decreased. This was due to the presence
of the rubber, a material with a significantly lower density (350–500 kg/m3) than mortar
constituents (sand and cement). The samples in series ST showed a reduction in thermal
conductivity of 35% when compared to the control mortar, whereas the samples in series
T8, T12 and T30 reduced the λ-values by approximately 23%, which was in agreement
with the literature [69,70]. After the freeze/thaw damage, the formation of internal damage
(pores and cracks) further decreased the thermal conductivity in the control samples by
42% due to the presence of air. However, the rubberised samples showed a reduction in
thermal conductivity of less than 10% for series T8, T12 and T13 and a reduction of 19%
Figure
Figure 11.Sorptivity
for series
11. Sorptivity
ST. valuesof
The presence
values ofofseries C,ST,
ST,T8,
the rubber
series C, T8, T12and
shreds
T12 andT30
and T30 before
crumbs
before andafter
afterfreeze/thaw
significantly
and freeze/thaw cycles
affected the re-
cycles
compared
duction intoλ-values,
compressiveandstrength
their values. size
particle The error
aidedbars
the represent the standard
freeze/thaw resistance deviation.
of the system.
compared to compressive strength values. The error bars represent the standard deviation.
Figure12.
Figure 12.Thermal
Thermalconductivity
conductivityvalues
valuesofofseries
seriesC,C,ST,
ST,T8,
T8,T12
T12and
andT30
T30before
beforeand
andafter
afterfreeze/thaw
freeze/thaw
cycles.The
cycles. Theerror
errorbars
barsrepresent
representthe
thestandard
standarddeviation.
deviation.
3.2.3.
3.2.3.Environmental
EnvironmentalConsiderations
Considerations
The
The replacement offine
replacement of fineaggregate with
aggregate withrubber tyre
rubber waste
tyre addresses
waste twotwo
addresses keykeyenviron-
envi-
mental concerns: the extensive use of natural resources in the
ronmental concerns: the extensive use of natural resources in the construction industry
construction and the
industry
waste disposal
and the waste of end-of-life
disposal tyres on the
of end-of-life other
tyres on end. Typically,
the other 1 m3 of concrete
end. Typically, 1 m3 ofisconcrete
made upis
of 350 kg of cement, 700 kg of fine aggregate (sand) and 1200 kg of coarse aggregate (gravel).
made up of 350 kg of cement, 700 kg of fine aggregate (sand) and 1200 kg of coarse aggre-
When scaled-up to large production (thousands of tonnes of concrete per day), partially
gate (gravel). When scaled-up to large production (thousands of tonnes of concrete per
replacing sand with waste tyre particles, even at relatively low replacement ratios (e.g., 20%
day), partially replacing sand with waste tyre particles, even at relatively low replacement
by volume) could contribute to saving hundreds of tonnes of sand and subsequent indirect
ratios (e.g., 20% by volume) could contribute to saving hundreds of tonnes of sand and
savings in energy and fuel. The embodied carbon (EC) for sand production is estimated
subsequent indirect savings in energy and fuel. The embodied carbon (EC) for sand pro-
duction is estimated to be 0.021 kgCO2/kg, which includes the extraction of sandstone or
limestone followed by crushing, whereas the EC for tyre waste particles is calculated to
be 0.004 kgCO2/kg, which accounts for the energy consumption from shredding and
grinding [36]. Assuming the production of 1 m3 of mortar with sand replacement levels ofMaterials 2023, 16, 1301 11 of 14
to be 0.021 kgCO2 /kg, which includes the extraction of sandstone or limestone followed
by crushing, whereas the EC for tyre waste particles is calculated to be 0.004 kgCO2 /kg,
which accounts for the energy consumption from shredding and grinding [36]. Assuming
the production of 1 m3 of mortar with sand replacement levels of up to 50–80% with
recycled tyre waste [22], the EC of mortar with fine aggregate would be 20–30% lower than
conventional mortar.
Tyre waste disposal also represents a growing environmental concern, as landfill
disposal is costly and not environmentally sustainable; in the UK, only 10% of tyre waste is
recycled, and 63% is disposed of in landfill [2]. Tushar et al. (2022) calculated that recycling
the annual waste disposal of 460,000 tonnes for the production of rubber crumbs could
save up to $16.1 million in natural resources [6]. Repurposing waste tyres into cementitious
materials would divert hundreds of thousands of tonnes of tyres from landfill disposal
towards being reused in the construction industry [1].
The results discussed in this work link two large and growing industries (concrete
manufacturing and tyre production) by providing waste materials with a way to replace
sand on the one hand and alternative solutions to tyre waste disposal on the other.
4. Conclusions
In this study, the freeze/thaw resistance of rubberised mortars was evaluated by means
of mechanical performance tests, water transport measurements and thermal conductivity
measurements. The fine aggregate (sand) in the mortar samples was replaced with 20%
(by volume) of waste tyre shreds and crumbs. The effects of their particle size (from fibres
0.5–5.0 mm long to crumbs of 0.15–0.85 mm in diameter) was shown to influence the overall
mechanical performance of the samples. The flexural strength and compressive strength
values were reduced by approximately 18–45% and 20–62%, respectively, when compared
to the control specimens. However, the smaller particle size of the tyre crumbs improved
the drying shrinkage by approximately 90%, i.e., −20 µm/m for series T30 compared to
−220 µm/m for the control series.
The addition of waste tyre particles significantly improved the mortar’ freeze/thaw
resistances. After the freeze/thaw damage, decreasing the tyre particle size resulted in
an improved water absorption rate by up to 50% when compared to the plain mortar. A
similar trend was observed in the measured thermal conductivity before and after 20 cycles
of freezing and thawing, where the specimens with a smaller particle size showed the
lowest variation in λ-values.
The results presented in this work suggest that the particle size of tyre crumbs plays an
important role in using waste tyres for mortar and concrete production for non-structural
applications; the optimisation of the replacement levels and grading leads to improved
durability frost resistance, and enhanced thermal resistivity.
Further work will be conducted at the concrete scale, including microstructural char-
acterisations and a detailed life-cycle assessment to evaluate the environmental benefits in
targeted engineering applications.
Funding: This research received no external funding. The APC was funded by the Cardiff University’s
Institutional Open Access Fund.
Data Availability Statement: The data associated with this work are available under the Cardiff
University Dataset repository, and can be accessed at http://doi.org/10.17035/d.2022.0235158295.
Conflicts of Interest: The author declares no conflict of interest.
References
1. Hamdi, A.; Abdelaziz, G.; Farhan, K.Z. Scope of reusing waste shredded tires in concrete and cementitious composite materials:
A review. J. Build. Eng. 2021, 35, 102014. [CrossRef]
2. Ferdous, W.; Manalo, A.; Siddique, R.; Mendis, P.; Zhuge, Y.; Wong, H.S.; Lokuge, W.; Aravinthan, T.; Schubel, P. Recycling of
landfill wastes (tyres, plastics and glass) in construction—A review on global waste generation, performance, application and
future opportunities. Resour. Conserv. Recycl. 2021, 173, 105745. [CrossRef]Materials 2023, 16, 1301 12 of 14
3. Torretta, V.; Rada, E.C.; Ragazzi, M.; Trulli, E.; Istrate, I.A.; Cioca, L.I. Treatment and disposal of tyres: Two EU approaches. A
review. Waste Manag. 2015, 45, 152–160. [CrossRef] [PubMed]
4. Abbas-Abadi, M.S.; Kusenberg, M.; Shirazi, H.M.; Goshayeshi, B.; Van Geem, K.M. Towards full recyclability of end-of-life tires:
Challenges and opportunities. J. Clean. Prod. 2022, 374, 134036. [CrossRef]
5. Thomas, B.S.; Gupta, R.C. A comprehensive review on the applications of waste tire rubber in cement concrete. Renew. Sustain.
Energy Rev. 2016, 54, 1323–1333. [CrossRef]
6. Tushar, Q.; Santos, J.; Zhang, G.; Bhuiyan, M.A.; Giustozzi, F. Recycling waste vehicle tyres into crumb rubber and the transition
to renewable energy sources: A comprehensive life cycle assessment. J. Environ. Manag. 2022, 323, 116289. [CrossRef]
7. Mendis, A.S.M.; Al-Deen, S.; Ashraf, M. Behaviour of similar strength crumbed rubber concrete (CRC) mixes with different mix
proportions. Constr. Build. Mater. 2017, 137, 354–366. [CrossRef]
8. Mohajerani, A.; Burnett, L.; Smith, J.V.; Markovski, S.; Rodwell, G.; Rahman, M.T.; Kurmus, H.; Mirzababaei, M.; Arulrajah, A.;
Horpibulsuk, S.; et al. Recycling waste rubber tyres in construction materials and associated environmental considerations: A
review. Resour. Conserv. Recycl. 2020, 155, 104679. [CrossRef]
9. Wang, X.; Xia, J.; Nanayakkara, O.; Li, Y. Properties of high-performance cementitious composites containing recycled rubber
crumb. Constr. Build. Mater. 2017, 156, 1127–1136. [CrossRef]
10. Wang, H.; Wu, Y.; Cheng, B. Mechanical properties of alkali-activated concrete containing crumb rubber particles. Case Stud.
Constr. Mater. 2022, 16, e00803. [CrossRef]
11. Oikonomou, N.; Mavridou, S. Improvement of chloride ion penetration resistance in cement mortars modified with rubber from
worn automobile tires. Cem. Concr. Compos. 2009, 31, 403–407. [CrossRef]
12. Alyousef, R.; Ahmad, W.; Ahmad, A.; Aslam, F.; Joyklad, P.; Alabduljabbar, H. Potential use of recycled plastic and rubber
aggregate in cementitious materials for sustainable construction: A review. J. Clean. Prod. 2021, 329, 129736. [CrossRef]
13. Strukar, K.; Šipoš, T.K.; Miličević, I.; Bušić, R. Potential use of rubber as aggregate in structural reinforced concrete element—A
review. Eng. Struct. 2019, 188, 452–468. [CrossRef]
14. Qaidi, S.M.A.; Dinkha, Y.Z.; Haido, J.H.; Ali, M.H.; Tayeh, B.A. Engineering properties of sustainable green concrete incorporating
eco-friendly aggregate of crumb rubber: A review. J. Clean. Prod. 2021, 324, 129251. [CrossRef]
15. Siddika, A.; Al Mamun, M.A.; Alyousef, R.; Amran, Y.H.M.; Aslani, F.; Alabduljabbar, H. Properties and utilizations of waste tire
rubber in concrete: A review. Constr. Build. Mater. 2019, 224, 711–731. [CrossRef]
16. Roychand, R.; Gravina, R.J.; Zhuge, Y.; Ma, X.; Youssf, O.; Mills, J.E. A comprehensive review on the mechanical properties of
waste tire rubber concrete. Constr. Build. Mater. 2020, 237, 117651. [CrossRef]
17. Li, Y.; Zhang, S.; Wang, R.; Dang, F. Potential use of waste tire rubber as aggregate in cement concrete—A comprehensive review.
Constr. Build. Mater. 2019, 225, 1183–1201. [CrossRef]
18. Ince, C.; Shehata, B.M.H.; Derogar, S.; Ball, R.J. Towards the development of sustainable concrete incorporating waste tyre rubbers:
A long-term study of physical, mechanical & durability properties and environmental impact. J. Clean. Prod. 2022, 334, 130223.
19. Si, R.; Guo, S.; Dai, Q. Durability performance of rubberized mortar and concrete with NaOH-Solution treated rubber particles.
Constr. Build. Mater. 2017, 153, 496–505. [CrossRef]
20. Abbas, S.; Ahmed, A.; Waheed, A.; Abbass, W.; Yousaf, M.; Shaukat, S.; Alabduljabbar, H.; Awad, Y.A. Recycled Untreated Rubber
Waste for Controlling the Alkali–Silica Reaction in Concrete. Materials (Basel) 2022, 15, 3584. [CrossRef]
21. Youssf, O.; Mills, J.E.; Hassanli, R. Assessment of the mechanical performance of crumb rubber concrete. Constr. Build. Mater.
2016, 125, 175–183. [CrossRef]
22. Huang, W.; Huang, X.; Xing, Q.; Zhou, Z. Strength reduction factor of crumb rubber as fine aggregate replacement in concrete.
J. Build. Eng. 2020, 32, 101346. [CrossRef]
23. Islam, M.M.U.; Li, J.; Roychand, R.; Saberian, M.; Chen, F. A comprehensive review on the application of renewable waste tire
rubbers and fibers in sustainable concrete. J. Clean. Prod. 2022, 374, 133998. [CrossRef]
24. Pour, A.K.; Mohajeri, Z.; Farsangi, E.N. Impact of Polypropylene Fibers on the Mechanical and Durability Characteristics of
Rubber Tire Fine Aggregate Concrete. Materials (Basel) 2022, 15, 8043. [CrossRef]
25. Ahmad, J.; Zhou, Z.; Majdi, A.; Alqurashi, M.; Deifalla, A.F. Overview of Concrete Performance Made with Waste Rubber Tires: A
Step toward Sustainable Concrete. Materials (Basel) 2022, 15, 5518. [CrossRef]
26. Raffoul, S.; Garcia, R.; Pilakoutas, K.; Guadagnini, M.; Medina, N.F. Optimisation of rubberised concrete with high rubber content:
An experimental investigation. Constr. Build. Mater. 2016, 124, 391–404. [CrossRef]
27. Richardson, A.E.; Coventry, K.A.; Ward, G. Freeze/thaw protection of concrete with optimum rubber crumb content. J. Clean.
Prod. 2012, 23, 96–103. [CrossRef]
28. Richardson, A.; Coventry, K.; Edmondson, V.; Dias, E. Crumb rubber used in concrete to provide freeze-thaw protection (optimal
particle size). J. Clean. Prod. 2016, 112, 599–606. [CrossRef]
29. Zhu, X.; Miao, C.; Liu, J.; Hong, J. Influence of crumb rubber on frost resistance of concrete and effect mechanism. Procedia Eng.
2012, 27, 206–213. [CrossRef]
30. Gupta, T.; Chaudhary, S.; Sharma, R.K. Assessment of mechanical and durability properties of concrete containing waste rubber
tire as fine aggregate. Constr. Build. Mater. 2014, 73, 562–574. [CrossRef]
31. Thomas, B.S.; Gupta, R.C.; Panicker, V.J. Recycling of waste tire rubber as aggregate in concrete: Durability-related performance.
J. Clean. Prod. 2016, 112, 504–513. [CrossRef]Materials 2023, 16, 1301 13 of 14
32. Ataria, R.B.; Wang, Y.C. Aggregate Concrete Containing Crumb Rubber. Materials (Basel) 2022, 15, 1776. [CrossRef]
33. Marie, I. Thermal conductivity of hybrid recycled aggregate—Rubberized concrete. Constr. Build. Mater. 2017, 133, 516–524.
[CrossRef]
34. Fraile-Garcia, E.; Ferreiro-Cabello, J.; Mendivil-Giro, M.; Vicente-Navarro, A.S. Thermal behaviour of hollow blocks and bricks
made of concrete doped with waste tyre rubber. Constr. Build. Mater. 2018, 176, 193–200. [CrossRef]
35. Youssf, O.; Elchalakani, M.; Hassanli, R.; Roychand, R.; Zhuge, Y.; Gravina, R.J.; Mills, J.E. Mechanical performance and durability
of geopolymer lightweight rubber concrete. J. Build. Eng. 2022, 45, 103608. [CrossRef]
36. Valente, M.; Sambucci, M.; Chougan, M.; Ghaffar, S.H. Reducing the emission of climate-altering substances in cementitious
materials: A comparison between alkali-activated materials and Portland cement-based composites incorporating recycled tire
rubber. J. Clean. Prod. 2022, 333, 130013. [CrossRef]
37. Dey, D.; Srinivas, D.; Panda, B.; Suraneni, P.; Sithamar, T.G. Use of industrial waste materials for 3D printing of sustainable
concrete: A review. J. Clean. Prod. 2022, 340, 130749. [CrossRef]
38. Sambucci, M.; Valente, M. Influence of waste tire rubber particles size on the microstructural, mechanical, and acoustic insulation
properties of 3d-printable cement mortars. Civ. Eng. J. 2021, 7, 937–952. [CrossRef]
39. BS EN 196-1; Methods of Testing Cement—Part 1: Determination of Compressive Strength. British Standards Institution: London,
UK, 2016.
40. BS EN 12390-16; Testing Hardened Concrete—Part 16: Determination of the Shrinkage of Concrete Strength. British Standards
Institution: London, UK, 2019.
41. Knapen, E.; Cizer, O.; Van Balen, K.; Van Gemert, D. Effect of free water removal from early-age hydrated cement pastes on
thermal analysis. Constr. Build. Mater. 2009, 23, 3431–3438. [CrossRef]
42. Gallé, C. Effect of drying on cement-based materials pore structure as identified by mercury intrusion porosimetry. Cem. Concr.
Res. 2001, 31, 1467–1477. [CrossRef]
43. Roels, S.; Carmeliet, J.; Hens, H.; Adan, O.; Brocken, H.; Cerny, R.; Pavlik, Z.; Hall, C.; Kumaran, K.; Pel, L.; et al. Interlaboratory
Comparison of Hygric Properties of Porous Building Materials. J. Build. Phys. 2004, 27, 307–325. [CrossRef]
44. Maddalena, R.; Taha, H.; Gardner, D. Self-healing potential of supplementary cementitious materials in cement mortars: Sorptivity
and pore structure. Dev. Built Environ. 2021, 6, 100044. [CrossRef]
45. Litina, C.; Bumanis, G.; Anglani, G.; Dudek, M.; Maddalena, R.; Amenta, M.; Papaioannou, S.; Pérez, G.; Calvo, J.L.G.; Asensio,
E.; et al. Evaluation of methodologies for assessing self-healing performance of concrete with mineral expansive agents: An
interlaboratory study. Materials (Basel) 2021, 14, 2024. [CrossRef] [PubMed]
46. ASTM C1585; Standard Test Method for Measurement of Rate of Absorption of Water by Hydraulic-Cement Concretes. ASTM
International: West Conshohocken, PA, USA, 2013.
47. ASTM D5334-22; Standard Test Method for Determination of Thermal Conductivity of Soil and Rock by Thermal Needle Probe
Procedure. ASTM International: West Conshohocken, PA, USA, 2022.
48. BS EN 12390-9; Testing Hardened Concrete—Part 9: Freeze-Thaw Resistance with De-icing Salts—Scaling. British Standards
Institution: London, UK, 2016.
49. Li, L.; Ruan, S.; Zeng, L. Mechanical properties and constitutive equations of concrete containing a low volume of tire rubber
particles. Constr. Build. Mater. 2014, 70, 291–308. [CrossRef]
50. Sebal, R.A.M.; Sakthieswaran, N.; Babu, O.G.; Gaayathri, K.K. Effect of micro silica and ground granulated blast furnace slag on
performance of rubberized mortar. Mater. Today Proc. 2020, 37, 1014–1018. [CrossRef]
51. Su, H.; Yang, J.; Ling, T.C.; Ghataora, G.S.; Dirar, S. Properties of concrete prepared with waste tyre rubber particles of uniform
and varying sizes. J. Clean. Prod. 2015, 91, 288–296. [CrossRef]
52. Thomas, B.S.; Gupta, R.C. Properties of high strength concrete containing scrap tire rubber. J. Clean. Prod. 2016, 113, 86–92.
[CrossRef]
53. Sukontasukkul, P.; Tiamlom, K. Expansion under water and drying shrinkage of rubberized concrete mixed with crumb rubber
with different size. Constr. Build. Mater. 2012, 29, 520–526. [CrossRef]
54. Yuan, C.; Chen, W.; Pham, T.M.; Hao, H. Bond behavior between basalt fibres reinforced polymer sheets and steel fibres reinforced
concrete. Eng. Struct. 2018, 176, 812–824. [CrossRef]
55. Hossain, K.M.A.; Hossain, M.A.; Manzur, T. Structural performance of fiber reinforced lightweight self-compacting concrete
beams subjected to accelerated corrosion. J. Build. Eng. 2020, 30, 101291. [CrossRef]
56. Moustafa, A.; Elgawady, M.A. Mechanical properties of high strength concrete with scrap tire rubber. Constr. Build. Mater. 2015,
93, 249–256. [CrossRef]
57. Wang, Q.Z.; Wang, N.N.; Tseng, M.L.; Huang, Y.M.; Li, N.L. Waste tire recycling assessment: Road application potential and
carbon emissions reduction analysis of crumb rubber modified asphalt in China. J. Clean. Prod. 2020, 249, 119411. [CrossRef]
58. Lv, J.; Zhou, T.; Du, Q.; Wu, H. Effects of rubber particles on mechanical properties of lightweight aggregate concrete. Constr.
Build. Mater. 2015, 91, 145–149. [CrossRef]
59. Amiandamhen, S.O.; Adamopoulos, S.; Adl-Zarrabi, B.; Yin, H.; Norén, J. Recycling sawmilling wood chips, biomass combustion
residues, and tyre fibres into cement-bonded composites: Properties of composites and life cycle analysis. Constr. Build. Mater.
2021, 297, 123781. [CrossRef]Materials 2023, 16, 1301 14 of 14
60. Gonen, T. Freezing-thawing and impact resistance of concretes containing waste crumb rubbers. Constr. Build. Mater. 2018, 177,
436–442. [CrossRef]
61. Elchalakani, M. High strength rubberized concrete containing silica fume for the construction of sustainable road side barriers.
Structures 2015, 1, 20–38. [CrossRef]
62. de Oliveira Andrade, J.J.; Possan, E.; Squiavon, J.Z.; Ortolan, T.L.P. Evaluation of mechanical properties and carbonation of
mortars produced with construction and demolition waste. Constr. Build. Mater. 2018, 161, 70–83. [CrossRef]
63. Bisht, K.; Ramana, P.V. Evaluation of mechanical and durability properties of crumb rubber concrete. Constr. Build. Mater. 2017,
155, 811–817. [CrossRef]
64. Hua, L.; Xiao, F.; Li, Y.; Huang, H.; Zhao, K.; Yu, K.; Hettiarachchi, C. A potential damage mechanism of rubberized cement under
freeze-thaw cycle. Constr. Build. Mater. 2020, 252, 119054. [CrossRef]
65. Akçaözo, S.; Akçaözo, K.; Atiş, C.D. Thermal conductivity, compressive strength and ultrasonic wave velocity of cementitious
composite containing waste PET lightweight aggregate (WPLA). Compos. Part B Eng. 2013, 45, 721–726. [CrossRef]
66. Maddalena, R.; Roberts, J.J.; Hamilton, A. Can Portland cement be replaced by low-carbon alternative materials? A study on
thermal properties and carbon emissions of innovative cements. J. Clean. Prod. 2018, 186, 933–942. [CrossRef]
67. Asadi, I.; Shafigh, P.; Hassan, Z.F.B.A.; Mahyuddin, N.B. Thermal conductivity of concrete—A review. J. Build. Eng. 2018, 20,
81–93. [CrossRef]
68. Liu, K.; Wang, Z.; Jin, C.; Wang, F.; Lu, X. An experimental study on thermal conductivity of iron ore sand cement mortar. Constr.
Build. Mater. 2015, 101, 932–941. [CrossRef]
69. Bala, A.; Gupta, S. Thermal resistivity, sound absorption and vibration damping of concrete composite doped with waste tire
Rubber: A review. Constr. Build. Mater. 2021, 299, 123939. [CrossRef]
70. Iqbal, M.F.; Liu, Q.F.; Azim, I.; Zhu, X.; Yang, J.; Javed, M.F.; Rauf, M. Prediction of mechanical properties of green concrete
incorporating waste foundry sand based on gene expression programming. J. Hazard. Mater. 2020, 384, 121322. [CrossRef]
[PubMed]
Disclaimer/Publisher’s Note: The statements, opinions and data contained in all publications are solely those of the individual
author(s) and contributor(s) and not of MDPI and/or the editor(s). MDPI and/or the editor(s) disclaim responsibility for any injury to
people or property resulting from any ideas, methods, instructions or products referred to in the content.You can also read