Foreign Direct Investment in Estonia - Determinants, incentives, trends and strategy - Theseus
←
→
Page content transcription
If your browser does not render page correctly, please read the page content below
Karmen Meier

Foreign Direct Investment in
Estonia
Determinants, incentives, trends and strategy

Metropolia University of Applied Sciences
Bachelor of Business Administration
European Business Administration
Bachelor Thesis
26.11.2021

Abstract

Author(s):                 Karmen Meier
Title:                     Foreign Direct Investment in Estonia
Number of Pages:           48 pages
Date:                      26.11.2021

Degree:                    Bachelor Degree in Business Administration
Degree Programme:          European Business Administration
Specialisation option:     Finance
Instructor(s):             Michael Keaney, Senior Lecturer

Description

Estonia is a small country in Northern Europe that gained independence from the
Soviet Union in 1991. Since then, Estonia has relied heavily on foreign direct
investment flows which has had a significant effect on the country’s economy,
bringing about capital formation, job creation, productivity growth and positive spill
overs. The goal of Estonia is to attract high value-added investments; however, the
country is facing challenges – poor demographic outlook, labour skills mismatch with
demand, rising salaries and external shocks are all deterrent to investment flows.

FDI theory is explored to set the scene – motivations of the firms, modes of
investment, determinants and the effects. Estonian economy is analyzed to find
strengths and weaknesses as well as looking at determinants that drive or
discourage FDI flows to Estonia. Further research is conducted to analyze Estonia’s
FDI strategy including incentives and recent trends that could make Estonia more
attractive to foreign investors.

The findings indicated that investors favored Estonia due to the stability of economy,
skilled labour, tax system, digitalization, presence of technologies and location. The
nearshoring trend and rising reputation as a technologically advanced country have
attracted investors to Estonia.

In order to have sustained level of growth in the future, there needs to be a long-term
dynamic plan in place and labour situation and infrastructure need to be improved.
The plan should have a wider approach and alternative avenues to FDI should be
explored. Greentech and focusing on environmentally friendly sustainable solutions is
key as well as global trends are moving towards green technologies.

Keywords:                  foreign direct investment, Estonia, determinants
Contents

Table of Contents
1     Introduction ................................................................................................ 2

2     FDI theory and determinants .................................................................... 3

    2.1       FDI theory ....................................................................................................... 3

    2.2       Horizontal and vertical production .............................................................. 5

    2.3       Motivations ..................................................................................................... 5
      2.3.1      Natural resource seekers ........................................................................................ 6
      2.3.2      Market seekers ........................................................................................................ 6
      2.3.3      Efficiency seekers.................................................................................................... 6
      2.3.4      Strategic asset seekers ........................................................................................... 7

3     FDI effects on the host country ................................................................ 7

    3.1       Host country benefits of FDI ........................................................................ 7

    3.2       Modes of FDI and impact on the host country ........................................... 8

    3.3       Criticism of FDI .............................................................................................. 8

4     FDI determinants ....................................................................................... 9

    4.1       The market ..................................................................................................... 9

    4.2       Labour costs ................................................................................................ 10

    4.3       Political stability .......................................................................................... 10

    4.4       Institutions ................................................................................................... 11

    4.5       Taxation ........................................................................................................ 12

5     Estonian economy ................................................................................... 13

    5.1       Trade ............................................................................................................. 13

    5.2       Demographics and the labour market ....................................................... 14

    5.3       Main industries and employers .................................................................. 15

    5.4       Regional differences ................................................................................... 15

    5.5       Strengths and weaknesses ........................................................................ 16

    5.6       Future outlook ............................................................................................. 18

6     Research methodology ........................................................................... 19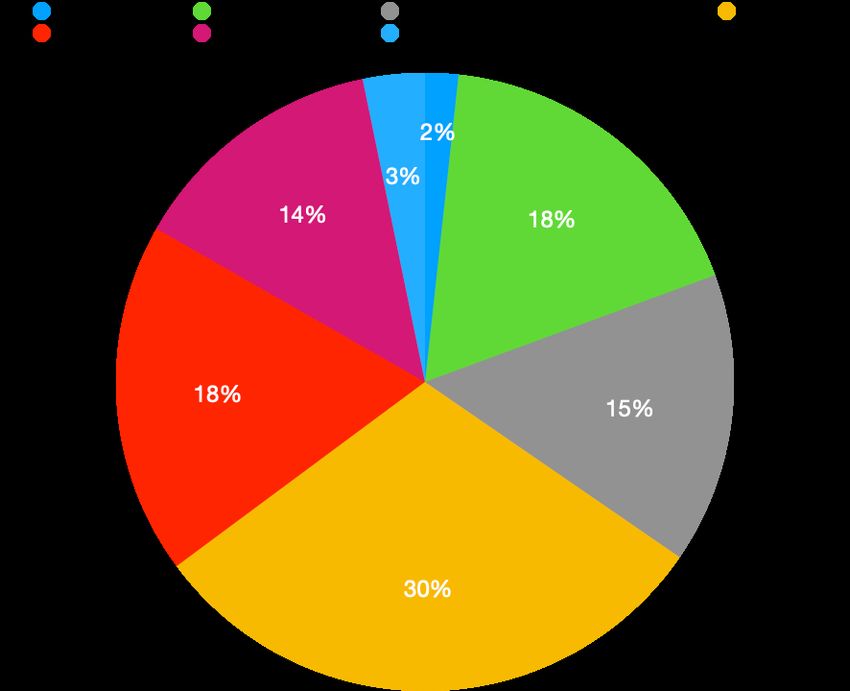
7     Findings .................................................................................................... 20

    7.1       History of FDI ............................................................................................... 20

    7.2       Composition of investment inflows to Estonia ........................................ 21

    7.3       Comparison to other Baltic countries ....................................................... 22

8     Determinants and motivations ............................................................... 23

    8.1       Determinants................................................................................................ 23

    8.2       Motivations and FDI trends ........................................................................ 25

9     Recent investments ................................................................................. 25
      9.1.1      Nordic countries..................................................................................................... 25
      9.1.2      The Netherlands .................................................................................................... 27
      9.1.3      Germany ................................................................................................................ 27

10         Recent trends ....................................................................................... 28

    10.1      Geographical location and nearshoring.................................................... 28

    10.2      Start-up scene and unicorns ...................................................................... 29

    10.3      Greentech ..................................................................................................... 29

    10.4      Automation and robotisation ..................................................................... 30

11         FDI strategy .......................................................................................... 31

    11.1      Incentives ..................................................................................................... 31

    11.2      E-residency .................................................................................................. 31

12         Analysis and conclusions ................................................................... 32

13         Recommendations ............................................................................... 35

    13.1      Long term dynamic plan for attracting foreign direct investment .......... 35
      13.1.1         Improving the labour situation ........................................................................... 35
      13.1.2         Wider approach to FDI ...................................................................................... 35
      13.1.3         Infrastructure ..................................................................................................... 36
      13.1.4         EAS specific suggestions .................................................................................. 36
      13.1.5         Focusing on environmentally friendly sustainable solutions ............................. 36
      13.1.6         Pursuing alternative avenues to FDI ................................................................. 37

References....................................................................................................... 38
List of Figures Figure 1. Estonia’s GDP growth/decline in percentages, 2006-2020. Eesti Pank Statistics. Figure 2: Trade Balance 2006-2020. Exports and imports in billions €, Eesti Pank Statistics. Figure 3. Map of Estonia, Geoportal Republic of Estonia Land Board. Figure 4. Inward foreign direct investment flows to Estonia, UNCTAD statistics. Figure 5. Inflow of foreign direct investment by country, Eesti Pank Statistics. Figure 6. Direct investment position in Estonia by field of activity, Eesti Pank Statistics. Figure 7. Greenfield projects in Estonia 2003-2020, UNCTAD statistics. Figure 8. Inward FDI flows to Estonia, Latvia and Lithuania in Millions USD. Eesti Pank Statistics. Table 1. Dividing investors to different categories Table 2. OLI advantages
Glossary

FDI – foreign direct investment

GVC – global value chain

MNE – multinational enterprise

M&A – mergers and acquisitions
2

1 Introduction

Estonia gained independence from the Soviet Union in 1991 and opened up its
economy to foreign direct investment (FDI). FDI is a cross-border investment,
where an investor from one country invests in an enterprise in another country,
gaining lasting influence and interest over the enterprise. FDI has benefited
Estonia greatly and helped to modernize and restructure the economy
(Varblane et al, 2020).

The rapid growth of global FDI flows, especially since the 1980s has caused a
huge wave of research trying to come up with theories explaining causes and
effects of FDI. The global interest has brought about intense competition
between countries, especially since the 1990s when the investment climate
improved and FDI incentives were becoming widely used. Most of the FDI
comes from multinational enterprises (MNE) and is found to be beneficial for
host (FDI inflow) and home (FDI outflow) countries. FDI flows comprise of
equity capital, reinvested earnings and intra-company loans (Moosa, 2002). The
main modes are mergers and acquisitions and greenfield investments – all
posing different levels of risks, costs and benefits (Alba et al, 2010).

FDI brings about economic integration, growth, technology and labour
development spill overs in addition to capital flows. According to Duran (2019)
FDI is crucial for small open economies with declining populations as it brings
capital formation, job creation and productivity growth. The goal of Estonia is to
attract high value-added investments that would cause most positive effects on
the economy. However, Estonia is facing many challenges – labour mismatch
with demand, rising salaries and poor demographic outlook could all hinder the
growth.

The first part of the research focuses on FDI theory and determinants, what are
the motivations that drive companies to make investment decisions. FDI
benefits and effects are explored as well as explaining the different modes and
ways companies can engage in foreign investment. Key FDI determinants like
3

market size and growth, labour costs, political stability, institutions and taxation
are looked at in depth.

In the second part Estonian economy is analysed through GDP and growth,
trade, participation in global value chains, demographics and labour market,
main industries and employers and regional differences. This helps to identify
Estonia’s strengths and weaknesses.

The third part is history of FDI flows into Estonia, as well as composition of
these investments and comparison to other Baltic countries. Determinants are
looked at and compared to situation in Estonia. To better understand firms’
investment decisions to Estonia, recent investments and trends are analysed as
well as FDI strategy and incentives. The final part is analysis of all the gathered
data, conclusion and recommendations based on the results of the research.

Therefore, the ultimate purpose of this research is to explore determinants of
FDI to Estonia and ways the country is trying to attract foreign investments.
Furthermore, looking at why companies have chosen Estonia as a destination
country as well as giving recommendations how to ensure future growth and
continuous benefits from inward FDI.

2 FDI theory and determinants

2.1 FDI theory

Globalisation has brought interest in international business activities – foreign
direct investment determinants and motivations of multinational enterprises
(MNE) have been widely researched since the 1960s, trying to come up with
theories, causes and effects. The 3 main theories were created by S. Hymer, R.
Vernon and J. Dunning (Densia, 2010).

Internalization theory was created by Stephen Hymer, who explained that MNE
motivations are due to a firm specific competitive advantage, also called an
4

ownership advantage. For example, a large company would have a financial
advantage over others as it can raise capital quicker and in a larger capacity.
Other advantages could include – innovational products or services, marketing
or cost advantages, which in turn would balance out the risks and costs of
internationalization. The assumption is that the host country market needs to be
imperfect in order for internationalisation to be successful and the MNE would
need to gain a monopolistic position in the market. The decision to
internationalise depends on industry factors, region-specific factors and nation
specific factors (Buckley and Casson, 1976).

Vernon created the production cycle theory in 1966, the cycle consists of 4
stages – innovation, growth, maturity and decline. Vernon’s theory was built on
American corporations investing in Western Europe after the World War 2. The
MNE’s had a technological advantage over other countries that had suffered
from war. These companies could export goods surplus to foreign markets.
Later as the technology spread and became widely available, local sales
needed to be maintained as foreign companies were starting to provide similar
products to their markets. This is the stage where lower costs are were sought
in terms of production abroad where, for example, the labour costs are lower
(Vernon, 1966).

Dunning’s eclectic approach of FDI explained 3 specific advantages –
ownership, location and internalization advantages. Ownership (O-advantages)
are specific to the MNE and bring about competitive advantage over others
through production processes, patents, technological knowledge, reputation or
management skills. Location advantages (L-advantages) are specific to the host
country, for example, lower labour and production costs, exploitation of local
natural resources and favourable tax treatments. Internalization (I-advantages)
bring about lower transaction costs, maintaining a firms reputation and
minimising technology imitation. Host country determines the specific OLI
advantages, all depending on whether the country is developed or still
developing, the level of industrialisation, market size, presence of technology,
infrastructure and whether the market is monopolistic or competitive (Dunning,
2001).
5

2.2 Horizontal and vertical production

Horizontal activity means that there are larger costs in the beginning – setting
up a production unit in another country but MNE’s can later benefit from saving
form variable costs like transport or tariffs on exported products. For high
income countries, the multinational activity tends to be horizontally focused on
larger markets, for example US MNE’s would start production in Europe to get
closer to the EU market and avoid tariffs and high costs of exporting. However,
there are foreign regulations, tax systems and administration to keep in mind.
Costs can be saved then through economies of scale and lower production
costs.

Vertical activity means moving a part of the production to a different country or
countries. Often the MNE acts as a supplier or distributor. Michael Porter (1985)
explains the competitive advantage of the firm by enhancing the value chain
which means dividing firms’ activities – design, production, marketing and
distribution. The theory suggests that there are different input requirements for
different stages of production and costs can be lowered when production is
split. This often means that the headquarters of a company are in a capital-
abundant country and production is located in a labour-abundant country.

The decision between horizontal and vertical FDI depends on many factors like
the distance and market size. Most of the FDI tends to be horizontal but
veridical production has also become easier due to technological advancement
and open trade environment between countries (Shatz and Venables, 2000).

2.3 Motivations

There are four types of MNE activity identified by Jack Behrman (1972) –
natural resource, market, efficiency and strategic asset seeking. Larger MNE’s
tend to combine two or more of these activities.
6

2.3.1 Natural resource seekers

The natural resource seekers invest to gain access to resources that are either
higher quality, lower price or are unique to host countries. Generally, the output
is then exported to developed industrialised countries. The resources can be
physical – minerals, metals, agricultural products or fossil fuels. This type of
investment is especially popular in Africa. This type of activity requires high
levels of capital and is location oriented. Resource seekers can also be after
human resources – supplies of cheap and unskilled labour. MNEs from
countries with high labour costs tend to move production to lower income
countries. Third type of resource seekers are after technological knowledge,
management or marketing expertise. For example, MNEs from EU and US are
interested in investing in India, South Korea and Taiwan thanks to the low
labour costs and highly skilled workers (Dunning and Lundan, 2008).

2.3.2 Market seekers

The market seekers tend to invest in a particular country or region to supply
goods or services and as a result, costs are saved in terms of transportation
and tariffs, which justifies foreign production. This can be beneficial to sustain
and protect existing markets as well as exploit and promote new markets.
Market is chosen by the size and growth options as well as many other factors
like – global strategy of the MNE, trade policy in the host country, adjacent
markets, cost reduction, possibility of exploiting economies of scale and host
country policy towards FDI (Dunning and Lundan, 2008).

2.3.3 Efficiency seekers

Efficiency seeking activities are often additional to resource and market seeking
investments, the company can gain economies of scale, scope and spread risk
across markets. The intention is to take advantage of factor endowments,
cultures, institutions, demand, market structures and economic policies. These
seekers tend to be large, diversified and experienced. For example, MNE can
7

have information, technology and capital value added activities in developed
countries and labour and natural resource seeking activities in developing
countries (Dunning and Lundan, 2008).

2.3.4 Strategic asset seekers

The fourth type are the strategic asset seekers – these types of MNE’s acquire
assets of foreign companies to advance their global competitiveness, these can
be for example, physical assets or human competences which in turn will bring
about ownership advantages or weaken competitors. This is often done through
mergers and acquisitions which means the company is not necessarily taking
part in everyday activities of running that foreign company but instead improving
the global position of the MNE (Dunning and Lundan, 2008).

3 FDI effects on the host country

3.1 Host country benefits of FDI

Based on popular theory, FDI brings about economic growth in the country. Li
and Liu (2005) found that there is a strong connection between growth and FDI
in developed and developing countries. The amount of positive change depends
on the human capital capability and technologies that are present in the
receiving country. This is called the absorption effect – meaning that the country
needs to have developed institutions, human capital and technological
capabilities to reap maximum benefits from FDI.

In addition to capital gains, positive spill overs are associated with FDI.
Ramasamy et al (2017) found that there were short- and long-term positive
effects on regional productivity from FDI in India, which was further accelerated
by highly skilled labour. Szent-Ivanyi & Vigvari (2012) found that there were
significant technological spill overs from FDI to Central and Eastern Europe
between 2003 to 2007, all of the 4 countries included in the study (the Czech
8

Republic, Hungary, Poland and Slovakia) benefitted from positive effects on
technological improvement.

3.2 Modes of FDI and impact on the host country

Some modes of FDI are considered better than others, bringing about more
positive effects to receiving countries. Greenfield investments are very sought
after, meaning that a new productive unit is created in the host country. Mergers
and acquisitions mean that the ownership of an already existing company
changes. Harms and Meon (2011) found that Greenfield FDI had a stronger
effect on growth in the host country than M&As. This is due to job-creating and
value-added potential of greenfield investment in the host country. M&A’s are
considered cheaper for the MNE as well as quicker in terms of entering the
market and improving competitive position. According to theory - large,
diversified firms that are not intensely focused on research and development
would choose M&A as the mode of FDI. M&A are not as sought after by the
receiving countries due to the fact that it might bring about layoffs or non-
beneficial activities, which can be seen as a threat on national level. However,
these negative effects can be short term and in the long run transfer of
technology, employment and re-investment can occur. The FDI flows consist of
– equity capital (investor buys shares in a foreign company), intra-company
loans (loans between parent company and affiliates) as well as reinvested
earnings (investor reinvests in the host country) (Moosa, 2002).

3.3 Criticism of FDI

Even though positive effects from FDI are profound, many researchers have
challenged the significance. Hanson (2001) found that there are weak linkages
between positive spill overs and FDI to host countries. It is often argued that
FDI will in turn make local firms more productive and competitive, but Hanson
did not find any evidence supporting that claim. In manufacturing sector,
domestic firms had lower productivity growth. In addition, wage spill overs were
not as significant either. In a developed country context, MNE’s often hire highly
9

educated and skilled workers whose salaries are higher in any case and do not
have an overall effect on the wage level. As MNE’s exploit economies of scale
and higher capital availability, often domestic companies are unable to
compete, and this causes the crowding out effect (Lipsey, 2002).

Herzer and Klasen (2008) did not find any long-term effects from FDI to GDP.
There are too many factors and countries differ significantly and whether the
country benefits from FDI depends on a mixture of different factors like sectors,
policies, institutions and regulations. FDI is not a one size fits all solution for all
countries.

4 FDI determinants

4.1 The market

The highest determinant of FDI inflows tend to be the market size, which is
measured by GDP, the higher the country’s GDP the larger the FDI share. This
is supported by Shamsuddin (1994) who found that the most important factor
that MNEs consider when making investment decisions is GDP per capita. This
is further supported by Resmini (2000) who found that investors prefer larger
markets with favourable growth options. Kleinert (2009) states that FDI flows to
large markets. In addition, investors often consider neighbouring markets as
well as markets that are easier to reach from the host country. Moreover,
growth options of the market as well as the size can encourage more FDI. For
example, China has been receiving record levels of investment due to the size
and rapid growth of the market. Historically, most of the FDI has flowed
between OECD countries. The MNEs tend to invest abroad to produce abroad
and serve foreign markets, instead of exporting from home country, which
reduces costs on transportation and tariffs. These costs can be identified as
distance costs. The sales in the foreign market depend on the market size.
Therefore, market size as well as distance from other markets and host country
are all important determinants in investment decision. In addition to all these
factors, market access is also significant, however, future growth possibilities
10

can outweigh market access issues. On the other hand, areas like the EU
market and NAFTA – offering trade freedom and low restrictions, are highly
attractive to investors.

4.2 Labour costs

Lansbury et al (1996) found that FDI flows to Hungary, Poland and Czech
Republic were heavily influenced by low labour costs and played a major role in
location decision making process, especially when the labour was skilled. This
is supported by Bellak et al (2008) – in the European perspective, low labour
costs are important determinants of FDI as well as productivity. Higher labour
costs were seen as a deterrent to FDI. This is further supported by Abdullah et
al (2013) – low labour costs encourage investors to make the investment
decision, especially those who are keen on reducing operational costs.

4.3 Political stability

Political stability in a country is often mentioned as a determining factor when
firms consider making investments. This is due to the adverse impact stemming
from country’s environment on possible MNE cash flows. When the risks
become too high, the MNE would need to divest. The possible political risks
could manifest as – restriction of entry, government intervention (regulating
monopolies, price controls, prices for natural resource exploitation), social
instability (weak political structures, corruption), systems barring FDI flows (high
taxes, weak incentives, equity limits, bans on certain industries), political
violence (crime, war, riots), turbulent relations with foreign countries or investors
and limits on foreign exchange transfers (Moosa, 2002).

Kurecic and Kokotovic (2017) found that larger developed countries tend to
bring in FDI even if there is political turmoil, investors are willing to take the risk
and consider the ease of investment more important. For example, FDI flows to
Russia and Mexico were unaffected even though both countries faced political
risks.
11

Another great example of this is China - the global leader in inward FDI. Even
though the tensions have been high with trade as well as presence of political
uncertainty, many U.S and EU companies decide to invest and stay in China
due to the future growth of a massive market (Bloomberg, 2020).

4.4 Institutions

Institutions are formal or informal constraints that can include laws, property
rights or customs, codes of conduct or traditions. These have a profound impact
on the “rules” in human interactions where enforcement of these institutions is
crucial (North, 1991). It is assumed that organizations behave similarly in an
economy, due to isomorphism – the pressures from environment make
everyone adopt the same norms and professional standards. Organizations
tend to copy behaviours of other firms. Coercive isomorphism comes from both
formal and informal pressures in society. These can include accounting
standards, regulations and pollution control laws. This pressure ensures that
organisations in the environment behave in a manner that is consistent with
others (DiMaggio et al, 1983). Well-functioning institutions can encourage
capital flows, because institutions provide confidence to the investors that the
risks are low. Institutions and economic structures are especially important in
the European context, meaning that FDI flows are very sensitive to institutional
problems, especially political institutions. Low level of corruption, fair judicial
system as well as property rights, fiscal policy, government spending, labour
and business regulations, monetary and trade policies are factors considered by
investors when making an investment decision (Dellis et al, 2017).

Sabir et al (2019) found that institutional quality is crucial and impacts FDI flows
especially in developed country context. Institutions are as important as
macroeconomic variables – profit possibilities are greater in larger markets,
however, if there is a high level of corruption, there is a possibility of
expropriation. Expropriation is the situation where the host country government
would seize properties from a firm.
12

4.5 Taxation

Tax incentives have been found not to be a key determinant of FDI, however,
tax incentives are highly popular tool to be used due to the fact that it is much
easier to provide these rather than for example improving labour skills and
productivity, which would require long term efforts. Tax incentives are easier to
offer than funds for investment as government spending is not required.
Investors tend to value stability, transparency and simplicity of the tax system
over favourable tax incentives. However, if a country has favourable tax
incentives, it might convince investors to re-invest which is an important part of
investment flows. Therefore, having a transparent, stable tax system is an
important determinant to consider when trying to attract FDI (OECD, 2008). Tax
incentives have been proven not to be beneficial, if the other factors present in
the country do not support investment. For example, when Siemens invested in
the U.S. it soon realised that they could not fill the necessary job positions due
to a skills gap in the labour market (White, 2019). Therefore, assumption can be
made that tax incentives are an additional perk, not the main reason to invest.
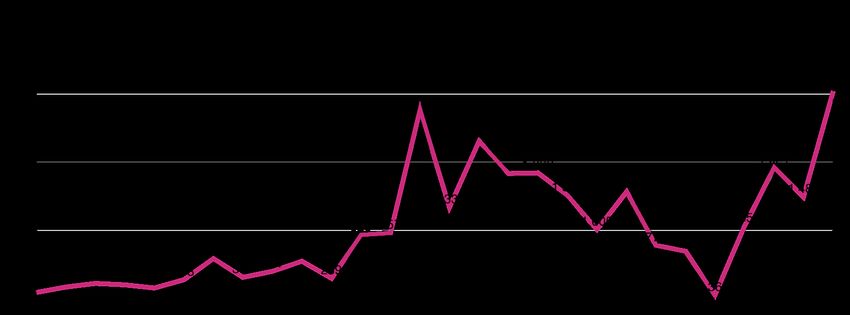
13

5 Estonian economy

Estonia regained independence from the Soviet Union in 1991 after 51 years
and since then a small, closed economy has become an open, middle-income
country, which has greatly benefitted from the membership of EU, free trade
and attraction of FDI.

Figure 1. Estonia’s GDP growth/decline in percentages, 2006-2020. Eesti Pank
Statistics.

The figure above shows the GDP growth and decline between the years 2006-
2020. As a small economy, Estonia is very vulnerable to external shocks which
can be seen by sudden decrease in GDP during the 2008-2009 Great
Recession and again in 2020 during the COVID-19 pandemic. On the other
hand, GDP has been growing steadily throughout the years, especially fast
growth was seen in the years before 2008. Overall, the country has done well
and GDP has grown from 13.5 billion in 2006 to 26.8 billion in 2020 (Eesti Pank,
2021).

5.1 Trade

Estonia is in a trade deficit, meaning that the level of imports is larger than the
level of exports. Estonia exports to Finland, Sweden, Latvia, Russia and the
U.S, while biggest importers are Russia, Germany, Finland, Lithuania and
14

Latvia (OEC World, 2020). Trade made up 141% of the GDP while exports
made up 65.5% of the GDP in 2020, Estonia is affected by the trade trends of
the EU as well as recent protectionist trends. In order to better compete, the
country should focus more on technology intensive and innovative goods and
services as due to the small size of the country, it is impossible to compete in
labour intensive goods production.

Figure 2: Trade Balance 2006-2020. Exports and imports in billions €, Eesti
Pank Statistics.

Participation in the global value chains (GVC) is an important indicator of
participation in the global economy. Over half of the global trade can be
classified into GVCs, the growth being fuelled by technological advancement,
access to markets and resources as well as costs and trade policies. Around
69% of Estonia’s exports are intermediates and the country is an active
participant in GVCs. The benefits from GVC could improve if Estonia focused
more on value creation and value capturing activities like supporting research
and development and owning intellectual property (Ali-Yrkkö et al, 2017).

5.2 Demographics and the labour market

The population of Estonia is 1.3 million and is aging like in many other
European countries. The unemployment rate is relatively low, staying around
6% in recent years. The workers skill base in Estonia does not match the labour
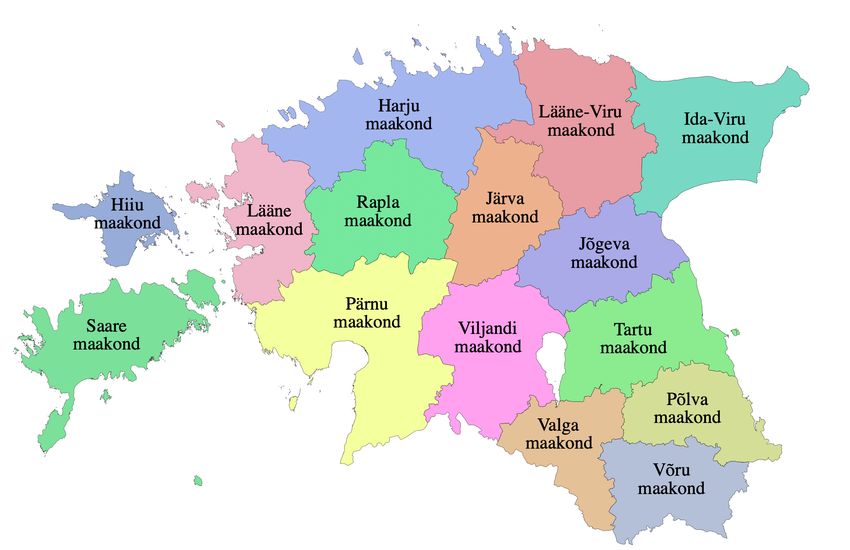
15

market demands. Foreign investors have identified the scarcity of adequately
trained labour as one of the main negative impacts on economic growth.
Ministry of Education and Research (2015) found that over one third of Estonian
workers are overqualified, making the surplus one of the largest when
comparing to other countries in the study. That means many employees are not
getting to use their potential to the fullest in the workplace and could do the
same jobs without the qualifications. This is especially prevalent among older
population, however, since the education was received a while ago, it might not
be up to nowadays standards that employers would require. The education
requirements set by employers are rather too high and should focus more on
actual skills required (Ministry of Education and Research, 2015).

The salaries have been steadily increasing in Estonia, for the past 10 years
average wages have risen 6% per year. There is a surplus of manufacturing
skills, and more and more manufacturers are leaving Estonia due to high costs
which means learning new skills is utmost important for workers to stay active in
the job market.

5.3 Main industries and employers

71% of GDP comes from the service sector, 25% from industrial and 4% from
the primary sector. The largest companies by revenue and employee counts are
grocers Maxima, Selver and Rimi, banking group Swedbank, energy provider
Eesti Energia, telecommunications service provider Telia, telecommunications
equipment manufacturer Ericsson Eesti and passenger transport services
provider Tallink (Eesti Maksu ja Tolliamet, 2021). Only 3 of these are domestic
firms – Selver, Eesti Energia and Tallink. Maxima is a Lithuanian company,
while Rimi, Swedbank, Telia and Ericsson are all Swedish owned.

5.4 Regional differences

Estonia is working hard to reduce regional differences – bigger cities like Tallinn
and Tartu are constantly growing and contributing the most in terms of
16

economic growth and job opportunities. The North (Harju municipality) and
South of Estonia (Tartu municipality) where these cities are located are seeing
larger amounts of skilled workers, active companies and growing populations,
meanwhile East of Estonia (Ida-Viru municipality) is falling behind. 40% of the
population lives in Harju maakond. Regional policy set in place tries to even out
the differences (Siseministeerium, 2021).

Figure 3. Map of Estonia, Geoportal Republic of Estonia Land Board.

5.5 Strengths and weaknesses

One of the biggest strengths of Estonia is the favourable business environment.
According to the 2020 Index of Economic Freedom, Estonia takes the 8th
position in the world. The property rights as well as government integrity are
very highly ranked. Monetary and business freedom are high, the framework is
well regulated and transparent. Investment, trade and financial freedom are
considered very high, government policies do not interfere with FDI flows (The
Heritage Foundation, 2020).
17

The government budget is well balanced and foreign debt levels are kept low,
which creates a stable environment. Economic policy favours growth –
increasing productivity and competitiveness are the key goals. Innovation and
focus on high-value added sectors like IT and engineering as well as
digitalisation is highly favoured.

The geographical location also benefits Estonia greatly as well as being a
member of international organisations. As a small economy, joining EU has
brought along great benefits. Estonia is often described as the connection
between the East and West as well as being close to other Nordic countries is
seen as a benefit.

The biggest weakness is the small market size, which is very prone to external
shocks, however, as seen from the Great Recession and COVID-19 pandemic,
Estonia is able to recover quite quickly. In 2021, economy has grown 12.9%
compared to 2020. The demand for goods and services has risen due to rising
salaries, release of pension funds and using savings, which has also raised the
prices. The quick escalation of prices can be explained through issues in the
supply chain with imports, surging energy prices and manufacturers being
unable to answer the rising demand (Kattai et al, 2021).

One of the biggest threats to sustainable growth of the country is the poor
demographic outlook which will cause labour shortages. The population is
small, birth and immigration rates are low and the population is aging. The
working age population is decreasing every year (EIU ViewsWire, 2021).

The problem which is present in all developed nations – rising inequality is also
prevalent in Estonia. This has also caused political turmoil like in many other
countries – the popularity of the radical right wing party EKRE has been
soaring. This was mentioned by the prime minister Kaja Kallas in the interview
given to FDI Intelligence, how the far-right party has ruined the reputation of
Estonia as a country who does not welcome foreign investors and talent (Miles,
2021). Statements and actions by radical parties can deter investments and
growth.
18

5.6 Future outlook

During the global COVID-19 pandemic that started in 2020, Estonia’s economy
has not suffered significantly and is in better shape than many other EU
countries (EIU ViewsWire, 2021). Estonian economy has grown 12% in 2021
compared to 2020, however some industries are still under the strain of COVID-
19 restrictions and consequences of pandemic are hindering the overall growth
of the economy (Oja, 2021). Recently with the introduction of vaccination
passports, many service and hospitality establishments have been able to
remain open. The government tries not to introduce another lockdown which
would cause further harm to these sectors. The overall predicted growth of
economy is around 5-8% for 2022 (Eesti Pank, 2021).

Household spending has increased, due to people using savings and the
release of the mandatory second pillar pension saving funds. This year the
government made this fund optional – people can decide to withdraw the
savings. Consequently, 1.3 billion was withdrawn from the banks, meaning that
it will boost the economy by household spending in the short term, depending
on the amount of people who decide to spend rather than re-invest. However,
using savings on such a large scale could overheat the economy, making the
growth unsustainable (Eesti Pank, 2021). OECD suggested that this should not
have been allowed as it created macroeconomic instability and pension
inadequacy (OECD Economic Survey of Estonia, 2019).

The job market has seen an increase of job offers and is again suffering from
labour shortages, the unemployment rate is expected to return to 5% in 2022.
Due to rising salaries and withdrawal of savings – the housing market is
booming once again and is very active. Estonian Central Bank is considering
strengthening the mortgage loan conditions to avoid similar consequences as
from the 2008-2009 financial crisis housing market crash (Eesti Pank, 2021).
19

6 Research methodology

All information concerning foreign direct investment – determinants, modes,
motivations and effects will be explored through theoretical framework.
Empirical analysis is conducted to explore the reasons why certain companies
have invested in Estonia. The case study method is in-depth research for a
particular topic or phenomenon with a real-life setting – which leads to
development of a theory. This method is the best to understand what and why
something is happening, drawing from qualitative and quantitative data from a
wide range of sources (Saunders et al, 2019).

Secondary data sources are both qualitative and quantitative – a wide array of
previous studies done as well as books, journals, articles, reports and statistical
information.

FDI has been very widely researched in the previous decades which can prove
difficult in navigating and understanding which sources are objective and
reliable. On the other hand, specific research concerning Estonia is not as
widely available and is often outdated, therefore it is important to make sure
sources are still relevant. Furthermore, subjectivity should be considered when
using sources where the goal is to attract FDI to Estonia – these research
papers could emphasise the positives and downplay the negative sides.

Research validity measures to which extent the data collection accurately
measures what it intends to measure as well as the findings being in line with
what was researched. Validity can be confirmed through triangulation, meaning
that multiple independent sources are used and similarities in results analysed
(Saunders et al, 2019).
20

7 Findings

7.1 History of FDI

FDI has played a crucial role in the past 30 years transforming Estonia from a
centrally planned economy to a free-market economy. Estonia regained
independence from the Soviet Union in 1991, the FDI flows immediately surged
due to wave of privatisation and low labour costs (Duran, 2019). In the 1990s
the “shock therapy approach” was used which meant privatisation, fiscal policy
to reduce budget deficits, lowering government intervention and price liberation.
Kroon, the Estonia’s own currency was established in 1992, which was pegged
to the German mark. The economy suffered from high levels of inflation and
losing the biggest trading partner – the Soviet Union. By 1998, the inflation rate
stabilised. In the beginning Estonia mostly focused on manufacturing, by 1999
the country became more service based – transportation, retail, wholesale and
real estate were the largest sectors. Estonia was attractive as an FDI receiver
due to skilled labour, low wages and undervaluation of Kroon (Weikert, 2018).

Figure 4. Inward foreign direct investment flows to Estonia, UNCTAD statistics.

FDI to Estonia surged again when joining the European union in 2004 and in
2005 Estonia’s Hansapank was taken over by Swedish Swedbank. In 2006
reinvested profits raised significantly and greenfield investments decreased.
The FDI flows saw a drop during the Great Recession of 2008-09 and positive
trend was seen again in 2016 (Varblane, 2020).
21

Figure 5. Inflow of foreign direct investment by country, Eesti Pank Statistics.

The largest investors to Estonia have always been Sweden and Finland, other
largest investors in the last decade have been the Netherlands, Lithuania and in
recent years Luxembourg and Germany.

7.2 Composition of investment inflows to Estonia

The financial sector brings in the largest amount of FDI to Estonia, followed by
real estate, manufacturing and wholesale and retail. Science and engineering
have been growing in the recent years as well as information and
communication. Investment flows to agriculture are relatively low. The high
number of investments to the financial sector can be explained by the fact that
the biggest banks in Estonia have been acquired by foreign companies.
22

Figure 6. Direct investment position in Estonia by field of activity, Eesti Pank
Statistics.

Historically most of the investments to Estonia were low value added – in recent
years greenfield investments made up only 18% the overall FDI flows. However,
surprisingly during the COVID-10 pandemic, Estonia managed to rise to the 5th
position in the world in Greenfield Performance index 2021 (McGarrity, 2021).

Figure 7. Greenfield projects in Estonia 2003-2020, UNCTAD statistics.

The number of greenfield investments has risen in recent years since hitting an
all-time low in 2015. In order to improve, Estonia would need more specialist
and highly skilled workers to meet the needs of investors.

7.3 Comparison to other Baltic countries

Comparing Estonia to Baltic neighbouring countries is appropriate due to
historical similarities. However, Lithuania’s population is 2.7 and Latvia’s is 1.9
compared to only 1.3 million habitants in Estonia. Since the decline in 2015,
Estonia has been gaining momentum and has reached higher inflows than
Latvia and Lithuania.
23

Figure 8. Inward FDI flows to Estonia, Latvia and Lithuania in Millions USD.
Eesti Pank Statistics.

8 Determinants and motivations

8.1 Determinants

Shamsuddin (1994), Resmini (2000) and Kleinert (2009) agree that the highest
determinant of FDI inflows is the market size, which is measured by GDP.
Investors tend to favour large markets with probable growth options. Market
access is also considered an important factor. GDP includes private and
government spending, investments and net exports. Estonian population is only
1.3 million people: it is considered a small market, therefore by this determinant,
Estonia should not be as attractive as it is one of the smallest markets in
Europe. However, since the country belongs to EU, ease of access to other
nearby markets is a considerable factor for investors.

Lansbury et al (1996), Bellak et al (2008) and Abdullah et al (2013) all found
that labour costs are an important determinant of when making investment
decisions, especially when it comes to production. MNE’s tend to prefer
countries with highly skilled labour and low costs. Estonia is facing a difficult
situation, falling into the middle-income trap, meaning that large corporations
are not finding Estonia attractive due to rising labour costs and suffering profit
margins (Duran, 2019). Furthermore, the lack of skilled and unskilled workers
24

means Estonia is unable to attract and compete with larger European
populations (World Bank, 2020).

This can be seen in the trend of moving production away from Estonia. Most
recently, the global company ABB decided to close its production facilities due
to rising costs and is planning to open the unit somewhere else in Europe (Pärli,
2021). Another example is PKC group – the company closed its production
units and moved them to Lithuania and Russia, where the labour market is
larger, and the costs are lower. This was a huge loss to the country as the
company was one of the biggest exporters in Estonia (Tubalkain, 2016).

Estonia is considered a politically stable nation, however, there are many
challenges and threats the country faces. Estonia has a multiparty system and
these have proven to be unstable in the past, worryingly Conservative People’s
Party Of Estonia has gained popularity in the recent years which could mean
that international relations could suffer due to this party being very anti-EU and
foreigners. Estonia has a good relationship with its neighboring countries,
however, tensions with Russia remain high. Since being a former member of
the Soviet Union, Estonians feel very passionate about the situation in Ukraine
and Belarus, it can be assumed that Estonia would support further sanctions set
against Russia by the EU (EIU ViewsWire, 2021).

Institutions are a crucial determinant of receiving FDI inflows meaning the rule
of law, regulatory efficiency and openness all must be favorable. Estonia’s
government integrity is very high – property rights and contracts are respected
and expropriation is not permitted. The judiciary is not affected by politics. There
are some issues with corruption however these incidents are rare. The country
also has high levels of labour, monetary and business freedom (The Heritage
Foundation, 2020).

Estonia’s tax system is considered the best in the world for the past 7 years.
The International Tax Competitiveness Index by The Heritage Foundation
(2020) measures a country’s tax system through neutrality and competitiveness.
Estonia does not have taxes on reinvested and retained profits and 20% tax
25

rate for distributed profits. According to Enterprise Estonia, 98% of taxes are
declared online and the process is quick and transparent.

8.2 Motivations and FDI trends

The investors motivations can be market, strategic asset, natural resource or
efficiency seeking. According to a study conducted by Varblane et al (2020) the
investors expressed that most important factor when investing in Estonia is the
stability of the economy, skilled labour, favourable tax system, developed
infrastructure and digital services. The least important factor was natural
resources, which Estonia lacks. In the past, motivations to invest in Estonia
were more towards efficiency seeking – labour costs and electricity prices were
deemed as more important in the questionnaire conducted in 2009 and had
significantly lost importance in 2019. Additionally, the importance of technology
has risen dramatically from 2009. Investors also mentioned logistical positions
as one of the reasons for investing – closeness to other markets in the Baltic
States as well as Scandinavian countries. The steady growth of the economy
was also mentioned as one of the reasons why investors would choose Estonia.

9 Recent investments

9.1.1 Nordic countries

Recent notable investment came from Sweden/Finland – MCF Group (81
million) – to build a large data centre in the outskirts of Tallinn, which is
considered one of the biggest investments in IT in recent years. This investment
will make Estonia more attractive to other companies, since there is a place to
safely store their data nearby. The MCF group stated that Estonia is a great
“gateway between east and west” and goals were to get closer to Eastern
European markets. The attractiveness of the tax system, economic stability and
good reputation were also pointed out by the company as one of the reasons for
choosing this location (Männi, 2020).
26

Stora Enso, Finnish manufacturer of pulp, paper and other forestry products has
opened a Financial Services Centre in Tallinn. In addition to creating a financial
services hub, the company found that it’s a great way to evaluate activities and
efficiency, finding improvement in their processes – automation and robotics will
ensure that people can focus on creative and value-adding analytical tasks
(Invest in Estonia, 2019).

The Finnish company Ensto Ensek AS – named the investor of the year 2021 –
managed to grow even with the global pandemic and offered 90 extra jobs to
Estonian workers – for example from the service sector that was put on hold
due to COVID-19. Ensto Ensek is constantly growing meaning that facilities
need to increase production volumes – Estonia receives the largest capital
flows in Ensto group. Recently the company has invested 2 million euros in
silicone production at the Keila factory. The company is interested in automation
– robots for transportation as well as environmentally friendly digitalisation –
going paperless in the production process. Ensto Ensek explained the interest
in Estonia due to highly skilled ambitious workers as well as technological
advancement, flexibility and adaptability. Enterprise Estonia is working closely
with Ensto group by offering consultancy services, the success story of Ensto
Ensek shows that is important to take care of long-term investors as well as
new investors (Mäe, 2021).

Recently the Finnish circular economy company Swappie has opened offices in
Tallinn. This brought Estonia 200 new jobs which is predicted to double to 400
in the year 2022. This was a good example how even during the pandemic
times and economic uncertainty, it is possible to set up a unit in Estonia.
Swappie Estonia will focus on automation of their processes so human
resources can be best utilised (EAS, 2021).

HANZA, a global manufacturing company, headquartered in Sweden, has
invested 8 million euros to their production unit in Estonia. HANZA employs
around 650 people in Estonia so far and is planning to open a new facility in
Tartu in 2022. The new plant’s location is chosen due to logistics and will utilise
efficiency and sustainability. The company is considering nearshoring
27

production to Europe from Asia. The business development unit in Sweden
explained that Estonia has many advantages – logistical position and short-
decision making as well as the ability to support production with local labour
force (Liive, 2021).

9.1.2 The Netherlands

One of the top 10 foreign investments of 2020 was from Van Oord, a Dutch
maritime contracting company. The plan is to build an offshore wind farm in the
Saaremaa region. This would help Estonia reach green energy goals for 2030
as well as creating 200 new jobs in Saaremaa region. Creating a fishing farm is
planned as well, currently most of the fish consumed is imported (Lember,
2020).

9.1.3 Germany

FDI flows from Germany have surged in the recent years with many companies
discovering Estonia as an excellent destination for investment. In 2020, Birkle IT
opened offices in Tallinn, the company explained reasons behind choosing
Estonia – haven of IT expertise, digitalisation and speed and absence of
bureaucracy which is very prevalent and complicated in the German business
world (EIA, 2021).

Arvato Financial Solutions has recently expanded their business in Estonia by
opening up a new Innovation and Development office in Tallinn, the company
focuses on cybersecurity and e-commerce solutions. The company has a very
diverse set of employees and finds that the residency and work permit system is
very easy and fast – also there is no quota on IT sector for international
workers. Arvato has invested in the IT education in Estonia and works with
students from TalTech and Tartu universities. The company offers at least
double of an average salary as well as growth opportunities on a global level
(Hellrand, 2019).
28

The car manufacturer Volkswagen has opened up two subsidiaries in Estonia
which will support VW software business, offer legal support and look after
intellectual property. There are already future plans in place to expand which
include software development. The presence of self-driving transport
developing start-ups like Starship and Cleveron helped spark the interest in the
German conglomerate (Liiva, 2020).

Siemens established a Nordic Engineering Center in Estonia, which provides
central design and configuration services to other Siemen’s offices in the region.
The company is also planning to increase the worker base. Siemens explained
the investment decision through lower salary levels for engineers and Estonia’s
reputation as a digital pathfinder (EIA, 2021).

10 Recent trends

In 2020 due to the global pandemic, FDI flows fell 42%, the biggest decline was
seen in developed countries, especially in Europe and United States. Asia fared
better than other regions with China reaching the 1st position in the world. There
is no significant growth predicted for 2021. M&As are predicted to be preferred
by investors as these pose lower risks than the new greenfield projects.
(UNCTAD, 2021)

The largest FDI flows globally to renewable energy sector, real estate,
communication, electronic components, software IT services, food and
beverages. The world is moving away from fossil fuels, these projects have
reduced by 87.3% (O’Farrell, 2021).

10.1 Geographical location and nearshoring

The new global movement of “nearshoring” is bringing production lines back to
Scandinavian and Baltic regions as companies are starting to prefer producing
nearby, rather than in Asian countries (O’Farrell, 2021). Estonia’s geographic
location and closeness of culture to Nordic countries like Finland and Sweden is
encouraging investors to bring their business to Estonia. For example, the
You can also read