Building Homes for Generation Rent - Can institutional investment meet the challenge?
←
→
Page content transcription
If your browser does not render page correctly, please read the page content below
Briefing

           Building Homes for
           Generation Rent
           Can institutional investment meet the
           challenge?

           Vidhya Alakeson, Katie Blacklock, Sandra Halilovic, Tim Rothery and Nick Salisbury

           October 2013

           © Resolution Foundation 2013

                                               E: info@resolutionfoundation.org        T: 020 3372 2960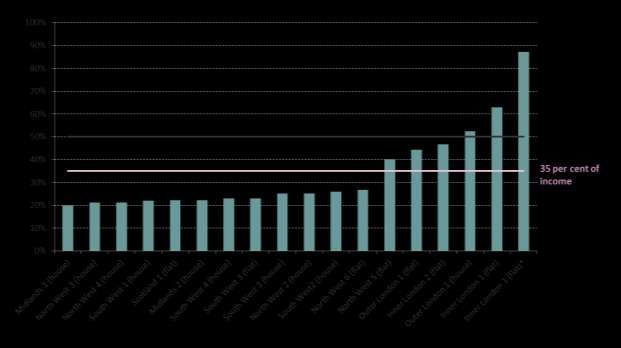
Resolution Foundation Page 2
Contents

Acknowledgements .................................................................................................. 4

About the Authors ................................................................................................... 5

Executive Summary .................................................................................................. 6

Introduction .............................................................................................................. 8

Section 1: A national build to rent portfolio ............................................................ 11

Section 2: Investor returns...................................................................................... 20

Section 3: Scheme optimisation .............................................................................. 27

Section 4: Leverage and the role of a government guarantee................................. 35

Section 5: Improving affordability ........................................................................... 38

Section 6: Conclusions and recommendations ........................................................ 40

                                                  Resolution Foundation                                                 Page 3
Acknowledgements
We are sincerely grateful to our housing partners for providing us with extensive information, input and
feedback without which we could not have developed the financial model presented here. Special thanks
to Ben Clay, Fiona Coventry, Olivia Harris, Mark Jones, Sandy Kelly, Vic O’Brien and Darren Warburton. We
are also extremely grateful to the Joseph Rowntree Foundation and National Housing Federation for
supporting this project, especially to Kathleen Kelly and Stuart Ropke.
Many people have provided input into the development of the findings presented here and we are
extremely grateful to them for their time, advice and invaluable feedback. These include: Andrew
Appleyard, Jenny Buck, Graham Burnett, Oliver Campbell, Pete Gladwell, Brian Ham, Amelia Henning, Nick
Jopling, Michael Lamyman, Kurt Mueller, William Nicoll, Richard Parker, Katherine Rodgers, Rosalind Rowe,
Cathryn van der Spar, Stephen Stringer, James Wardlaw, Christine Whitehead and Peter Williams.
In developing this report, we have benefited from the help and hard work of Jonathan Godwin at Social
Finance, to whom we are extremely grateful.
This report represents the views of the authors and not those of any individual or organisation that has
supported the work or provided advice and input along the way.
Resolution Foundation Page 4About the Authors
Vidhya Alakeson is Deputy Chief Executive at the Resolution Foundation
Katie Blacklock is a Fellow at the Resolution Foundation
Sandra Hallilovic is an Associate at Social Finance
Tim Rothery is an Associate Director at Social Finance
Nick Salisbury is a Director at Social Finance
Resolution Foundation Page 5Executive Summary
There is an urgent need to increase the supply of housing in the UK to address the growing affordability
problems faced by low to middle income families. We need to increase the supply of all types of housing
in view of the scale of the challenge. But given that large numbers of low to middle income families are
shut out of home ownership for the medium to long term and do not qualify for social housing, addressing
supply must include a focus on market rent homes. Market rent is no substitute for an adequate supply of
social and affordable housing, but it could play a greater and more positive role in addressing the UK’s
acute housing needs.
In doing so, we must also offer a better deal to ‘generation rent’ based on purpose-built properties, more
professional management, more affordable and transparent rents and greater security of tenure. The UK’s
private rented sector remains characterised by individual landlords, older properties, short term tenancies
and variable quality. Changing the offer is particularly important for families with children, who now make
up a third of the 3.8 million households living in the private rented sector.
A purpose-built rented sector managed by professional landlords and financed by institutional investors
such as pension funds and life companies offers the potential to deliver a greater supply of market rent
properties alongside a better deal for tenants. Institutional investment underpins the build to rent sector
in the US and in several other European countries but despite a number of attempts in the last decade to
secure investor backing to kick start the sector in the UK, it has so far failed to take off.
A central question underpinning its slow development is the extent to which a better deal for tenants is
compatible with investor expectations. And, if build to rent represents a viable proposition for investors,
can it meet the affordability needs of low, modest and middle income families in different parts of the
country or is it only a solution for higher income tenants in London?
The analysis presented in this report attempts to take the debate over build to rent to the next stage by
using real data from actual or planned developments and examining where and how build to rent might
work, what the improvements for tenants could be, what the returns for investors might look like and
where the key challenges lie.
This analysis demonstrates that build to rent can deliver an affordable, more secure rental product for
modest and middle income tenants in different parts of the country at the same time as delivering a
competitive return for institutional investors at relatively low risk. From an investor perspective, the
return from build to rent set out here offers a degree of inflation hedging, with rents expected to rise in
line with CPI over the long run, and the build to rent asset class also offers significant opportunities for
diversification within an overall investment portfolio.
Despite these clear opportunities, build to rent has been slow to take off because, while it does not
require public subsidy or significant policy change, it does depend on effective partnerships between
housing providers and investors to address historic concerns around scale and the risks associated with
residential investment, as well as careful site selection and the efficient delivery of schemes. To date,
these necessary ingredients have rarely come together.
Resolution Foundation Page 6The return profile of the build to rent portfolio
The national portfolio presented here comprises 16 sites built and managed by six housing partners with
an overall development value of £140 million. The 778 units that make up the portfolio provide tenancies
of three years for those who want to stay longer term.
The portfolio delivers a 3.9 per cent income return and a 6.5 per cent total investor return (IRR, assuming
modest inflation of 2.5 per cent per annum).
This initial return can be significantly improved by making careful choices about the nature and
management of the portfolio rather than any policy or legislative change, including:
- Careful site selection - build to rent will not deliver competitive returns in all areas;
- An increase in average tenure from its current average of 19 months to 38 months as a consequence of
providing greater security and a better offer for tenants.
- A 15 per cent reduction in land costs in line with the use of a ‘PRS only’ covenant;
- A 5 per cent reduction in build costs as the sector matures and gains efficiency in developing property
specific to the private rented sector;
If optimised in this way, income returns improve from 3.9 to 4.7 per cent and the total investor return
rises from 6.5 to 7.2 per cent over the same ten year period. Further improvements to returns could be
made through the application of the £10 billion government debt guarantee for the private rented sector.
On the basis of a 4.25 per cent interest rate (using similar existing guarantees as a benchmark) and 50 per
cent gearing, the total return to equity investors from the national portfolio rises from 6.5 per cent to 8.3
per cent, on a comparable basis
However, even with careful site selection and the efficient delivery of schemes, build to rent is unlikely to
work for low income tenants without significant public subsidy, such as a reduction in the price of land.
Therefore, the development of build to rent needs to sit alongside efforts to increase the supply of
affordable and social rent homes rather than acting as a substitute for them. Local strategic priorities
must be the deciding factor as to the mix of housing types required in each area.
While our analysis shows that developing a viable build to rent product does not require policy or
legislative change, further action by national and local government and other stakeholders would
encourage greater activity. Central to this is the use of public land to stimulate the market. The Homes
and Communities Agency, Greater London Authority and local authorities should designate a proportion
of their public land for private rented sector development only. Furthermore, local authorities need to
recognise that build to rent provides lower returns than build for sale and adjust their affordable housing
and other planning requirements accordingly. If not, build to rent will continue to lose out to the higher
return build for sale market.
Alongside other initiatives to stimulate house building, the development of build to rent could be an
important new source of housing supply in the UK and a way of providing long term modest and middle
income tenants with more affordable, more secure and more professionally managed homes.
Resolution Foundation Page 7Introduction
It is well documented that the UK has a housing supply shortage which is the result of the year on year
failure to build enough homes to keep up with demographic change. This has kept house prices
historically high despite the recession and downturn.1 In 2012, the median house price in England was
seven times the median wage compared to only four times the median wage in 1997, with median prices
in inner London boroughs averaging 10 times the median wage.2
Although very low interest rates have kept home ownership within reach of some who would otherwise
have been priced out, high prices have pushed it beyond the reach of many low to middle income
households. Even the high loan to value mortgages on offer under the government’s Help to Buy scheme
leave properties in nearly half of all local authorities out of reach of a low income family on £22,000 a year
unless they spend more than 35 per cent of their net income - a commonly used measure of affordability -
on monthly mortgage payments.3
Many of those who are priced out of ownership will be long term renters. The proportion of households
living in the private rented sector has increased from 10 per cent of all households in 2001 to 17 per cent
in 2010.4 This creates a need to focus specifically on increasing the supply of market rent property. In
particular, with a third of these 3.8 million households being families with children, there is a specific
demand for properties to meet their requirements which are often substantially different to those of the
younger, more mobile tenants who have historically comprised the private rented sector.5
The UK rental market is currently characterised by small buy-to-let landlords who own one or two
properties each. Outside of social housing, rental property is not purpose-built but is built for sale and
sold to buy-to-let investors. Only 10 per cent of the market is made up of large, professional landlords
with significant portfolios (defined as more than 10 properties).6 This means that the current market
tends to be variable in quality and provide only one core product: assured short-hold tenancies of six
months to a year.
In the context of the changing profile of tenants and the growth of long term renting, there have been
several attempts in the last decade to kick start a purpose-built, professionally managed build to rent
sector similar to that in the US and in many parts of Europe. In other countries, the growth of this sector
has been part funded by institutional investors such as pension funds and life companies that have been
drawn into the sector by government action in the form of incentives or requirements. For example, in
Switzerland where institutional landlords own nearly a quarter of PRS units, institutions are required by
law to invest in real estate and residential properties form an important part of that allocation.7
In the UK, institutional investment in residential property has tended to focus on social housing, although
more recently there have been several London-based private rented sector deals announced. In January
this year, M&G Investments announced its purchase of 401 market rent homes in the Stratford Halo
development on the edge of the Olympic Park from Genesis Housing Association in a 35-year deal worth
£125 million.8 In August 2013, Essential Living, funded by the American investor, M3 Capital Partners,
1
Doherty, A. (2013) The Case for Investing in Affordable Housing, London: Schroders.
2
DCLG, Ratio of median house price to median earnings by district, from 1997, available at http://data.gov.uk/dataset/ratio-of-
median-house-price-to-median-earnings/resource/3a73de15-73df-487c-9144-111f09f5912f
3
Resolution Foundation analysis of Hometrack data 2012-13
4
DCLG English housing survey homes report 2010
5
De Santos, R. (2012) A Better Deal: Towards more stable private renting, London: Shelter
6
DCLG (2010) Private Landlord Survey, London: TSO.
7
Scanlon, K. and Kochan, B. eds. (2011) Towards a sustainable private rented sector. The lessons from other countries, London:
LSE.
8
http://www.insidehousing.co.uk/finance/investor-ploughs-%C2%A3125m-into-groundbreaking-prs-deal/6525252.article
Resolution Foundation Page 8announced the first institutionally funded market rent development project in London, in Elephant and
Castle.9
With the intention of stimulating greater market activity, in 2011 the government commissioned an
independent review led by Sir Adrian Montague to investigate the barriers to institutional investment in
build to rent in the UK. The government responded to the review’s recommendations by putting in place a
build to rent equity fund, committing to a £10 billion debt guarantee and establishing a task force to
stimulate the development of this new asset class. Short-listed projects from the first round of the build to
rent fund are currently going through due diligence, with a second round opening in the autumn.10
A central question underpinning the slow development of build to rent in the UK is the extent to which
the returns from these purpose-built, market rent schemes can meet investor expectations? What is the
risk and return profile that market rent developments can deliver in different parts of the country and
how does that match the expectations of different kinds of investors? How can these risks be intelligently
shared between the different parties involved? If build to rent can deliver a viable investment proposition,
can it also offer a better deal for tenants and which groups of tenants can it serve? Does build to rent
represent a viable investment proposition outside of top quartile developments in London?
This report shows that a geographically diverse market rent portfolio can deliver a competitive investment
proposition without assuming above inflation rental or capital growth if sites are carefully selected,
development and management costs are optimised and the portfolio benefits from a reduction in the
costs of debt through a robust government guarantee. None of these measures requires policy change but
simply the optimisation of existing opportunities. In meeting investor expectations, the portfolio can also
offer modest and middle income families a more secure, professionally managed rental product at a
reasonable rent in most parts of the country. However, build to rent is unlikely to work for low income
tenants without significant support from government because the level of rent that would be affordable
to these tenants cannot on its own support a viable investor return. We can, however, estimate the scale
of support which would be necessary.
This report intends to advance the debate on the viability of build to rent and is based on the
development of a detailed financial model. The modelling has been led by the independent think tank, the
Resolution Foundation, and the not-for-profit financial intermediary, Social Finance, in partnership with
six housing providers: Dolphin Square Foundation; Derwent Living; GreenSquare Group; Great Places:
Home Group; and Plus Dane. Five of these housing organisations are Registered Provides and the sixth is a
charitable housing provider. The financial model has been developed with the same level of robustness
that would be expected from a commercial venture and is based on development and management costs
and rents provided by each housing provider on actual or advanced pipeline developments. The returns
have been scrutinised by a range of investors and the findings presented here reflect the input of a
significant amount of investment expertise.
Section 1 of this report describes the build to rent portfolio that has been put together across the six
housing providers, setting out its scale, location, development costs and the deal it offers to tenants.
Section 2 looks at the returns from the portfolio, focusing first on the income that can be expected from
the rent once management and other costs have been deducted and then considering the combined
income and capital return that investors can expect. The returns presented in this section are based on a
set of assumptions about inflation, capital structure and taxation that have been informed by investor
feedback gathered as part of the project. Section 3 looks at a range of strategies for improving returns.
9
http://www.london.gov.uk/media/mayor-press-releases/2013/07/mayor-announces-groundbreaking-housing-deal-for-
elephant-and
10
http://www.homesandcommunities.co.uk/ourwork/private-rented-sector
Resolution Foundation Page 9Section 4 discusses the potential impact of the government guarantee and Section 5 looks at approaches
to improving affordability for tenants. Finally, Section 6 presents a set of conclusions and
recommendations for national and local government, housing providers and investors.
Resolution Foundation Page 10Section 1: A national build to rent portfolio
This project set out to develop a financial model for build to rent that would demonstrate what returns
investors could reasonably expect from this emerging asset class. As part of this overarching aim, the
particular approach to build to rent that we have adopted and is presented here has been shaped by the
requirements of the different stakeholders involved: tenants, housing providers and investors.
From a tenant perspective, our aim was to target those tenants who are unlikely to be eligible for
affordable housing but for whom the private rented sector currently does not provide a compelling offer.
We therefore sought to create a portfolio that was predominantly market rent but not one targeted at the
top quartile of the rental market. We were looking to test the investment viability of a rental product that
would be affordable to families on low to middle incomes. We also wanted to improve on the standard
product currently available within the private rented sector by offering a purpose-built, professionally
managed product that would provide greater security of tenure.
From an investor perspective, we set out to create a portfolio that would provide adequate scale– around
£150 million of assets as a starting point.11 We also wanted to test the extent to which there were viable
investment opportunities nationwide not just in London and the South East and, therefore, sought to
assemble a national portfolio.
While not all of the housing providers we worked with were insistent on taking the rental units off-
balance sheet once they were built and let, the majority were looking for an opportunity to recycle their
capital by selling the units on to an investor. We, therefore, adopted an approach that did not involve the
housing providers retaining significant long term ownership or providing on-going rental or void
guarantees. However, they do retain the Operations & Maintenance (O&M) contract for the units that
they each build on a fixed price basis. Developments are typically in areas where they have significant
existing operations.
Defining low to middle income tenants
This report considers affordability from the perspective of three different levels of net
income after taxes and benefits:
A low income family – a couple with one child at the 25th percentile of the
working-age household income distribution with a net income of £18,583
A modest income family – a couple with one child at the 35th percentile of the
working-age household income distribution with a net income of £21,962
A middle income family – a couple with one child at the 50th percentile of the
working-age household income distribution with a net income of £27,584.
In all cases, we assume that a couple with one child lives in a two bedroom property.
Putting these objectives together, we assembled a theoretical build to rent portfolio made up of real
development sites and input costs provided by the six housing providers. We assumed that each of the six
housing providers would contribute units from developments in its own geographic area to a single
national portfolio. The entire portfolio would be purchased by a single investor or investment fund once
the units were fully built, tenanted and the rental income stabilised. By selling the units on, the
11
Alakeson, V. (2012) Making Institutional Investment in the Private Rented Sector Work, London: The Resolution Foundation.
Resolution Foundation Page 11developments would not tie up the balance sheets of the housing providers over the long term. The rest
of this section describes the portfolio and its offer to tenants.
The portfolio
Pooling developments across the six housing providers results in a geographically diverse portfolio of 16
developments and 778 units. The portfolio comprises market rent developments, except for two London-
based developments which are offered at a sub-market rent (75 per cent and 50 per cent of market rent
respectively) as part of the terms of a Section 106 agreement.
Figure 1 below shows where in the country the 16 developments are located and Figure 2 shows the
distribution of unit types – flats or houses by number of bedrooms - within the portfolio. Of the total 778
units, 482 (62 per cent) are houses and 296 (38 per cent) are flats. Two and three bedroom units are most
common, comprising 82 per cent of the portfolio. Compared to existing market rent stock, the portfolio
has a higher percentage of two and three bedroom properties and a greater proportion of houses rather
than flats. This makes it well suited to low to middle income families with children looking for larger
properties and houses with gardens rather than flats.
Figure 1: Map of 16 developments in build to rent portfolio
Scotland:
60 units
NW:
270 units
The Midlands:
28 units
SW:
164 units
London:
256 units
– development
Resolution Foundation Page 12Figure 2: Distribution of unit types within the portfolio
Distribution of Flats by Number of Bedrooms Distribution of Houses by Number of Bedrooms
3 Bed, 7, Studio, 4,
3% 1% 4 bed, 76,
1 Bed, 62, 16% 2 Bed, 118,
21%
24%
2 Bed, 223,
75% 3 Bed, 288,
60%
Total: 296 Total: 482
The combined portfolio of 778 units has a total development value of £140 million or £180,000 per unit.
Given that five of the six housing providers we worked with are Registered Providers (RPs), we have been
able to keep development costs competitive because RPs can capitalise on relatively low borrowing costs
for the development phase. Table 1 provides a breakdown of the development costs of the portfolio by
unit type and region.
Table 1: Characteristics of the 16 developments by unit type and region
Development Characteristics - Full Portfolio
Unit Summary Number % of Total Units
Total Units 778 100%
By Unit Type:
Studios 4 0.5%
1 beds 62 8%
2 beds 341 44%
3 beds 295 38%
4 beds 76 10%
By Region:
Central London 104 13%
Outer London 152 20%
South West 164 21%
Midlands 28 4%
Northwest 270 35%
Scotland 60 8%
Development Costs: Aggregate Average by Unit
Construction Costs (£82,058,785) (£105,474)
Land Costs (£29,151,793) (£37,470)
Other Development Costs (£11,527,005) (£14,816)
Administrative, Regulatory and Other Costs(£10,788,822) (£13,867)
Developer Margin (£6,676,320) (£8,581)
Total Development Costs (£140,202,725) (£180,209)
Resolution Foundation Page 13The total development cost includes any Section 106 and Community Infrastructure Levy costs related to
infrastructure that would be required by the local authority in question. These amount to 16 per cent of
the administrative and regulatory costs shown in Table 1 and 1.3 per cent of total development costs. The
development cost also includes a 5 per cent developer margin that is payable to the housing providers.
This is much lower than the 20 per cent developer margin that private sector developers would expect if
they were taking full risk on the development and reflects the fact that there is a committed exit to
investors. The margin, therefore, only covers the risk that the housing partners bear for the stabilisation
period. In the majority of cases, this risk was felt to be relatively small because of the high demand for
quality, affordable market rent stock among tenants. However, the extent to which housing providers can
accept a 5 per cent developer margin would have to be judged on a case-by–case basis.
It is worth noting that a change to the regulation of Registered Providers to clearly separate social housing
activity from market-based activity, whether market rent or for sale, would increase the development
costs presented here. RPs would no longer be able to secure the preferential borrowing rates that they
currently enjoy for market based activity because they would no longer be able to draw on their wider
corporate covenant. They would also have to add in a more significant developer margin than the current
5 per cent because their private rented operations would be smaller in scale and could, therefore, not
absorb the level of risk they can currently manage across the wider organisation. By increasing
development costs, both elements would ultimately dampen returns.
Tax
Liability for several taxes arises at the point of sale of a property asset. For the purposes of this model, we
have assumed that Stamp Duty Land Tax (SDLT) will be levied on a multiple dwellings basis on each of the
16 developments. Based on the average unit price per development, 14 of 16 developments incur an SDLT
rate of 1 per cent and two incur a 3 per cent rate.
Corporation Tax and Capital Gains Tax are also charged on the sale of the assets but for the purposes of
this model, we assume that neither would be paid. As the majority of RPs and housing providers have
charitable status they and their subsidiaries will not be liable for corporation or capital gains tax if the
profits are used by the charity to further its charitable objective.
While the charge of capital gains or corporation tax at the point of sale to the investment vehicle does not
impact returns for the investor, it clearly has a significant bearing on returns to the housing providers. It
will therefore be important that the right structures are in place internally before housing providers
embark on developments of this kind.
We have assumed that VAT will not be payable by the investment vehicle because as the first sale of a
new build residential property, the transaction will be zero rated for VAT. The purchaser will be able to
recover VAT on purchase costs.
Affordability
The weekly rents for two bedroom properties in each development are shown in Table 2 below. Where
developments include flats and houses or different rent levels within the development, these are shown
separately. The rents span a broad range from £115 a week to £500 a week for two bedroom properties in
2014. Therefore, affordability will vary across the portfolio.
Resolution Foundation Page 14Table 2: Weekly rents for the two bedroom properties across the 16 developments
Development* Weekly Rent (£)
Midlands 1 (house) 115
North West 3 (house) 121
North West 4 (house) 121
South West 1 (house) 126
Scotland 1 (flat) 127
Midlands 2 (house) 127
South West 4 (house) 131
South West 3 (flat) 132
South West 3 (house) 144
North West 2 (house) 144
South West2 (house) 149
North West 6 (flat) 153
North West 5 (flat) 230
Outer London 1 (flat) 254
Inner London 2 (flat) 267
Outer London 1 (house) 300
Inner London 1 (flat) 360
Inner London 1 (flat)** 500
*Development NW1 is not shown in Table 2 because it only comprises 3 bedroom properties.
**£500 weekly rent for Inner London 1 provides an internal cross subsidy to make other flats in Inner
London 1 more affordable.
Given that our target market for this portfolio is low to middle income families, we assess the affordability
of the developments in the portfolio from the perspective of a couple with one child at three different
levels of net income after taxes and benefits: £18,583 representing a low income family at the 25th
percentile of the working-age household income distribution; £21,962 representing a modest income
family at the 35th percentile; and £27,584 representing a middle income family at the median. Figures 3, 4
and 5 show the percentage of net income each family would pay to rent a two-bedroom property. Where
developments include flats and houses, they are shown separately as the rents differ.
Resolution Foundation Page 15Figure 3: Affordability for a low income family at the 25th percentile of the income distribution (UK)
Figure 4: Affordability for a modest income family at the 35th percentile of the income distribution (UK)
Resolution Foundation Page 16Figure 5: Affordability for a middle income family at the median of the income distribution (UK)
It is difficult to set an absolute threshold for the percentage of net income that a family should spend on
rent. To some extent it is a personal choice. Some families may prefer to pay a higher rent to live close to
a good school or to reduce transport costs, while others would choose to have more disposable income
after housing costs. However, particularly for lower income families, high rents are a problem because
they can make it difficult for families to meet other basic costs of living such as food, fuel and transport.
Looking across the three charts, as family income rises, the number of developments within the portfolio
in which the rent level is comfortable – below 35 per cent of net income – increases, from just under half
for the low income family to two thirds for the modest and middle income families. For the middle income
family on £27,594, only three out of 18 developments require the family to spend more than half of its
income on rent.
Within the portfolio, the developments where the rents are most challenging for low to middle income
families are based in London where high land prices and population growth keep rents high, even with the
benefit of the Section 106 discounts which two of the London developments enjoy. To get a better
perspective on the affordability of the London developments within the portfolio, we look at them again
in Figure 6 in the context of median income in London rather than nationally. Higher rents in London are
somewhat balanced out by higher wages and higher levels of Housing Benefit. In London, a couple with
one child at the median has a net income after taxes and benefits of £31,661 compared to £27,594
nationally. As Figure 6 shows, in a London context, two of the developments continue to challenge a
median income family, with one remaining out of reach without significant sacrifices elsewhere.
Resolution Foundation Page 17Figure 6: Affordability for a family at the median of the income distribution (London)
From the analysis above, we can conclude that the rent levels within the portfolio are largely comfortable
for a middle income family and while a stretch in some cases, are not entirely out of reach for a modest
income family at the 35th percentile. However, the analysis also highlights the fact that market rents will
be challenging for low income families. On a low income, spending more than half of that income on rent
leaves families struggling to keep up with other costs. While we have looked at a couple with one child
living in a two bedroom property, the same pattern of affordability holds true for other family types
requiring different sized properties, for example a larger families living in a three bedroom property or a
couple without children living in a one bedroom property.
We will look at improving affordability in Section 4 but it is unlikely that build to rent as a market product
delivered without government guarantee or some other form of subsidy can meet the needs of low
income families.
Tenancy length
As the private rented sector becomes a long-term tenure rather than an interim solution before buying a
house, tenancy security has become ever more important. While the flexibility of the private rented
sector suits some, a third of households renting privately are families with children who require stability
and security of tenure.12 Despite the fact that longer tenancies can be offered within the current legal
framework of Assured Shorthold Tenancies (ASTs), buy to let mortgage lenders have traditionally been
reluctant for landlords to offer more than a six to 12 month tenancy. The sense of insecurity this causes
tenants is compounded by a lack of visibility on rent increases, with private landlords tending to adjust
rents on a sporadic and “lumpy” basis.
In markets such as Germany, Switzerland and France where the private rented sector makes up a higher
proportion of the housing stock than in the UK, security of tenure and rent transparency are far greater.
Contract length is indefinite in both Germany and Switzerland and between one to three years in France.
In all of these countries, tenants can be evicted for non-payment of rent, criminal damage or if the
landlord wants the property for personal use, but otherwise the tenancy is secure with visibility on rents
that are linked to inflation or kept in line with market rates. Renter flexibility is also protected under these
12
De Santos, R. (2012) A Better Deal: Towards more stable private renting, London: Shelter
Resolution Foundation Page 18regimes, with tenants able to end contracts with average notice periods of between one and three
months.13
The portfolio presented in this paper assumes that units will be offered on the basis of longer tenancies of
three to five years in line with the latest market developments. Longer tenancies would continue to be
achieved through an AST, but utilising a longer fixed term than the standard six or twelve months. Tenants
would continue to have the ability to break the contract by giving three months’ notice, subject to a
minimum letting period of six months. Dolphin Square Foundation and Genesis Housing Association are
offering three and five year tenancies respectively to private tenants in London and the Nationwide
Building Society announced in June of this year that it would support buy to let landlords to offer longer
tenancies.14
Annual rent increases will track CPI and are assumed to be on average 2.5 per cent annually. Keeping
rents in line with CPI gives tenants greater visibility over future rent increases than in the current market.
Tenants are able to budget based on predictable annual increases and investors can expect a predictable
inflation linked cash flow. Assuming rents rise in line with CPI can also protect affordability for tenants as
long as wage adjustments do not lag CPI as is currently the case.15
Having outlined the portfolio, its development costs and associated rental income, the next section
addresses investor returns. It first looks at the expected income yield based on the overall rent from the
portfolio and the costs that have been assumed for management, voids and bad debts. It then goes on to
look at the combined income and capital return based on inflation, tax and gearing assumptions and
discusses how these compare with investor expectations.
13
Scanlon, K. and Kochan, B. eds. (2011) Towards a sustainable private rented sector. The lessons from other countries, London:
LSE.
14
Nationwide gives landlords the option to offer longer term tenancies
http://www.nationwide.co.uk/mediacentre/pressreleases/viewarticle.htm?id=2194
15
Whittaker, M. and Hurrell, A. (2013) Low Pay Britain 2013, London: The Resolution Foundation
Resolution Foundation Page 19Section 2: Investor returns
If build to rent is to work for institutional investors it will need to do so by providing a robust, stable
income flow rather than solely relying on short term capital appreciation. However, investors will judge
the investment proposition offered by build to rent on the basis of both types of return: the income
return which is the rent from the portfolio expressed as a percentage of the development cost; and the
combined total investor return from income and the year on year increase in the underlying capital value
of the portfolio expressed as an internal rate of return (IRR). Each type of return will be considered in turn,
but we would emphasise the importance of the income return for two reasons. First, this is a long term
rental portfolio, and is not based on the intention to sell the assets and realise the capital value. Second,
we have significantly greater visibility in forecasting a steady state income return than in speculating on
future short-term asset price inflation.
The steady state income return from the national portfolio
The national portfolio described in Section 1 is comprised of real development sites using known or highly
certain development costs. The following section details the annual yield that this portfolio could be
expected to deliver based on similarly grounded rent and cost assumptions provided by each housing
provider.
There are a range of yields that property investors typically consider in assessing the relative
attractiveness of a proposition. For the purposes of this report we concentrate on three, and for
consistency define them as follows:
Gross Yield - total rental income achievable, assuming 100 per cent occupancy relative to total cost of
development
Net Yield - gross yield less costs of managing property including management, maintenance, letting, and
operating costs, relative to the total cost of development
Net Operating Income - Net Yield less the reduction in rent received due to some units being void of
occupants for any period due to refurbishment or delays in letting (100 per cent -actual occupancy rate =
void) and lost rent due to bad debts.
While a higher gross yield is universally positive in terms of maximising returns, variations in costs,
occupancy and bad debts, mean that it is not necessarily the case that a development with a higher gross
yield will have a higher net operating income.
Overall, the portfolio could be expected to deliver a final net operating income of 3.9 per cent at steady
state relative to the total cost of development based on a 30 per cent gross to net reduction to account
for the costs of management, maintenance, lettings, voids and bad debts (see Table 3). With one of the
objectives for the housing providers being the ability to recycle capital, this return is an initial starting
point for determining whether the financial returns are sufficient to attract institutional investment, a
topic dealt with in more detail in the second half of this section. How the 3.9 per cent income return is
arrived at is discussed below. Table 3 provides a summary of the steady state yield that the national
portfolio delivers.
Resolution Foundation Page 20Table 3: Steady State Yield Summary: The National Portfolio
Aggregate Per Unit Per Per Unit Per
per annum (£) % of Gross Rent Annum (£) Week (£)
Total Gross Rent £7,805,269 100.0% 10,032 193
Gross Yield 5.6%
Management Costs:
Responsive Maintenance (£403,671) 5.2% 519 10
Planned Maintenance (£583,707) 7.5% 750 14
Regulatory & Other (£147,440) 1.9% 190 4
Relet Costs (£37,215) 0.5% 48 1
Lettings Costs (£176,253) 2.3% 227 4
Organisational Overheads (£597,073) 7.6% 767 15
Total (£1,945,360) 24.9% 2,500 48
Net Rent £5,859,909 75.1% 7,532 145
-
Net Yield 4.2%
Voids (£283,623) 3.6% 365 7
Bad Debt (£126,982) 1.6% 163 3
Net Operating Income (NOI) £5,449,304 69.8% 7,004 135
NOI Yield 3.9%
Notes:
1) Total development costs have been used as a proxy for value in calculating yields
Total Gross Rent: £7.8m
The total gross rent of the combined portfolio of 778 units across 16 developments is £7.8m. This figure
assumes all units are occupied fully (100 per cent occupancy). Housing partners have provided for each
development estimates of rent levels for each property type, allowing for the number of bedrooms and
whether the property is a house or flat. These rent estimates have been made with reference to local
market conditions, and benchmarked against market rental levels for similar properties in the appropriate
local area. No adjustments have been made to these rent levels in light of the improved offer to tenants
described in Section 1 (better security and higher quality management). This gross rent level delivers a
gross yield of 5.6 per cent relative to the total cost of development of £140m.
Management Costs: £1.9m (24.9 per cent of gross rent)
Management costs comprise a range of costs including:
Responsive maintenance - dealing with day to day repair jobs as they arise
Planned maintenance - costs required to continually maintain property, for example replacing windows or
kitchens, against an agreed replacement cycle
Regulatory costs - these include a range of items such as annual testing of smoke alarms, gas and
electrical appliances
Relet costs –costs that tenants are typically responsible for but that have to be covered by landlords
during void periods, for example council tax
Resolution Foundation Page 21Letting costs –costs associated with marketing and letting properties
Organisational overheads - central costs for co-ordinating and managing the above activities.
The above figures are inclusive of relevant VAT at 20 per cent.
We have assumed that each housing provider will continue to manage the specific units it develops and
will sign a separate Operations and Maintenance contract with the investor or investment fund. The
housing partners have provided the management costs shown in Table 3 on the basis of actual spending,
using unit costs from their existing, in many cases extensive, repairs, maintenance and lettings businesses.
It is worth noting that these costs have also been provided on the basis that these would be levels at
which housing partners would be willing to contract externally with the investment vehicle.
This portfolio modestly outperforms the industry benchmark as measured by IPD, with a weighted
average management cost of 24.9 per cent compared to the 27 per cent to 33 per cent identified by IPD
dependent on the region.16 This outperformance is driven by three factors: 1) the portfolio is entirely new
build which requires less intensive management and capital investment, particularly in the early years; 2)
the national portfolio is made up of developments which are concentrated in single locations which allows
for more efficient management; and 3) housing providers have focused their private rented developments
in areas where they already have existing management infrastructure through their social housing
activities and are therefore able to exploit economies of scale. A fuller discussion of the challenges of
estimating management costs for the build to rent market is provided in the project's interim report: The
challenges of build to rent for UK housing providers.
Net rent of £5.9million equals total gross rent of £7.8million less the £1.9million of management costs.
This delivers a net yield of 4.2 per cent.
Voids: £0.3m
Voids represent the costs of a property not being occupied. Voids do not represent a cash cost, rather
they represents the lost rent due to a unit not being occupied for a specific period of time. In turn this
reflects two features: 1) the time between tenancies for which a property is empty; and 2) the length of
time a tenant remains in the property. Voids to a certain extent are unavoidable, and in some cases are
desirable as they allow a landlord access to a property to undertake necessary maintenance work. At the
same time, voids can vary significantly between landlords, and good management would look to minimise
voids as much as possible.
The void percentage of 3.7 per cent is based on an average time between tenancies of 21 days, and an
average tenancy length of 19 months. Data from the Association of Residential Lettings Agents suggests
that the average length of stay at the same property for a tenant in the private rented sector is around 19
months (1.6 years), and has been steadily rising over the past seven years. While this is significantly
shorter than that for a tenant in social housing (8 years) or for an owner-occupier (13 years)17 it is also
significantly longer than the average fixed term of an AST contract of between six and 12 months.
A central assumption of the national portfolio as discussed previously is that to help improve security for
tenants, units would be offered on the basis of longer tenancies. However, the evidence on whether a
longer tenancy results in individuals and families staying for longer than average is still very limited, hence
the use of an average tenancy length of 19 months to estimate void costs.
16
IPD UK Residential Investment Index
17
Source: DCLG: English Private Landlords Survey 2010
Resolution Foundation Page 22Bad debts: £0.1m
Bad debts represent an additional cost of £0.1m, equivalent to 1.6 per cent of gross rent. This equates to
the level of rent that should be paid, but is not received due to non-collection or arrears. Housing partners
have provided their best estimates for this figure based on existing PRS schemes, or by using as a starting
point data from their social housing portfolios.
Net Operating Income: £5.4m
Net rent of £5.9 million less voids and bad debts gives a net operating income for the portfolio of £5.4m,
equivalent to a yield of 3.9 per cent relative to the total cost of development. The total reduction from
gross rent equals £2.4m, constituting a gross to net reduction of 30 per cent.
The income return of 3.9 per cent provides a starting point for assessing the portfolio as an investment
proposition. We now go on to look at the total return from the portfolio and assess the extent to which
these returns meet investor expectations.
Total returns from the portfolio
As we discussed in the previous section, if build to rent is to work for institutional investors, it will need to
do so on the basis of a stable income return that also provides an important hedge against inflation.
However, certain types of investors will also judge the asset on the basis of capital growth, however
uncertain, and for that reason, we present the total return picture here.
The total return to an investor over time includes both the annual net operating income yield and also the
change in the underlying value of the properties. The previous section highlighted that the national
portfolio would offer an initial net operating income of £5.4m, 3.9 per cent of the total cost of
development.
Our baseline assumption is that rent will move in line with CPI and that management costs will do the
same. Using a CPI inflation forecast of 2.5 per cent, both nominal rental and cost inflation would therefore
be 2.5 per cent. We make the same assumption for capital appreciation assuming the value of properties
increases in line with CPI over the medium term. In effect, the base assumption is that there is no real
increase in rents, costs or capital values.
The national portfolio offers investors an annual return of around 6.5 per cent allowing for both income
and capital appreciation in line with CPI at 2.5 per cent over the medium term.18 One way to improve the
return would be to focus on areas where expected capital and rental inflation is higher. Table 4 presents a
sensitivity analysis of the impact of inflation on both rent and capital value. A one percentage point
increase in both rental inflation and capital appreciation increases the total investor return (IRR) from 6.5
per cent to 7.6 per cent.
18
For the purposes of analysis a 10 year investment horizon has been modelled, and used throughout this report for consistency.
As noted below, a fixed investment term does not appear to be an initial investor priority. It should also be noted that the impact
of a long investment period are minimal relative to the return figures presented.
Resolution Foundation Page 23Table 4: Sensitivity of total investor returns to rental inflation and capital appreciation
Rental Growth (p.a.)
6.5% 1.0% 2.0% 2.5% 3.0% 3.5% 4.0% 4.5% 5.0%
1.0% 4.8% 5.1% 5.2% 5.4% 5.5% 5.7% 5.8% 6.0%
Capital Appreciation
2.0% 5.6% 5.9% 6.0% 6.2% 6.3% 6.5% 6.6% 6.8%
2.5% 6.1% 6.3% 6.5% 6.6% 6.7% 6.9% 7.0% 7.2%
(p.a.)
3.0% 6.5% 6.8% 6.9% 7.0% 7.2% 7.3% 7.4% 7.6%
3.5% 6.9% 7.2% 7.3% 7.4% 7.6% 7.7% 7.9% 8.0%
4.0% 7.4% 7.6% 7.7% 7.9% 8.0% 8.1% 8.3% 8.4%
4.5% 7.8% 8.1% 8.2% 8.3% 8.4% 8.6% 8.7% 8.8%
Note:
Returns calculated over 10 Yr Investment Length, no debt, returns pre-income or profit tax, cost inflation assumed at 2.5% p.a.
How do our base case returns compare to investor expectations?
Setting out return expectations is complex, not least because the term "investors" covers an enormous
range of money managers with vastly differing investment mandates. A sovereign wealth fund will have
very different requirements to that of a hedge fund or indeed a traditional mutual fund manager. Even
within comparable groups, for example pension funds, investment requirements can differ substantially
depending on the wider requirements of the funds under management. There is also a subtle, but
important difference between return aspirations and realistic return expectations.19
What is clear however is that the impact of historically low interest rates and quantitative easing have
driven bond yields to record lows, and this is encouraging asset managers to search for alternative sources
of income. Build to rent as an asset class is of particular interest because it offers a potentially low
correlation to other asset classes, generating opportunities for diversification. Furthermore, it also offers
some form of long-term linkage to or protection from inflation, even if not contractual, something which
is of significance to those working to meet future inflation-linked defined benefit obligations.
A broad range of investors provided extensive contributions in identifying the critical requirements that a
national portfolio of build to rent would need to achieve. These conversations highlighted that on an
unlevered basis, the national portfolio would need to deliver a running yield of at least 4 per cent and a
total return (IRR) in the indicative range of 6 to 10 per cent. While this suggests the national portfolio is
viable, the returns sit at the low end of the indicative range and at this level, attracting external
institutional investment is in no way guaranteed. As we have discussed, one way to improve the return
would be to focus on areas where expected capital and rental inflation is higher. However if the aim of
developing build to rent is to increase supply and so reduce the squeeze on household finances that we
have witnessed over the past decade, then it would be inconsistent to rely on higher rates of rent inflation
or capital appreciation to underpin the viability of market rent as an investment proposition. An initial
assumption of 2.5 per cent is one that balances the desire to offer an affordable tenure for renters with
viable returns for investors. There also seems to be no clear justification for forecasting a long term
divergence in cost and income trends. Based on investor feedback this seems an appropriately
conservative set of initial assumptions over the medium terms. A more detailed discussion of ways to
enhance returns is undertaken in the next section.
Discussions with investors also highlighted a number of important majority consensus views which have
potentially wider relevance for those looking to attract institutional investment into build to rent and have
shaped the baseline assumptions we have made. These are detailed below.
19 th
Authers, J. (2013) Markets: The investors dilemma, Financial Times, 10 July.
Resolution Foundation Page 24Higher perceived risk requires higher expected return
Generally, an investor willing to take on more risk will require a higher expected return. There are a
significant number of risks in developing and running a national portfolio of market rent accommodation.
Investors expressed a preference to invest post stabilisation of the portfolio. Stablisation is defined as the
point after the development has been completed, once occupancy rates have reached a pre-defined level,
say 95 per cent occupancy. Housing partners were viewed as better placed to manage risks in developing
and stabilising a portfolio given their development experience and local market knowledge but were not
expected to provide a guarantee for on-going voids, bad debts and rent levels.
Forward funding commitments were frequently identified as a means to help manage the exit risk for
housing providers. These ensure funding is available once the development is stabilised and delivering an
agreed initial return. Without such forward funding commitments, the housing providers would likely
require a higher developer margin than the 5 per cent used in this model. Table 5 below shows the
sensitivity of the returns to different levels of developer margin. A commercial margin of 20 per cent in
contrast to the 5 per cent assumed here would bring the NOI yield down from 3.9 per cent to 3.4 per cent
and take 0.5 per cent off the total return (IRR).
Table 5: Sensitivity of returns to developer margin
Developer Margin
0% 5% 10% 15% 20% 25%
NOI Yield 3.9% 4.1% 3.9% 3.7% 3.6% 3.4% 3.3%
Total Investor Return 6.5% 6.7% 6.5% 6.3% 6.1% 6.0% 5.8%
Note: Returns calculated over 10 Yr Investment Length, no debt, returns pre-income or profit tax, rental, capital and cost inflation assumed at 2.5% p.a.
Scale is important
Scale has been widely identified as one of the key barriers to institutional investment in build to rent.
Scale matters both from an operational and financial perspective. Larger portfolios of units can be
managed more efficiently, but also allow the costs of due diligence and on-going monitoring to be spread
across a larger investment. A minimum investment size of £70 to £100 million was commonly identified as
desirable.
Capital structure – unlevered in base case
Investor return requirements were typically described on an unlevered basis, with many investors
highlighting that leverage is a secondary consideration that could be introduced if required at a later stage.
We discuss the model’s sensitivity to leverage in Section 4.
No requirement for pre-determined investment term length
Investors signalled that there was no need to have a pre-determined investment term length. Institutional
investors have the potential to realise capital gains at different points in time through the sale of a share
of the investment vehicle, use of debt refinancing or through underlying asset sales. Investment horizons
of investors as noted before can also differ significantly. Consequently a defined investment length was
not viewed as critical, although there was general consensus that investment would be viewed over a
medium term (5+ year) horizon.
Resolution Foundation Page 25Alignment of incentives between parties is important
Building and managing a national portfolio of market rent accommodation involves a wide range of
potential parties whose priorities are not necessarily aligned. Aligning incentives is important in that it
helps both reduces risks, but also maximise returns. In this context, investors generally expressed a
preference for the housing providers to retain a minority equity stake of around 10 per cent in the final
investment vehicle. This would help align the interests of the providers as housing managers with those of
investors independent of any O&M contract and allow providers to share in the long term success of the
project. It would encourage those engaged in development to optimise life cycle cost considerations
during the initial design and build phase and would also help ensure that the development fits with the
longer term needs of the local population and wider regional housing strategy.
The investment vehicle should be tax transparent
The choice of investment vehicle will be ultimately defined by the investor depending on a range of issues
including: investor status (retail or institutional); liquidity requirements; tax status; investment time
horizon; scale of investment; gearing level; whether the investor intends to acquire the portfolio in its
entirety or to invest in a fund or joint venture.
Almost regardless of the answers to the above, what matters is that the vehicle is tax transparent i.e. that
tax is levied on the underlying investor rather than on the vehicle itself. This ensures that investors with
different fiscal status can invest in a common vehicle without compromising one another, and avoids any
double taxation of income. There are a number of potential investment vehicles available to achieve this,
including Real Estate Investment Trusts (REITS), Property Authorised Investment Funds (PAIF), Jersey
Property Trusts (JPUT) or English Limited Partnerships (ELP). Each has its own advantages and limitations
and discussions with legal advisers highlighted that the national portfolio could potentially fit into any of
them if desired.
This section has demonstrated that the national build to rent portfolio we have put together can meet
investor return expectations at the lower end but that the ability to secure institutional investment would
not be guaranteed. Therefore, in the next section we look at strategies for improving investor returns to
create a more compelling build to rent proposition.
Resolution Foundation Page 26You can also read