FORECASTING SYSTEM AT IKEA JÖNKÖPING - DIVA PORTAL
←
→
Page content transcription
If your browser does not render page correctly, please read the page content below
JÖNKÖPING INTERNATIONAL BUSINESS SCHOOL
JÖNKÖPING UNIVERSITY

           Forecasting System at
              IKEA Jönköping

                       Master thesis within International Logistics and Supply
                       Chain Management

                       Author:                   Mahir Dugic
                                                 Daniel Zaulich

                       Tutor:                    Susanne Hertz
                                                 Hamid Jafari

                       Jönköping                  May 2011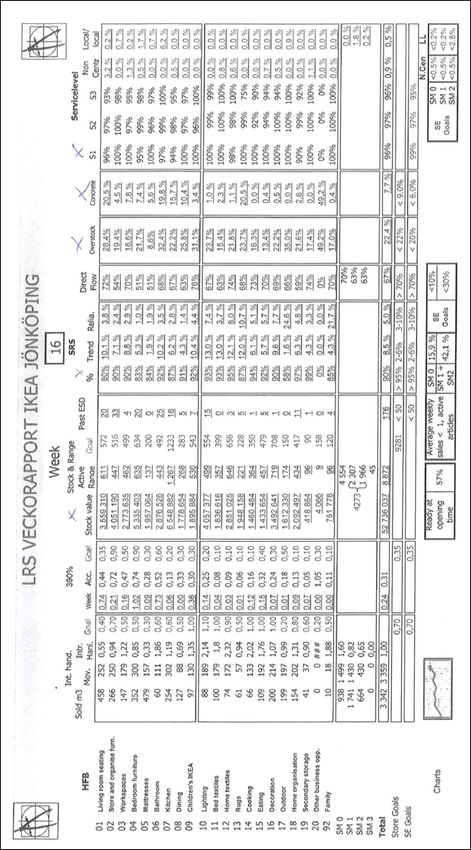
Master´s Thesis in Business Administration
Title:       Forecasting system at IKEA Jönköping
Author:      Mahir Dugic, Daniel Zaulich
Tutor:       Professor Susanne Hertz
Date:        May 2011
Key words: Demand, forecasting, forecasting system, key performance indicators,
           retailing, supply chain management

Abstract
This thesis has been performed at IKEA Jönköping. The purpose was to identify what
kind of forecasting system IKEA Jönköping is using and analyze its problems. The
data collection was based on interviews with a total of 6 people working at IKEA
Jönköping, IKEA of Sweden (IOS) in Älmhult and observation at the Sales Supply
Support division (SSS).

From the empirical study several problems were identified linked with the
performance of the forecasting. Problems with understanding the initial forecast from
IOS were identified and this was because of lack of information about demand. SSS
also wanted to know their local market in a better way this to be able to make more
accurate forecast. Finally all the departments at IKEA Jönköping which were working
with forecasting wanted a closer collaboration between SSS, sales and the logistics
department also wanted to have better information exchange.

The result from this thesis explain what kind of forecasting system IKEA Jönköping is
using and gives suggestions to solve the problems mentioned above. We have
highlighted the importance of having a closer collaboration between IOS and IKEA
Jönköping and between the different departments working with forecasting.
Furthermore we have explained the importance of creating guidelines and routines
regarding the forecasts and the flow of information.

By considering our solutions presented in this thesis we think that the problems
addressed above could be managed and hopefully lead towards a better forecasting
performance at IKEA Jönköping.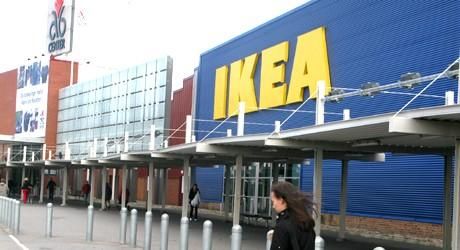
Contents
1       Introduction ............................................................................... 1
    1.1     BACKGROUND .......................................................................................................... 1
    1.2     PROBLEM DEFINITION .............................................................................................. 2
    1.3     PURPOSE ................................................................................................................... 2
    1.4     RESEARCH QUESTIONS .............................................................................................. 2
    1.5     DELIMITATIONS........................................................................................................ 3
    1.6     OUTLINE OF THE THESIS ........................................................................................... 3

2       Frames of Reference ................................................................... 4
    2.1 SUPPLY CHAIN MANAGEMENT IN RETAILING ...................................................................... 4
       2.1.1 Retailing ............................................................................................................................ 5
       2.1.2 Stockout ............................................................................................................................. 6
       2.1.3 Demand management ......................................................................................................... 6
       2.1.4 Inventory management ........................................................................................................ 8
       2.1.5 Warehousing cost ................................................................................................................ 8
       2.1.6 Classification of customers and products .............................................................................. 8
    2.2 POSTPONEMENT AND SPECULATION.................................................................................... 9
    2.3 FORECASTING ........................................................................................................................ 10
       2.3.1 Data collection for forecasting ............................................................................................ 11
       2.3.2 Working with forecasts ..................................................................................................... 12
       2.3.3 Forecasting techniques ....................................................................................................... 14
    2.4 CHOOSING FORECASTING METHOD.................................................................................... 15
    2.5 PERFORMANCE MEASUREMENT AND KEY PERFORMANCE INDICATORS ........................ 16
       2.5.1 Forecasting performance and accuracy ................................................................................ 17
    2.6 SUMMARY OF THE FRAME OF REFERENCE .......................................................................... 18

3       Methodology ............................................................................ 20
    3.1 CHOICE OF METHOD ............................................................................................... 20
    3.2 CASE STUDY ............................................................................................................ 20
    3.3 DATA COLLECTION ................................................................................................. 20
       3.3.1 Primary and secondary data ................................................................................. 21
       3.3.2 Observations ..................................................................................................... 21
       3.3.3 Interview........................................................................................................... 22
    3.4 DATA ANALYSIS ...................................................................................................... 22
    3.5 THE INTERVIEW AND OBSERVATION PROCESS ......................................................... 22
    3.6 RELIABILITY AND VALIDITY .................................................................................... 23

4       Empirical study ........................................................................ 25
    4.1 HISTORY & FACTS ................................................................................................................. 25
       4.1.1 Home furniture market in Sweden .................................................................................... 25
       4.1.2 IKEA in southern Sweden ............................................................................................... 25
    4.2 IKEA JÖNKÖPING ................................................................................................................ 26
    4.3 IKEA OF SWEDEN ................................................................................................................ 27
       4.3.1 Working with forecasts ..................................................................................................... 28
       4.3.2 Initial forecast for new products ......................................................................................... 28
       4.3.3 Key performance indicators ................................................................................................ 29
    4.4 FORECASTING SYSTEMS AT IKEA JÖNKÖPING ................................................................. 29
       4.4.1 Maintaining Stock levels .................................................................................................. 30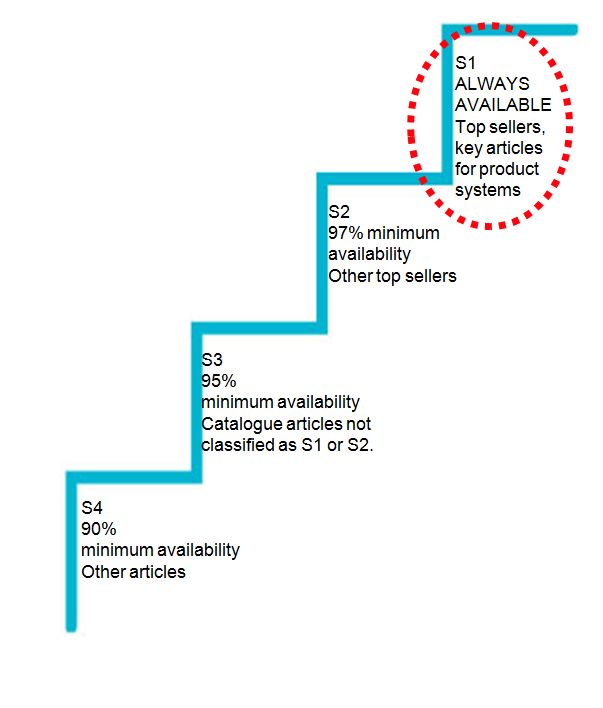
4.4.2 Initial forecast for new products ......................................................................................... 31
       4.4.3 Working with SRS .......................................................................................................... 31
    4.5 PERFORMANCE MEASUREMENTS ......................................................................................... 32
    4.6 PROBLEMS ............................................................................................................................... 32

5       Analysis .................................................................................... 34
    5.1 WHAT KIND OF FORECASTING SYSTEM IS IKEA JÖNKÖPING USING TODAY? ............. 34
    5.2 WHAT ARE THE PROBLEMS WITH THE CURRENT FORECASTING? .................................... 34
       5.2.1 Sale Supply Support and IKEA of Sweden ...................................................................... 35
       5.2.2 Sale Supply Support and the local market......................................................................... 35
       5.2.3 Sale Supply Support and the department of sales and logistics ............................................ 36
    5.3 WHAT KIND OF SOLUTIONS COULD BE INDICATED TO IMPROVE THE FORECASTING
    SYSTEM? ............................................................................................................................................ 37
       5.3.1 Sale Supply Support and IKEA of Sweden ...................................................................... 37
       5.3.2 Sale Supply Support and the local market......................................................................... 38
       5.3.3 Sale Supply Support and the department of sales and logistics ............................................ 38
    5.4 PERFORMANCE ANALYSIS AT IKEA JÖNKÖPING ............................................................. 39
       5.4.1 Service levels ..................................................................................................................... 40

6       Discussion ................................................................................ 41
    6.1 FUTURE RESEARCH AREAS .................................................................................................... 42

7       Conclusion ............................................................................... 43
8       References ................................................................................ 44

Appendices
        APPENDIX 1 INTERVIEW QUESTIONS

        APPENDIX 2 IKEA JÖNKÖPING KPI
Figures FIGURE 1.TCI SERVICE TO THE RETAILING SECTOR (AGARWAL, 2007) 4 FIGURE 2. MAP OF IKEA STORES IN SWEDEN (INTER IKEA SYSTEMS, B.V, 2011) 26 FIGURE 3. IKEA JÖNKÖPING AND A6 CENTER 27 FIGURE 4. GLOBAL FORECASTS AT IKEA 28 FIGURE 5. FORECAST ACCURACY AT IKEA 29 FIGURE 6. SERVICE LEVELS AT IKEA 30 FIGURE 7. IKEA JÖNKÖPING AVERAGE KPI 40 Tables TABLE 1. EVALUATION OF DIFFERENT FORECASTING METHODS (OLHAGER, 2000). 16
1      Introduction
This chapter has the aim of explaining general information that leads to the purpose
of the thesis. First presented in this chapter is the background, problem definition and
the purpose of the thesis. Finally delimitations and outlines of the thesis are stated.

1.1 Background
The retailers role of the supply chain is to connect the customer with the manufacturer
in order to create value to products and services by providing an assortment, breaking
bulk, holding inventory and providing services. Furthermore retailers have created an
increasing role of the supply chain management activities (Levy & Weitz, 2009).

Van Hoek, Commandeur, & Vos (1998, p.33) explain that “Demand is becoming
increasingly variable and uncertain in time and place … there are still differences in
local culture, demand and taste”. Today´s market is in general more obvious and less
disordered; this is because of steady removal of barriers which affects the trade and
investments by actors in foreign countries (ibid). To meet the customer requirements
the products need to have a special character of qualities and that these qualities need
to fit in relation to its future area of use, furthermore these qualities must be available
at the time when the customer needs it (Alderson, 1950).

Supply chain management is a concept that has been developed to meet the customers
demand. Harland (1996) describes the supply chain as the distribution of physical
goods and information between nodes in the chain. To manage all the business
activities in the supply chain the term supply chain management is widely used.
Douglas et al (1996, p.1) define the activities as “Supply chain management is the
management of material and information flows both in and between facilities, such as
vendors, manufacturing and assembly plants and distribution centers” An important
part within the supply chain process is demand management and Lambert & Cooper
(2000, p.73) define the process as “managing demand involves attempting to
determine what and when customers will purchase”. Furthermore Langley et al
(2009) explain that demand management is a focus effort to approximate and handle
customers demand and using the information to make organizational decisions.

Supply chain activities such as postponement and speculation strategies are different
methods to meet the customer requirements. When using the speculation concept a
company is performing the required activities at the earliest possible time in the
supply chain, this to gain benefits such economies of scale and reduce the risk of
stockouts. Within the speculation strategy a company is ordering larger quantities
instead of using minor and more regular orders, by doing so a company will also
lower its cost for transportation and cost related for sorting the goods (Bucklin, 1965).
Twede, Clarke, & Tait (2000, p. 106) describes that “Speculation is the basis for
traditional logistics model” and that this kind of strategy is based on using forecasting
methods.

Bureau of Justice Assistance (2011) explain forecasting as “Estimating the likelihood
of an event taking place in the future, based on available data from the past”.
According to Arnold, Chapman, & Clive (2007) there are several reasons to forecast
the future demand. One of them is that it helps the company to plan its production and
resources in a better way, to be more cost efficient and also to be able to offer right

                                             1
products at the right time when the customer wants it. Benefits from forecasting are
according to Bucklin (1965) lower production cost since no modification is needed
after customer order has been received and the possibility to offer higher customer
service since the products are already in stock, meaning to have the possibility to offer
shorter delivery time.
1.2 Problem definition
Retailers have the pressure from the market to meet the customer demand, if the
retailers do not meet this demand there is a large possibility that the customer would
not go back to the retailer. Retailers do not always know how much that should be put
in inventory to meet customer requirements (Levy & Weitz, 2008). Some of the
problems that can occur are that, the retailers are keeping low inventory levels and in
that way increase the risk for having a stockout. On the other hand having too high
inventory levels will increase the cost related for handling the inventory. Simchi-Levi
et al (2003) explain that by having inaccurate predictions about the demand it can
affect the overall performance of the supply chain, this in turn can result inefficient
use of resources and obsolete inventory.
To help the whole supply chain with predicting the correct demand there are several
different systems to work with forecasting. Arnold, Chapman, & Clive (2007)
mention that one of the principles about forecasting is that forecasts are usually
wrong. Retailers can minimize the errors of forecasting by working with the
appropriate forecasting systems for their market. This can help retailers supply and
storing the right goods to meet the requirements from their customers.
The problem about predicting a fully accurate demand is also something that IKEA is
facing. One of the challenges for IKEA which affects their forecasting system is to
have a better understanding about their customers and knowing their local market in a
better way. This makes it an interesting area to study and analyze what kind of
forecasting system IKEA Jönköping is using and what kind of problem it is facing.
1.3 Purpose
The purpose of this thesis is to identify the forecasting system which IKEA Jönköping
is using and analyze its problems.
1.4 Research questions
To be able to solve the purpose these different research question needs to be
answered.
1. Identify what kind of forecasting system is IKEA Jönköping using today?
2. What are the problems with the current forecasting?
3. What kind of solutions could be indicated to improve the forecasting system?
21.5 Delimitations
We have focused on IKEA Jönköping and the departments related with forecasting.
This study will not make a comparison towards other companies or other IKEA
stores; instead it is a single case. Furthermore we have not implemented anything; this
study will only indentify and give indicators for improvements.
1.6 Outline of the thesis
The thesis is divided into four parts, first the theory that is relevant to understand the
study. The second part presents the methodology used to conduct the study. The data
collected forms the basis of the third part with empirical study and analysis. In the last
part we discuss our findings, problems and indicators to solve the problems.
32 Frames of Reference
This chapter focuses on theories related to demand forecasting. The chapter starts
with supply chain management, continues with the strategies of postponement and
speculation in brief and finally presents forecasting techniques, methods and
performance measurements.
2.1 Supply chain management in retailing
Retailers have traditionally been small-sized and the large manufactures have
traditionally decided how the supply chain would be managed, but now retailers have
an increasing role in supply chain management activities. The size of the retailers has
made them more powerful than the manufactures (Levy & Weitz, 2008).
Christopher (2005, p.5) define supply chain management as "the management of
upstream and downstream relationships with suppliers and customers to deliver
superior customer value at less cost to the supply chain as a whole”.
The supply chain is a distribution of physical goods and information between nodes in
the chain. The work of managing the supply chain is about performance for customer
satisfaction as delivery reliability, cost, price and time (Harland, 1996).
Supply chain management is according to Levy & Weitz (2008, p.278) “a set of
approaches and techniques firms employ to efficiently and effectively integrate their
suppliers, manufactures, warehouses, stores and transportation intermediaries to
efficiently have the right quantities, at the right location, and at the right time”
Agarwal (2007) describes the supply chain, see figure 1, with suppliers and
manufacturers to the left, distribution centers and city hubs are in the middle and to
the right are the retailers that connects products and services to the customers. The
arrows in the figure symbolize the flow of products and services and could also be
information or finance.
Figure 1.TCI Service to the retailing sector (Agarwal, 2007)
4Harland (1996) mention that supply chain management are the supervision of a
network with connected businesses. Within this area the task are to provide services
and products to the end customers.
Furthermore the author explains that supply chain management is the internal supply
chain that integrates business functions involved in the flow of materials and
information. It is the management of a twofold relationship with suppliers and also
with suppliers‟ supplier.
2.1.1 Retailing
The final business in the supply chain is the retailer that connects the manufacturer to
the customers. The supply chain starts with the manufacturer that send the products to
the wholesaler that distribute the products to various retailers (Levy & Weitz, 2009).
Risch (1991, p.2) defines retailing as “the sale of small quantities of commodities to
the ultimate consumer”. Furthermore the author explain that the retailer has the
objective to split large quantities into more suitable quantities for the customers. The
author presents five goals for retailing; the first is to be able to forecast what the
customer wants, when and in which quantity. The retailer needs to be able to buy
merchandise in the best economical way as possible and know what to buy that will
generate in sales. To be able to sell the merchandise it is important to have useful
promotion and advertising strategies. The last goal for retailers is to build a permanent
clientele and image of goodwill (Risch, 1991).
Business activities that adds value to the products and services sold to consumers is
related with retailing. Retailing also includes sales of services and retailing does not
have to be conducted in stores, internet is an example where retailing can take place
(Levy & Weitz, 2009).
There are manufacturers that perform both production and retailing, they sell directly
to customers. A wholesaler buys goods from manufacturers in large quantity, store the
goods and resell the goods in smaller quantities. Supply chains that are vertical
integrated is according to Levy & Weitz (2008) an organization that performs more
than one set of activities in the supply chain, such as wholesaling and retailing.
According to Simchi-Levi, Kaminsky, & Simchi-Levi (2003, p.190) customer value is
“the way the customer perceives the entire company’s offerings, including products,
services, and other intangibles”. The customers‟ perception can be divided into
several parts. The first is conformance to requirements, meaning to have the right
products with the right requirements. Product selection is the variety of products, for
example colors and shapes. Price and brand is the acceptable price range for a product
or service, meaning that more luxury or well known brands can have higher prices
which are accepted by the customers. Value-added services are support and
maintenance that can be an important way to attract and satisfy the customers. The
final part is the relationships and experiences between the customer and the firm. By
creating good customer relationship the customer will return to the firm since it will
be time consuming for the customer to switch to another retailer (ibid).
5Retailers can increase value of products and services they sell to customers by provide
important functions. The value-creating function includes;
1. Providing an assortment of products and services
2. Breaking bulk
3. Holding inventory
4. Providing services (Levy & Weitz, 2009).
Providing assortment means that the retailer offers a wide selection of example
brands, design and seizes. This will make it more convenient for the customers to buy
many different types of products at one place. To reduce transportation cost
wholesalers and manufacturers send large quantities. This is not convenient for
customers so retailers use a process called breaking bulk and divides products to more
manageable quantities. Holding inventory is a value-creating function for customers
so they do not need to have large quantities of goods at home. Customers know that
the retailer have goods in inventory and available for sale. Providing services for
customers is for an example; store credit for those who want to pay later, display and
test products before buying and information about product in store or online (Levy &
Weitz, 2009).
2.1.2 Stockout
Retailers connect customers with suppliers and their product. The retailers have a
responsibility to know what the customers wants, needs and make it available when
they want it. To do this, retailers need to work with suppliers, distributors and
transportation firms, all members of the supply chain (Levy & Weitz, 2009).
When a customer wants a product that the retailer does not have available a stock out
occurs. There are a number of effects on the customer and retailer when a stock out
occurs. The customer visits the retailer and finds out that the product is out of stock.
The retailer could give a rain check that enables the customer to come back and pay
full price for the product when it is available again, but the first trip was unnecessary
for the customer. The customer might buy another product or model instead. There is
a possibility that the customer will go to another retailer nearby and buy the product
there. In the future the customer might become reluctant to the retailer and tell other
customers about the negative experience, all because of the stock out. Data shows that
experience of a stock out for the first time, customers buys a substitute product 70
percent of the time. The second time a stock out occurs for a customer the rate drops
to 50 percent, with the customer going to competitors half of the time. If the customer
experience a third stock out at the same retailer, the sale is lost entirely 70 percent of
the time and almost certainly, the customer‟s loyalty to the retailer (ibid). Christopher
(2005) points to a research that suggest that more than 66 percent of the customers
made the shopping decision at the point of purchase, this means that if the product is
not on the shelf the purchase will not occur. If stock outs continue to happens,
customers will drive away from the brand or the retailer permanently, the loss of
business for the whole supply chain is clearly significant (ibid).
2.1.3 Demand management
Demand management is a focus effort to approximate and handle customers demand
and using the information to make organizational decisions (Langley, Coyle, Gibson,
6Novack, & Bardi, 2009). Mentzer (2004, p.126) define the concept as “the creation
across the supply chain and its markets of a coordinated flow of demand”.
There are a number of ways that effective demand management will help
organizations satisfying and solving customer‟s problems. Organizations should
gather and analyze knowledge about customers‟ problems and needs. Identifying
partners to perform the functions needed in the demand chain and move these
functions to members in the supply chain so they can perform the most efficient and
effective. Organizations can share knowledge about consumers, technology, logistics
challenges and opportunities with other member in the supply chain to better solve
customers' problems. With these demand management the supply chain can develop
products and services that solves customers‟ problems and later on develop and
implement the best logistics, transportation and distribution methods to meet
consumers demand (Langley et al, 2009).
It is important that the marketing and the logistics functions shares information about
demand. If the marketing function implements a promotional plan and do not share
information about this to the logistics managers that schedules orders to the store, the
demand is increased but not the inventory levels. This will result in dissatisfied
customers and a failed promotional plan because there were not enough products to
sell. This is called “advertising for the competition” because of the stock out the
disappointed customers‟ buys products from competitors and creates demand there
instead (Mentzer, 2004). Furthermore the author explain that an important role of
demand management is to decrease demand, this is because of some products are less
profitable and demand management can make an assessment of the most profitable
products and emphasize demand on these while decreasing demand for the
unprofitable ones (Mentzer, 2004).
There are number of problems demand management has to handle within an
organization. First problem is the lack of synchronization between departments; this
make no or little coordinated response to information about demand. Second is that
too much emphasis is placed on forecasts of demand, with little or no thought on the
joint efforts and operational and strategic plans that are based on forecasts. Third
problem is that information of demand is used more for tactical and operational rather
than strategic purposes (Langley et al, 2009). Furthermore the author explain that the
supply-demand misalignment as an incident that occurs when there is little or no
collaboration between the manufacturer and the retailer when it comes to real demand.
When launching a new product demand is high and short afterwards the retailers have
a problem to meet the demand, there is a true shortage of the product. At this time
distributors, resellers and retailers tend to “over-order” to reduce the risk of stockouts,
this is creating a substantial “phantom” demand instead. When production starts to
increase and retailers begin to fill inventories a price competition starts, as do product
overages and returns. All this lowers the real demand and retailers become over-
supplied by the product. This is basically because of the supply chains planning
processes and the forecasting system that are made to use historical data of demand as
a measurement with no or little understanding of the changes in demand over time
(ibid).
72.1.4 Inventory management
There are two basic decisions for managing inventory; how much to reorder and
when. To determine a suitable solution for this, manager could use a few simple
calculations. Today these decisions are added with where and what inventory should
be held. Inventory decision has become more complex, this is because organizations
are working to manage inventories more effectively and lower cost. There are
different approaches for inventory demand and the most suitable approach depends in
what market the organization operates in. Basically, the more complex the situation is
for the organization, the inventory approach has to be more sophisticated (Langley et
al, 2009).
2.1.5 Warehousing cost
By holding inventory, different cost related for storing the goods will be obtained.
Some part of the cost is fixed, for example the rent of the warehouse meanwhile other
costs are variable such as the personnel cost, insurance cost and cost related for
handling the goods. The reason why some of the cost is variable is because the more
inventories a company is storing then more of the variable cost will be needed
(Mattsson & Jonsson, 2003).
Langley et al (2009, p.44) explain that “Carrying cost include interest expense (or the
opportunity cost associated with the investment in inventory), risk related cost
(obsolescence, depreciation), and service-related costs (insurances, taxes)”,
furthermore the authors explain that warehousing cost is the cost which all can be
connected with storing the goods. Christopher (2005) also agrees that the true cost of
inventory is connected to the cost of capital, storage and handling, obsolescence,
damages, shrinkage, insurance and management cost.
2.1.6 Classification of customers and products
To be able to offer the best possible customer service a company needs to decide
which products or customer it should put more effort on, this because if a company
wants to offer high customer service for all its customer and products a high total cost
will be achieved. There is a risk that products and customers which are important for
the company can obtain lower customer service meanwhile products and customer
that are not that valuable for the company can achieve high customer service. Other
effects that can be result from trying to deliver high customer service in all areas is the
opposite meaning low service performance (Jonsson & Mattsson, 2005).
By categorizing its customer and products, a company can identify which ones are
creating value and focusing on providing them higher customer service (Arnold,
Chapman, & Clive, 2007). Furthermore the authors explain that categorizing helps the
company to have better control of the customer and products that are important for the
company.
Olhager (2000) explain that the purpose of classification needs to be identified by the
company before the works is being implemented. The author explain that classifying
customer and products can have different objects and goals, such as to ease the
forecasting, keeping inventories at predetermined levels and to be able to make
analysis of the company‟s assortment.
Jonsson & Mattsson (2005) mentions that usually a small amount of a company‟s
products or customer is a major part of the company‟s total revenue ration. The
8authors explain that usually 20% of company‟s customer or products are covering
about 80% of the company‟s total revenue. By categorizing the products and
customer for example after their revenue ratio, a company can identify their most
profitable ones. Arnold, Chapman, & Clive (2007) explain that this method is called
ABC Analysis or even sometimes referred as to Pareto‟s law.
By using the ABC Analysis products are usually divided into three categories, A, B
and C, sometimes even more categories (Arnold, Chapman, & Clive, 2007). The focus
for the company lies on concentrating on products or customers in the A category
because this category is the one that generates most profit for the company (Flores &
Whybark, 1986)
2.2 Postponement and Speculation
There are different types of strategies to meet customer demand; one of them is to use
postponement strategy (Bucklin, 1965). In 1950 Alderson started the discussion about
the postponement concept and from observations it was noticed that products became
differentiated the closer it came to purchase point (Ernst & Kamrad, 2000).
According to Christopher (2005, p.134) “Postponement refers to the process by which
the commitment of a product to it’s finally form or location is delayed for as long as
possible”. Furthermore the author explain that there is always a risk that the customer
doesn‟t want the finalized product, therefore by using postponement the final
customization of the product is being delayed.
A simplified explanation of postponement could be that the activities in the supply
chain are being delayed until customers‟ orders are received. Postponement can be
used through the complete supply chain and also in different-sized production or
logistics operations (van Hoek, 2001).
Another strategy to meet customer demand is to use speculation strategy and Twede,
Clarke, & Tait (2000, p. 106) describes that “Speculation is the basis for traditional
logistics model” and that this kind of strategy is based on using forecasting methods.
When using the speculation concept a company is doing the required activities at the
earliest possible time in the supply chain, this to gain benefits such economies of scale
and reduce the risk of stockouts (Bucklin, 1965).
Waller, Dabholkar, & Gentry (2000) mention that by using speculation strategy a
company adds value to the order before it is received and Pagh & Cooper (1998)
explains that speculation is the opposite system towards postponement.
Speculation can be linked to the assembly process make-to-stock (MTS) since
Langley et al (2009, p. 553) explain that “MTS is the traditional production method
where end-item products are usually finished before receipt of customer order. By
using this process products are already finished and stored in the inventory and
refilled by forecasting the future demand. Furthermore the author explain that this
process is based on previous sales data and that it works well with products of high-
volume (ibid).
9A company can gain economies of scale by using speculation strategy because the
company is ordering larger quantities instead of using smaller and more frequent
orders. This will also lead to lower cost for transportation and sorting the goods.
Speculation strategy reduces also the risk of losing sales this due that the inventories
are being pushed forward within the supply chain at the earliest possible time
(Bucklin, 1965).
The benefits that can be obtained by using speculation are that the production cost
will be lower since there is no modification or customization on the products after
customer order has been received. Higher customer service will be obtained since the
company using speculation strategy can offer shorter lead times since the products
already are on stock. Lower distribution cost since larger quantities are being ordered
which can lower the handling and delivery cost (Bucklin, 1965) (Langley, Coyle,
Gibson, Novack, & Bardi, 2009) meanwhile one of the disadvantages of using
speculation strategy is according to Pagh & Cooper, (1998) an increased inventory
cost.
2.3 Forecasting
Jonsson & Mattsson (2005) mention that forecasting is being used for a company to
plan its resources and its capacity to be able to meet the customer demand in the best
possible way. Forecasting have also daily impacts on different levels within a
company, levels such as strategic, operational and tactical. The most important
demand is the primary demand. The primary demand is affecting the rest of the supply
chain since they are anticipating its production towards it (Langley, Coyle, Gibson,
Novack, & Bardi, 2009).
There are several reasons for forecasting and one of them is to meet the future
customer demand. Since some companies cannot wait until they receive orders from
their customers, they instead need to plan or predict what they need to produce.
Customers do not want to wait too long for their orders; therefore producers need to
plan their capacity and operations to satisfy their customers (Arnold, Chapman, &
Clive, 2007).
By having accurate forecasts retailers can create value towards its customers. Forecast
creates value by having, place, quantity and possession utility. Place utility is the role
for moving goods from the manufacturer to where the demand is, usually to a retailer
within the market area. Place utility leads to increased product availability and to
lower prices. Place utility moves goods to where demand is but time utility points to
when customers demands goods. Value is added by having goods and services
available at specific time when there is a demand. The importance of time utility has
increased considerably; today organizations are focusing on reducing lead time and
keep inventory levels to a minimum. Quantity utility is determined as the proper
amount of an item to where it is demanded. To create quantity utility organizations
use production forecasting, scheduling and inventory control. Possession utility is the
customers wanting goods or a service, basically this is demand (Langley et al, 2009)
By having inaccurate forecast it can have different effects on the company. By
forecasting too many products or to high volumes it can affect the different cost
aspects, such as; transshipment cost, inventory holding cost, and obsolescence cost.
From the other point of view by forecasting too little products, the result for the
10company can be lost sales, higher expediting costs and missed opportunity to sell
companion products (Handfield, 2006).
Arnold, Chapman, & Clive (2007) mention some principles about forecasting which
needs to be considered; by doing this a more effective forecast will be achieved.
Forecasts are usually wrong, it is impossible to look in the future and know the level
of demand for a product, therefore forecast will be wrong to some level. Every
forecast should include an estimate of error, as mentioned above, forecast will not
always be correct; a company needs to include an error margin to their forecasts.
Forecasts are more accurate for families or group, means that it is more difficult to
predict the demand for a single product then it is for a group of products. Forecasts are
more accurate for nearer time periods, this is because it is more difficult to plan the
long future demand then the near future (ibid).
Handfield (2006) mention also some laws that are similar to principles mentioned
above; Law 1 means that forecasts are intrinsically imperfect and it is important to
know that forecast can be incorrect and it could be risky to make large impact
decision based on it. Law 2 means that forecast which are based on short-range
periods are more accurate than the ones on longer periods. This since it could be
difficult to predict the demand for one product for the next year meanwhile it is easier
to calculate the demand for the next week. Law 3 describes that forecast are more
precise and accurate when forecasting for a larger group of product instead of making
forecast for every single product.
2.3.1 Data collection for forecasting
The data input for forecast is an important area; therefore there are some practices
which need to be remembered when predicting the demand.
Establish an owner for the forecasting process; meaning that there should be a person
who is responsible for handling the inputs for the forecast. Document the forecasting
process; it is important to document what kind of inputs has been used for the
forecast, the assumptions and how the forecast was calculated. This is vital from
several points of view; the employees can always go back and see how the forecast
was handled and use the same method for future forecasts. It is also easier to improve
a forecast if it has been documented since it is easier to identify which areas that can
be improved. Analyze the variability of demand for your products and services;
meaning to analyze the factors which are affecting the variability within the demand.
Furthermore it is important to understand the assumptions which the forecast is based
on. Update the forecast weekly; the annual forecast shall be updated every week this
so that every parties that are being affected by the forecast, such as supplier and other
departments, should be updated about the current situation. Establish information
systems to support the forecasting process; it is important to have a system which
shares information that can affect and help the employees working with forecasting to
make even more accurate calculations (Handfield, 2006).
Arnold, Chapman, & Clive (2007) mention also some important principles regarding
the collection of data which the forecast is based on:
1. Record data in the same terms as needed for the forecast. By this principle it
is meant that only relevant information is needed to be gathered. An example
11is that its not necessary to gather information about number of shipments if the
forecast is regarding the production demand. The forecast should also be in
same time period as the production schedule. Another important aspect to
remember is that if a product have several different customization options,
these options should be included in the forecast
2. Record the circumstances relation to the data. The customer demand can by
affected by different types of actions, an example is that actions such as
promotions, weather changes, competitors actions.
3. Record the demand separately for different customer groups. This principle
explain the importance of forecasting the demand for every customer itself
instead of forecasting the overall demand, this because a producer uses
different types of distribution channels.
The first principle regarding forecasting and why they are usually wrong and also
deficient has according to Jonsson & Mattsson (2003) several reasons. One of them is
that the current forecasting method which a company is using is not efficient enough.
Forecasting can be done by either using computers who use automatic forecasting
methods or by using manual human methods. A way to create better forecasting is to
implement new routines for manual methods and get better reliable information for
the automatic methods and also to combine these two different methods.
2.3.2 Working with forecasts
When working with forecasting it is important to check that the data which is being
used as input is correct and valid. By comparing the new forecast with previous one
combined with researches to get conformity of the demand a more reliable forecast
will be achieved. When using the previous forecast history as an input to the new
one, the factors which were affecting the demand needs to be updated. For example,
the company needs to identify if threat from competitors and the overall health of the
economy is the same since the last forecast. This can all be done by making
researches on the internet or gathering information from managers within sales and
marketing department (Handfield, 2006).
Furthermore Chopra & Meindl (2007) mention some important factors which needs to
be remembered when working with forecast. Understand and identify customer
segments; it is important for a company to map its different customer segments. This
can be done by categorizing them after similarities, demand volumes, order frequency
etc, and further on a company can use different forecasting techniques for these
different customer groups. By indentifying the different customer groups which the
company serves a more precise forecasting can be obtained. Identify major factors
that influence the demand forecast; Simplified meaning that the company should
indentify the factors which are affecting the demand. An example could by if a
company is promoting a certain product and the demand is being higher this special
event should be noted and the company should also identify how the promotion has
affected the demand of the product.
12Kahn (1998) points out the importance for employees working with forecasting to
know the basics of business forecasting, this because they will appreciate the forecasts
in a better way. The users also need to understand how forecasts are prepared like
basic concepts and not necessarily need to know the algorithms. They also need to
know the factors that are affecting the forecasts and past patterns. To do this a cause
and effect model can be used to better understand the factors affecting the forecasts.
The users need to understand that forecast are based on a plan and are not the plan or
goal itself.
Furthermore Kahn (1998) explains six rules for users when reporting forecasts.
Forecasts have to be in as much detail as needed. Specify the assumptions that are
used in the forecast. Give response to deviations in forecasts. Sometimes forecast
need to be under different scenarios. Make sure forecasts are internally consistent,
users often have own suspicion about forecast and if one thing is wrong the whole
forecast will be considered wrong. Give forecasts along with actuals, users will then
see where they are and where they are going and also to standardize the forecast
format so the user can find what they are looking for.
2.3.2.1 Lumpy demand
One of the problems for some companies is that the demand for some of their
products has randomly variation in demand, which in turn can affect the forecasting
system if the system is based on seasonality and trends. An example of lumpy
demand is when rare large order occurs because of unusual or not foreseen reasons or
when seasonality has not been included in the forecast (Ballou, 2004).
There are some ways to be better prepared when predicting the demand which has
irregular demand. First of all it is important to analyze the reasons behind the
lumpiness. When this is done the forecast can be divided so that products whit lumpy
demand has their own forecasting method or technique meanwhile those product whit
a more regular demand has their own method (ibid).
Furthermore forecast methods which react slowly on changes in market could be more
suitable to use, such as exponential smoothing. Finally carrying extra inventory for
products with lumpy demand could be more cost efficient than focusing on correcting
the forecast accuracy (ibid).
2.3.2.2 Collaborative forecasting
Another method to handle irregular and lumpy demand is by making collaborative
forecasting. Ballou (2004, p.315) explain that “multiple parties have the likelihood of
producing more accurate forecast that a single party”. This method is being
performed by using information from other departments, organizations, suppliers
within the supply chain, with the common objective to reduce the risk of creating
inaccurate forecasts.
By collaborating with other actors within the supply chain and share information a
higher level of accurate forecasts can be achieved. Even though implementing
collaboration could be complex and time consuming, the level of benefits is higher
than the total cost invested (Chopra & Meindl, 2007).
Before the work with collaborative forecasting can start there are several different
areas which need to be handled. First of all the employees working with the
13forecasting needs together to identify what kind of information during the information
exchange process is necessary to have and create schedules regarding when the
meetings and information exchange should occur. Even though collaborative
forecasting can be difficult to implement because it requires coordination, sharing,
consideration, compromise and commitment, the result from implementing a
successful collaboration can result in a more accurate forecasting (Ballou, 2004).
2.3.3 Forecasting techniques
There are several different forecasting methods and techniques, but basically they can
be divided into three different categories: qualitative, extrinsic, and intrinsic (Arnold,
Chapman, & Clive, 2007).
Olhager (2000) have instead divided forecasting techniques into two categories,
qualitative and quantitative were the quantitative technique includes causal methods.
2.3.3.1 Qualitative techniques:
This kind of technique is basing the customer demand on judgment and perception
(Arnold, Chapman, & Clive, 2007). Olhager (2000) mention that this technique is a
subjective method and that the demand is based for example upon, experts opinion,
market research‟s and a method called Delphi. The Delphi-method means that a jury
of experts makes assumptions regarding the demand were the goal or objective is to
conclude a united decision. Qualitative techniques are mostly used for large product
categories for a longer time period (Arnold, Chapman, & Clive, 2007).
2.3.3.2 Extrinsic techniques:
“Examples of such data would be housing starts, birth rates, and disposable income”
(Arnold, Chapman, & Clive, 2007, p.223).When using this technique, the forecast is
based upon external events and information which regulates the demand for the actual
product (ibid).
Olhager (2000) has named this forecasting technique for causal method. The author
explain that a number of variables have the possibility to affect each other‟s
development. To clarify his statement he mention an example, meaning that if the
gasoline price is being raised, people will start to buy more fuel-efficient cars than
before.
Arnold, Chapman, & Clive (2007) mention extrinsic forecasting is mainly suitable for
forecasting a product group or product families instead of only forecasting single
products.
2.3.3.3 Intrinsic techniques:
This method uses historical data to predict its forecast (Arnold, Chapman, & Clive,
2007). Olhager (2000) who calls this method quantitative, explain that the method is
based on quantitative models. An example of quantitative technique is a method
called time-series components. By using this method companies are including
different components which effects then demand.
Average demand
Arnold, Chapman, & Clive (2007) mention a type of technique within this category,
average demand. Simply meaning that a company is calculating its monthly demand
14by dividing its previously year product sales with twelve. Even though it is a simple
method some rules need to be remembered, an example is if a product has a large
variation in its demand then using average demand it is not suitable.
Moving averages
This method is suitable to use when a company is expecting that the demand will
probably be the same during a longer time of period (Olhager, 2000).
For an example, by using the last three months average demand, a company can use
these numbers and calculate the next month demand. The principle is always to
exclude to first month demand and replace it with the demand for the latest month
when calculating for a new month (Arnold, Chapman, & Clive, 2007).
According to Olhager (2000) the disadvantage with this method is that it responds
slowly on the changes in the market. Another disadvantage is that a company needs a
lot of data for using this method, since perhaps a company want to calculate the
demand for the next couple of months.
Exponential smoothing
Olhager (2000) explain that exponential smoothing is an easy method to use and in
difference from moving averages it requires less data to forecast the demand. Within
this method a variable is being used, which is a value for the predicted demand for the
next period, together with latest demand and the previous forecast, all this is then used
to calculate the new demand.
Exponential smoothing is most suitable for forecasting demand within a short-range
and also the fact that it identifies trends easier then moving average, but the
disadvantage for this method is that it doesn‟t work well when the demand for a
product is low (Arnold, Chapman, & Clive, 2007).
Seasonal index
Since some products are more affected from seasonal demand, for example during
summer, winter and weekends, it is important to use a variable that helps the company
to forecast the demand in a better way (Arnold, Chapman, & Clive, 2007)
Arnold, Chapman & Clive (2007, p.229) mention that “A useful indication of the
degree of seasonal variation for a product is the seasonal index. This index is an
estimate of how much the demand during the season will be above or below the
average demand for the product”
2.4 Choosing forecasting method
Since there are several different forecasting methods, it is not always easy for a
company to choose the right one. Olhager (2000) has made a table, see table 1, where
he rates different forecasting methods on how well they works depending on the
forecast horizon. Based on their functionality he has rated them on a scale from 1-5,
where 1 is poor and 5 is excellent.
15Table 1. Evaluation of different forecasting methods (Olhager, 2000).
Forecast horizon
Possibility to
Short Medium Long identify market
changes
Moving 2-3 2 1 2
average
Exponential 2-4 2-3 1 2
smoothing
Seasonal 2-4 2-4 2 2-3
index
Olhager (2000) mention that one of the most important attributes when choosing a
forecasting method are reliability, time, cost and the ability to identify market
changes. The difference between quantitative and qualitative forecasting techniques is
the amount of time and resources needed to forecast the demand and according to
Olhager (2000) the qualitative one is the more demanding. The authors mention also
that there is a difference in reliability between different quantitative methods and also
that quantitative methods are based more on routines and standardize methods.
2.5 Performance measurement and key performance
indicators
To be able to improve parts of a company‟s functions, it is important to have some
kind of performance measurement. Slack & Lewis (2008, p.171) mention that
“Traditionally, performance measurement has been seen as a means of quantifying
the efficiency and effectiveness of action”.
According to Chan (2003) performance measurement can be used to analyze the
feedback of activities and how well they are performing towards the predetermined
goals and objectives. Furthermore the same measurements have the possibility to
inform which areas need to be improved.
Performance measurement that has a detailed character is usually measured on a more
frequent and in a more detailed level. Even though the detailed performance
measurement only shows a specific number, they illustrate the general picture and
status of how the current activity is performing (Slack & Lewis, 2008).
Slack & Lewis (2008) mention also the importance of finding the right balance of
having a few measurements, which are easy to manage, towards having several
complex measurements, which is more difficult to handle.
According to Slack & Lewis (2008, p175.) they mention that “Whatever the
individual measures of performance which we extract from an operation, the meaning
we derive from them will depend on how we compare them against some kind of
standard”.
A way to compare the performance measurement from a company is to analyze it
towards previous data in the same area and see if an improvement has been
established. Another method is to perform a benchmark, this to compare a company‟s
16You can also read