Forced Displacement and Human Capital Evidence from Separated Siblings
←
→
Page content transcription
If your browser does not render page correctly, please read the page content below
Forced Displacement and Human Capital
               Evidence from Separated Siblings
          Giorgio Chiovelli∗          Stelios Michalopoulos      †
                                                                        Elias Papaioannou       ‡

                                           Sandra Sequeira§

                                          December 7, 2021¶

                                                Abstract

          We examine the impact of conflict-driven displacement on human capital looking at the
      Mozambican civil war (1977 − 1992), during which more than four million civilians fled to
      the countryside, to cities, and to refugee camps and settlements in neighboring countries.
      First, we present descriptive patterns linking education and sectoral employment to the
      various displacement trajectories using the full population census. Second, we compare
      siblings separated during the war, using those who stayed behind as a counterfactual to one’s
      displacement path. Displacement is associated with increased educational investments, with
      the largest effects experienced by rural-born children escaping to urban areas. Third, we
      jointly estimate place-based and uprootedness effects. Both are present, with displacement
      increasing education and decreasing attachment to agriculture by the same rate as being
      exposed to an environment approximately one standard deviation more developed than
      one’s birthplace. Fourth, we conduct a survey in Mozambique’s largest Northern city, whose
      population doubled during the civil war. Those displaced to the city have significantly
      higher education than their siblings who remained in the countryside and they converged
      to the levels of schooling of non-mover urban born individuals. However, those displaced
      exhibit significantly lower social/civic capital and have worse mental health, even three
      decades after the war ended. These findings reveal that displacement shocks can trigger
      human capital investments, breaking links with subsistence agriculture, but at the cost of
      long lasting, social, and psychological traumas.

  ∗
      Universidad de Montevideo; Prudencio de Pena 2440, Montevideo 11600, Uruguay. gchiovelli@um.edu.uy.
Web: https://sites.google.com/view/giorgiochiovelli/
    †
      Brown University, Economics Department, Robinson Hall 64 Waterman Street, Providence, RI, USA.
smichalo@brown.edu. Web: https://sites.google.com/site/steliosecon/
    ‡
      London Business School, Regent’s Park, London, NW1 4SA, United Kingdom. eliasp@london.edu. Web:
https://sites.google.com/site/papaioannouelias/
    §
      London School of Economics and Political Science. s.sequeira@lse.ac.uk. Web: https://sites.google.
com/view/sandramgsequeira, corresponding author
   ¶
      We thank Pinjas Albagli, Gabriela Deschamps, Andres Fajardo-Ramirez, Guy Pincus, Michelle Rao, Vivian
Liu and especially Tarek Abdo and Matthew OBrien for great research assistance. We gratefully acknowledge
financial support from the International Growth Center and Sandra Sequeira acknowledges financial support
from the European Research Council, Starting Grant (REFUGEDEV). We thank seminar and conference par-
ticipants at Harvard, Trinity, Jerusalem, Brown, LSE, Universidad de Montevideo, Universidad de los Andes,
BREAD, ECONtribute workshop, EBRD-Kings Conference on Migration, University of Padova, and the CEPR
Macroeconomics and Growth Programme Meeting.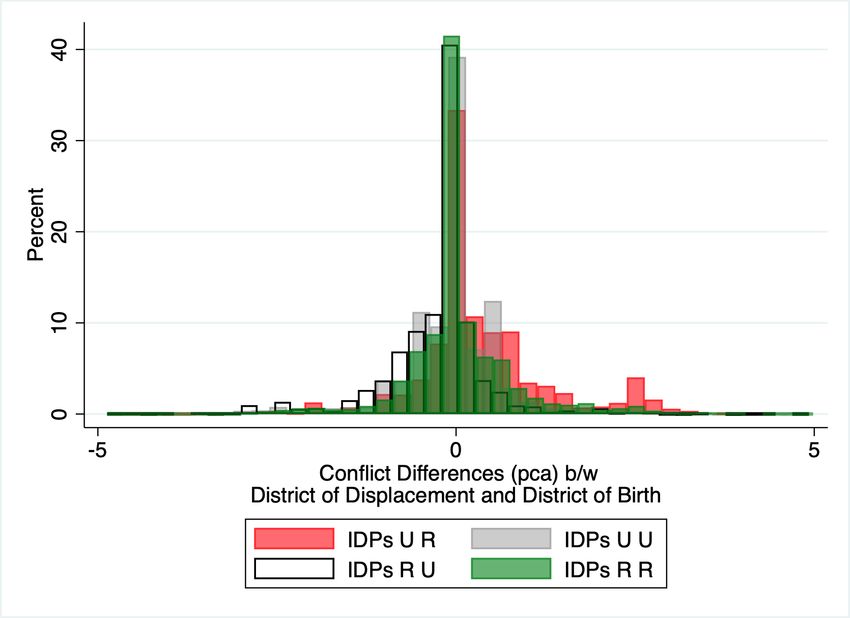
1       Introduction

At the end of 2020, more than 82 million people had been forcibly displaced from their homes.

Protracted conflict in Syria, Yemen, Libya, Afghanistan, and civil violence in Myanmar and

Venezuela have contributed to a doubling of this figure since 1990. One person becomes dis-

placed every three seconds (UNHCR 2020); just in 2020 about 11 million were forced to flee.

With worsening conflict in many parts of the world, the number of displaced seeking shelter

across the developing world is expected to rise, particularly in Africa. Besides the lasting con-

flicts in Congo, Sudan, and the Sahel, there is an escalation of violence in the Tigray region in

Ethiopia and in Northern Mozambique.

        Forced displacement can take many forms. The most common (about 60%, 48 million

in 2020) is internal displacement (IDPs) to either rural or urban areas. The remaining share

(40%) corresponds to individuals fleeing to neighboring countries and residing in UN-managed

camps or in informal settlements. Yet, despite the increasing salience of this phenomenon, there

is limited empirical evidence on its short and long-term impacts. Often constrained by detailed

but small surveys, the literature (discussed below) usually studies a single type of displacement.

Moreover, most case studies zoom into advanced economies, even though 85% of those displaced

live in the developing world.1 There are also formidable challenges to identification: conflict

is not random and several household and locality characteristics may shape both displacement

and economic choices.

        This paper advances on these issues by examining the impact of displacement on schooling

and sectoral employment in the context of one of the most devastating post-WWII civil wars:

the displacement of about a third of Mozambique’s population during a protracted civil war

(1977-1992). During this period, at least seven hundred thousand Mozambicans sought shelter

in camps managed by the United Nations High Commission for Refugees (UNHCR 1998) in

Zimbabwe and in Malawi. Thousands more fled to Zambia, Swaziland, and Tanzania, settling

in villages and in informal settlements. However, similar to conflicts today, the majority were

internally displaced. Roughly 1.8 million rural-born sought protection across Mozambique’s

    1
     The UN estimates that 36 of the most fragile countries in the world account for less than 3% of global GDP
but host over a third of the world’s forcibly displaced.

                                                      1
vast countryside and its few urban centers, while about 700, 000 urban-born were reshuffled
across other towns. The government’s villagization and food production policies moved about
50, 000 city-dwellers to the countryside during the war period.
The impact of forced displacement on human capital is ambiguous. On the one hand,
disruption magnified by insecurity and poverty, may force children out of school. On the other
hand, displacement may spur human capital investments, as it represents a mobile asset that
cannot be expropriated. This idea goes back to Stigler and Becker (1977), who credit Reuben
Kessel and earlier scholars on the uprootedness hypothesis (see Becker et al., 2020). Many have
argued, for example, that the expulsions of Jews were instrumental in fostering human capital
(see Botticini and Eckstein, 2012). Nevertheless, the destination is likely to have first-order
effects. Fleeing to areas with more opportunities may incentivize educational investments,
while displacement into poorer, more violent districts may nullify (exacerbate) any positive
(negative) uprootedness effects. While there is growing evidence on the impact of regions
and neighborhoods , empirical studies focus on movements during peaceful times, rather than
conflict-driven displacement (e.g., Chetty and Hendren, 2018a,b; Nakamura et al., 2021).
1.1 Results Preview
We reconstruct the movements of the full Mozambican population (about 12 million) during the
civil war to study the consequences of multiple displacement trajectories in a single setting. Our
analysis proceeds in four steps. First, we present correlational evidence linking the displacement
paths of more than four million Mozambicans to schooling during the civil war and sectoral
employment five years after its end. Compared to rural non-displaced from the same district,
IDPs completed higher levels of schooling, particularly those who fled to cities and towns. In
contrast, those who flee to rural areas experience smaller gains in schooling relative to those
staying behind. The analysis for the urban-born mirrors these patterns. Urban dwellers forcibly
displaced to the countryside are less educated than those staying or moving into other cities.
Educational gains move in tandem with a shift out of agriculture into services, suggesting that
conflict-driven human capital accumulation might spur structural transformation (see Porzio
et al., 2020).
2Second, to tighten identification we focus on families with siblings separated from each
other during the war. Comparing brothers and sisters with different trajectories accounts
for household characteristics, related to exposure to violence, aspirations and preferences for
education, religious and ethnic background, among others. Looking at split siblings is important
in itself, as it is a devastating though defining feature of contemporary conflicts (Gluck and
Alalem, 2020). Displaced into cities and towns have a higher propensity to attend school and
work in services, compared to their brothers and sisters who stayed behind. Even displacement
to other rural areas, often destitute, increases schooling, albeit to a lesser extent. The within-
family estimates are smaller in magnitude than the cross-sectional ones, suggesting that sorting
is present, even in a fairly unpredictable civil war.
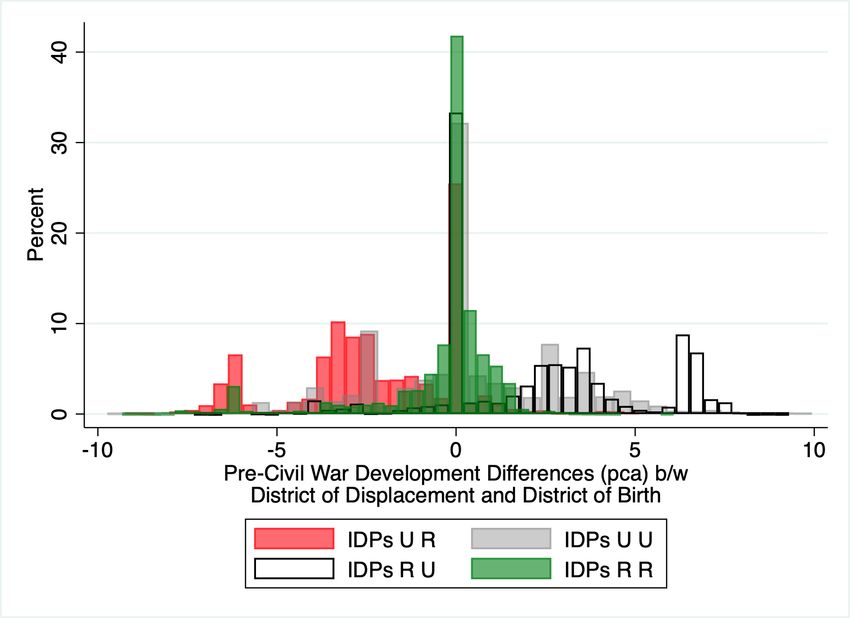
Third, we measure uprootedness and place-based effects in a single framework. To cap-
ture place effects we exploit origin-destination differences in development (stock of human cap-
ital, population density, school availability) and conflict intensity (battles, landmines). Both
forces are at play. Individuals displaced into worse (better) places lose (gain) compared to their
staying-behind siblings. At the same time, IDPs to areas comparable to their birthplace are
significantly more likely to attend school and shift into services after the war. The uprootedness
effect is sizeable and comparable to moving to a district that is roughly one standard deviation
more developed than one’s birth district.
Fourth, we report on a self-administrated survey of 208 residents of Nampula, Mozam-
bique’s most populous Northern city, whose population surged during the war. In line with the
short-run Census-based patterns, three decades after the war, IDPs in Nampula have signifi-
cantly higher education compared to their siblings in the countryside. IDPs’ education is similar
to those born and raised in the city, despite large urban-rural educational gaps at the time and
today. However, IDPs report much lower social capital, civicness, and community trust than
urban-born never displaced. Moreover, IDPs score significantly worse on mental health and
appear more pessimistic than urban-born respondents. This survey highlights both the upside
and the considerable long-run social and psychological downsides of forced displacement.
31.2 Related Literature
Our paper is part of the literature examining the economic impact of refugee flows. This
work has overwhelmingly looked at resettlement in advanced economies (e.g., Friedberg, 2001;
Borjas, 2003; Borjas and Monras, 2017; Foged and Peri, 2016) or at historical episodes, such as
the relocation of Germans after WWII (Peters, 2019), Poles resettlement from the East to the
West in 1945 (Becker and Ferrara, 2019), and the population exchange between Turkey and
Greece in the mid 1920s (Benos et al., 2021). 2 Our contribution to this research agenda is
sixfold. First, we focus on a low-income environment, comparable to contemporary civil war
settings. Second, we provide a comprehensive account of population movements’ impact during
conflict using the universe of the Mozambican population, against a literature that mostly
works with surveys and small samples.3 Third, the Mozambican civil war allows us to study
different experiences in a unified framework, understanding their relative impact on human
capital investments and occupational choices, against a literature that invariably looks at a
single trajectory.4 Fourth, we sharpen identification comparing about 135, 000 siblings (from
45, 000 families) with different displacements. Fifth, we estimate in a single framework both
exposure and uprootedness effects, quantifying their relative importance. Sixth, we document
the long-term consequences of forced displacement: the lasting positive impact on education,
but also chief downsides, worse mental health and social disengagement.
Our paper connects to a broader literature on civil wars (see Blattman and Miguel, 2010,
for a survey). The impact of conflict on human capital is not well-understood as some studies
document a negative correlation (e.g., Saing and Kazianga, 2020; Chamarbagwala and Morán,
2011; Fergusson et al., 2020), while others a positive one (Chen et al., 2007). We uncover
a link between displacement, human capital, and a shift out of (subsistence) agriculture, as
a potential mechanism of post-conflict recovery that appears heterogeneous. Our focus on a
specific aspect of civil wars also relates to studies “unbundling” conflict, looking, for example,
2
See Becker and Ferrara (2019); Verme and Schuettler (2021); and Devictor et al. (2020) for reviews.
3
Verwimp et al. (2020), for example, analyze data from 4, 523 Burundian women to examine the impact of
conflict-induced displacement on fertility.
4
Sieverding et al. (2018) look at educational enrollments of Syrian refugees in Jordan. Fransen et al. (2018)
compare the education of externally displaced Burundians to locals after their return. Ginn (2020) compares
Syrian refugees in Jordan, Iraq and Lebanon.
4at child-soldiering (Blattman and Annan, 2010), landmines (e.g., Chiovelli et al., 2019), and
bombardment (Miguel and Roland, 2011; Dell and Querubin, 2018; Riaño and Valencia, 2020).
Our paper relates to research trying to isolate the causal impact of places from spa-
tial sorting (Chetty and Hendren, 2018a,b; Bazzi et al., 2019; Alesina et al., 2021a). Rather
than looking at internal migration in peaceful times, we look at conflict-induced displacement,
bringing two new results. First, exposure matters for human capital accumulation, even in
poverty-stricken settings. Second, individuals who are forcibly displaced invest more in human
capital, above and beyond any exposure effects, revealing the upside of disruption.
Structure. Section 2, discusses forced population movements during the war. Section 3
presents correlational evidence in the full census linking educational investments and sectoral
employment to the different displacement trajectories. Section 4 reports the within-family es-
timates. Section 5 isolates exposure and uprootedness effects, comparing siblings with different
displacement paths. Section 6 presents the survey results. Section 7 concludes.
2 Historical Background and Data
2.1 Civil War
Mozambique gained independence from Portugal in 1974, after a decade-long war that ended
with the rise to power of Mozambique’s Liberation Front (FRELIMO). FRELIMO provided
shelter to the African National Congress and the Zimbabwean African National Union that
fought the apartheid regimes in South Africa and Rhodesia, respectively. In response, the
Rhodesian Secret Service backed the Mozambican National Resistance (RENAMO), an initially
small rebel group, to destabilize the country.
In the first phase of the war (1977 − 1980), RENAMO attacked military bases and in-
frastructure in central provinces, close to the Zimbabwean border. The conflict took a violent
turn in 1980, when South Africa took over RENAMO’s patron role after the fall of Ian Smith’s
regime in Rhodesia. In the second phase (1980 − 1986), the war spread throughout Mozam-
bique, as RENAMO’s operational capacity improved. With efforts to bring South Africa and
Mozambique closer failing, the war entered its third phase (1986 − 1990) marked by REN-
5AMO’s “terror” against civilians. Village burning, killings, child soldiering raids, and looting
became widespread (Gersony, 1988) and the (limited) state apparatus collapsed. In the fourth
phase (1990 − 1992), FRELIMO introduced a new constitution safeguarding civil and political
rights, which together with South Africa’s shift away from supporting RENAMO led to the
end of the war, with the signing of the Rome Treaty in October of 1992. At the end of the
war, Mozambique was the second poorest country in the world with more than 85% engaged in
(subsistence) agriculture and more than 60% of its population illiterate (World Bank, 2020).
2.2 Displacement
Population reshuffling was a defining feature of the conflict. Civilians fled to neighboring
countries, mostly Malawi and Zimbabwe, to other rural areas, and to cities. The UN led an
unprecedented repatriation assisting millions to return home between 1992 and 1994.
Our primary data source is the Mozambican decennial Census of 1997, the first post-war
and effectively the first post-independence, as the the 1980 Census only recorded population
counts. This Census allows us to reconstruct the displacement trajectories of the universe of the
surviving population. Specifically, it provides information on an individual’s location during
three key points in time: place of birth (at the admin-2 level, 216 districts); residence in 1992
prior to the end of the war (also at the district level); and residence in 1997 (at the admin-4
level, 1, 187 localities). With this information, we reconstruct the movements for the universe
of 12 million individuals five years and older in 1997.5
Table 1 reports the number and share of displaced, by trajectory, distinguishing between
urban and rural born.6 Besides the full population figures, columns (3) and (4) report the
distribution for 5, 625, 327 Mozambicans between 12 and 32 years of age in 1997, whose primary
schooling decisions were made during the civil war. Appendix B provides further evidence,
summary statistics, and descriptive statistics.
5
We also drop 768, 784 individuals with missing information of residence in either 1997, or 1992, or at birth.
6
The National Institute of Statistics classifies as urban 23 cities and 68 towns with median populations in
1980 of 56, 718 and 7, 740, respectively.
6Table 1: Refugees, Internally Displaced, and Non-Movers
Full Sample (5+) Sample (12-32)
Observations Proportion Observations Proportion
(1) (2) (3) (4)
Refugees 783,105 0.07 363,542 0.06
Born Abroad 182,217 0.23 53,616 0.15
Refugee, Rural 537,323 0.69 275,393 0.76
Refugee, Urban 63,565 0.08 34,533 0.09
Internally Displaced 2,470,986 0.21 1,193,207 0.21
Internally Displaced, Rural 1,785,338 0.72 852,808 0.71
Internally Displaced, Urban 685,648 0.28 340,399 0.29
Non Displaced 8,730,392 0.73 4,068,578 0.72
Non Movers, Rural 6,614,035 0.76 3,012,113 0.74
Non Movers, Urban 2,116,357 0.24 1,056,465 0.26
Total 11,984,483 5,625,327
Notes: The table shows the number and share of refugees (externally displaced), internally displaced, and non-displaced
individuals as recorded in the 1997 Census. In each category, we distinguish between individuals born in rural districts
and urban localities, using the Census classification. Columns (1)-(2) provide tabulations for individuals aged 5 and older
(full sample), while columns (3)-(4) show the statistics for individuals aged 12-32 in 1997.
2.2.1 Non-Displaced
“Non-Movers” denote Mozambicans residing at the end of the civil war (in 1992) in their district
of birth. Roughly 2.1 million urban-born are non-movers (half in the 12 − 32 sample) and close
to 6.6 million rural-born (3 million aged 12 − 32). [The Census does track the timing of the
displacement nor temporary moves. Moreover, we cannot track within-district movements.]
2.2.2 External Displacement
Close to 600, 000 civilians were externally displaced during the war and 180, 000 were born
abroad. Over 550, 000 resided in Malawi in 1992 and about 125, 000 in Zimbabwe; with 60, 000
Mozambicans found in Tanzania, Zambia, and Swaziland, alongside local communities at the
end of the war. About 50, 000 refugees were in South Africa (Table B.1.) The Census does not
record whether people settled in a camp. But, almost all Mozambicans in Zimbabwe settled in
five UNHCR camps. In Tanzania, Zambia, and Swaziland, Mozambicans moved into villages
and informal settlements. In Malawi, refugees settled in twelve UN-run camps and in small
towns.7 Refugee flows accelerated in the mid 1980s, during RENAMO’s terror.
7
The country-specific numbers roughly coincide with UN estimates (UNHCR 1992). The Census misses
about 15% who stayed in the country of displacement; those returning before 1992; temporary moves; and
returning refugees deceased before 1997.
7Panel A: Forced Displacement by District of Birth
Refugees IDPs Rural −→ Rural IDPs Rural −→ Urban
Panel B: Forced Displacement by Residence Locality in 1997
Refugees IDPs Rural −→ Rural IDPs Rural −→ Urban
Figure 1: The figures plot the spatial distribution of the share of rural-born displaced Mozambicans across 216
birthplace districts and 1,197 residence localities, as recorded in the 1997 Census. There are three displacement categories:
(i) Externally displaced (refugees) residing or born in a neighboring country in the end of the war (1992). (ii) Internally
displaced people found at the end of the war (1992) in a town or city. (iii) Internally displaced people (IDPs) residing in
1992 in another than their birthplace rural district. Table 1 provides the totals for each trajectory.
Figure 1, panels (A)-(B) plot the share of externally displaced across birth districts
(admin-2) and residence localities in 1997 (admin-4). It was mostly civilians born in border
areas who fled the country. Refugees did not have the right to work and given the scarcity
of employment opportunities, they largely depended on UN transfers. The UNHCR funded
schools, both in areas with a large number of refugees and in camps (Azevedo, 2002, p. 47).
Refugees lacked “any psychological assistance, beyond basic medical care (. . . ) (Brennan, 1986).
8Azevedo (2002, p. 70) estimates that at least 43% of refugees had nothing to do in the camp, 12%
were drunk, 19% engaged in some farming activity, 6% spent time cutting wood and selling it
and 8% traded items inside and outside the camp as a daily occupation. Most refugees returned
to their place of birth (over 85%) after the war (UNHCR 1994).
2.2.3 Internal Displacement
Given the considerable heterogeneity in internal displacement, we classify the 2.5 million IDPs
by birth origin and displacement destination (Table B.2 provides details).
Rural to Urban Displacement: During the civil war, small and big towns experi-
enced a significant inflow of IDPs. Half of the rural-born IDPs (about 900, 000) sought pro-
tection in urban centers. Maputo-Matola, Beira, and Nampula, the three largest (coastal)
cities, received close to half a million IDPs. 190, 000 (21%)) rural-born moved to ten smaller
cities and towns (Chimoio, Nacala-Porto, Quelimane, Tete, Xai-Xai, Maxixe, Lichinga, Pemba,
Dondo, and Angoche) and 200, 000 (22%) moved to 81 smaller towns. Urban households grew,
as many accommodated displaced relatives.8 Living conditions in the cities were challenging,
with food shortages and insecurity. However, schools and hospitals were functional. Figure 1
illustrates the spatial distribution of rural to urban displacement. It was mostly those born
close to the cities on the coast who managed to reach them. The mean share of individuals
ending in cities/towns is small (4%), as the fragmented transportation network, contaminated
by landmines, and rebel attacks made it hard to reach the coastal cities.
Rural to Rural Displacement: About 900, 000 rural-born Mozambicans resided in a
rural area other than their birth region during the war. Such rural-to-rural movement is un-
common during peaceful times. Internal rural-to-rural displacement was widespread as the civil
war hotspots changed and civilians tried to adapt to the constantly changing circumstances.
Besides, RENAMO forcibly moved peasants into forced labor villages in controlled territories
to produce food and carry goods [see Appendix A].
Urban to Rural Displacement The Census records a non-negligible movement of
about 186, 000 people from urban places to the countryside. First, FRELIMO’s villagization
8
By 1991, the average urban household comprised 5.7 persons, compared to 4.4 in the countryside.
9scheme pushed some urban dwellers into communal villages, as one of the program’s objec-
tives was to populate areas that could fall to RENAMO. Second, in the mid-1980s, FRELIMO
relocated urban-dwellers to the countryside to boost food production.
Urban to Urban Displacement: The census reveals the urban to urban movement of
half a million IDPs. Two-thirds reflect movements into the largest cities (Maputo, Beira and
Nampula) from smaller, often-attacked by RENAMO, towns in the interior.
Post-War Repatriation: In 1992, UNHCR initiated one of its largest repatriation
efforts. Rates of return by 1997 ranged from 5% for those who had moved from an urban area
to another urban area, to 27% for rural-born dislocated to another rural district. Rates of
return for rural to urban moves were about 12%. Table B.3 provides details on repatriation
patterns by birth district, residence in 1992, and in 1997.
2.3 Data
The Mozambican decennial Census of 1997 provides information on our key outcomes: educa-
tional attainment and sectoral employment. The Census also provides individual and family-
level characteristics, like gender, age, household size and offspring mortality.
We combine the 1997 Census with additional data. First, we digitized archival railroad
and road maps in 1973, just before independence. Second, we processed and geo-coded data
from the Ministry of Education on the location of primary schools from 1963 until 1992. Third,
we digitized maps of colonial trade hubs – cantinas that alongside population density we use
to proxy local development (Portuguese Colonial Yearbooks, 1965). Fourth, we extend the
Uppsala Conflict Data Program Georeferenced Event Dataset (UDCP-GED) that covers 1989−
1992 with information on the main civil war battles from Domingues (2011), Robinson (2006),
and Weinstein (2002). Fifth, as an alternative conflict proxy, we use the extent of landmine
and unexploded ordinance contamination from Chiovelli et al. (2019).
2.4 Drivers of Displacement
While our focus is on the implications of the various forced displacement trajectories, we
also explored its drivers as this helps gauge the type of selection that underpins population
10movements. We run linear probability (and multinomial logit) models linking displacement
(types) to regional and family characteristics for rural and urban born. The results, reported
in subsection B.4, reveal the importance of conflict; in contrast, differences in development are
uncorrelated with displacement. Figure 1(a)-(f) illustrate geography’s role: distance to the
border is the most significant correlate of external displacement, while distance to cities corre-
lates with displacement to urban centers. However, the economic significance of the prediction
models are low. Warfare and location explain a tiny portion of the variation in displacement,
as the civil war entailed many idiosyncratic features and unpredictable dynamics.
3 Correlational Evidence
This section reports correlational evidence linking education and sectoral employment to dif-
ferent displacement patterns across the full population.
3.1 Specification
Given the considerable differences between rural and urban born, we run separate specifications
for the two groups. To isolate educational investments during the civil war (1977 − 1992), we
focus on Mozambicans aged 12 to 32 in 1997.
Yil = α + β1 EDPil + β2 IDP (R − U )il + β3 IDP (R − R)il + νXi + µl + il (1a)
Yil = α + β4 IDP (U − R)il + β5 IDP (U − U )il + νXi + µl + il (1b)
Yil denotes education and employment sector for individual i, born in locality l. EDP identifies
those who are externally displaced or born in a neighboring country. IDP (R−U )il corresponds
to rural-born displaced to an urban district. IDP (R − R)il equals one for rural born, who
at the end of the war resided in another rural district. IDP (U − R)il and IDP (U − U )il
denotes urban-born displaced to a rural or to another urban district, respectively. Xi reflects
individual controls, gender and age dummies. Birthplace fixed effects, µl , absorb differences in
the socioeconomic environment in the region of birth. Standard errors are double clustered at
11the district of birth and residence in 1992, to accounts for spatial correlation.9
3.2 Results
Table 2 reports LS estimates for rural born in Panel A and urban born in Panel B. Columns
(1)-(2) and (3)-(4) report OLS estimates on the association between the different displacement
trajectories and the probability of completing at least one year of primary school and years
of schooling, respectively.10 Columns (5)-(8) give linear probability model (LPM) estimates
looking at agriculture and service employment, respectively.11 Odd-numbered columns provide
a test of means across displacement paths (as there are no controls), while even-numbered
columns condition on gender, age, and birth-district fixed effects.
3.2.1 Rural Born [Panel A]
The estimates on the externally displaced are close to zero, revealing that refugees’ educational
outcomes are quite similar to that of non-movers, the omitted category. Once we condition on
age, gender, and birthplace the estimates are nil. In contrast, IDPs from the countryside to
cities/towns have, on average, higher human capital, when compared to non-movers of the same
age, gender, and birth district. The difference in primary school attainment is considerable,
24 − 30 percentage points (pps), which is significantly larger than the mean value of non-
movers, 13pps. Rural-born IDPs to cities have a 1.7 − 2.0 extra years of schooling, against
a non-movers baseline of 0.7 years. Rural-born IDPs to another rural district also have more
schooling compared to non-movers from the same birth district: the propensity to attend at
least one year of school is 7pps higher and IDPs an extra half year of extra schooling by 1997.
In columns (5)-(8) we explore whether the various displacement paths correlate with a
shift out of agriculture towards services. On the one hand, displacement may facilitate occupa-
tional shift, as IDPs and refugees lost access to land. And there may be more opportunities in
retail and other services in towns. On the other hand, the transition to services may have been
9
Clustering at the admin-3 level or adjusting errors with Conley’s method yields similar inference.
10
As schooling years is highly nonlinear with many zeros, Table C.1 reports Negative Binomial ML and
Poisson ML estimates. The implied magnitudes are similar to LS.
11
The drop in observations is due to missing information that may reflect underemployment and/or imper-
fectly recorded employment status.
12challenging, as education levels were low, poverty was endemic, and Mozambicans had been
working in agriculture for generations. The cross-sectional estimates reveal significant sectoral
employment shifts for the internally displaced. IDPs into urban areas are more likely to work
in services five years after the end of the war. The coefficient is sizable (34pps) and drops
modestly with the introduction of controls (29pps). We also observe some modest sectoral
employment shifts of 5 − 6pps for IDPs moving to another than their birthplace rural area. For
refugees the sectoral employment patterns appear no different than those of rural non-movers
from the same birth district.
Table 2: Forced Displacement, Schooling, and Employment - Cross-Sectional Estimates
Agriculture Service Sector
Schooling (Dummy) Years of Schooling
Employment Employment
(1) (2) (3) (4) (5) (6) (7) (8)
Panel A: Born Rural
Externally displaced -0.020*** -0.003 -0.087*** -0.031 0.012*** -0.011 -0.006*** 0.005
[0.004] [0.006] [0.023] [0.044] [0.004] [0.007] [0.002] [0.004]
Intern. Displ. Rural → Urban 0.297*** 0.243*** 1.984*** 1.677*** -0.396*** -0.327*** 0.335*** 0.289***
[0.020] [0.016] [0.141] [0.116] [0.038] [0.027] [0.033] [0.025]
Intern. Displ. Rural → Rural 0.074*** 0.069*** 0.503*** 0.471*** -0.071*** -0.056*** 0.059*** 0.048***
[0.010] [0.013] [0.073] [0.089] [0.010] [0.012] [0.008] [0.010]
Mean Omitted 0.130 0.130 0.723 0.723 0.900 0.900 0.055 0.055
Observations 4,185,268 4,185,268 4,185,268 4,185,268 2,716,853 2,716,853 2,716,853 2,716,853
Adj. R-squared 0.060 0.136 0.072 0.147 0.101 0.204 0.107 0.161
Panel B: Born Urban
Intern. Displ. Urban → Rural -0.090** -0.087*** -0.586* -0.581*** 0.168** 0.175*** -0.134* -0.142**
[0.042] [0.030] [0.298] [0.220] [0.083] [0.066] [0.072] [0.059]
Intern. Displ. Urban → Urban 0.142*** 0.155*** 1.158*** 1.244*** -0.261*** -0.212*** 0.241*** 0.206***
[0.017] [0.029] [0.084] [0.224] [0.018] [0.048] [0.015] [0.048]
Mean Omitted 0.413 0.413 2.556 2.556 0.543 0.543 0.337 0.337
Observations 1,416,124 1,416,124 1,416,124 1,416,124 574,164 574,164 574,164 574,164
Adj. R-squared 0.015 0.217 0.020 0.236 0.055 0.386 0.048 0.267
Omitted Category Non-Mover Non-Mover Non-Mover Non-Mover Non-Mover Non-Mover Non-Mover Non-Mover
Controls No Yes No Yes No Yes No Yes
Age FE No Yes No Yes No Yes No Yes
District of Birth FE No Yes No Yes No Yes No Yes
Notes: The table reports estimates associating schooling and employment outcomes with various displacement trajectories
for individuals aged between 12 and 32 in 1997. The dependent variable in columns (1)-(2) is an indicator variable that
takes the value of one for individuals who have completed at least one year of formal education and zero otherwise. The
dependent variable in (3)-(4) is years of schooling. The dep. var. in columns (5)-(6) and (7)-(8) are indicator variables that
take the value of 1 for employment in agriculture and the service sector, respectively, and zero otherwise. Even-numbered
columns additionally control for gender and include age and district-of-birth fixed effects. Panel A shows trajectories for
rural-born Mozambicans and panel B focuses on urban born Mozambicans. The externally displaced indicator identifies
those who in 1992 resided in neighboring countries; the category includes those born in rural areas in Mozambique or those
born in neighboring countries. IDP R-U is an indicator that takes the value of one for rural-born individuals who reside in
1992 in urban regions and zero otherwise. IDP R-R is an indicator that takes on the value of one for rural-born individuals
residing in 1992 in some rural district different from their own region of birth. IDP U-R is an indicator that takes the
value of one for urban-born individuals who reside in 1992 in rural regions and zero otherwise. IDP U-U is an indicator
that takes on the value of one for urban-born individuals residing in an urban area that is not their district of birth. The
omitted category in panel A are rural-born Mozambicans residing in the same district in 1992 and the omitted category in
panel B are urban-born Mozambicans residing in the same district in 1992. The rural-urban classification follows the 1997
Mozambican Census. Heteroskedasticity-adjusted standard errors clustered on two dimensions (admin-2 region of birth
and admin-2 region of residence in 1992) are reported below the coefficients. *, **, and *** indicate statistical significance
at the 90%, 95%, and 99%, confidence level, respectively.
133.2.2 Urban Born
Turning to urban-born (Panel B), those found in rural areas at the end of the war have lower
education compared to those who stayed in cities and in towns. Average years of schooling for
urban-born non-movers was 2.56, with 41.3% having completed at least one year of schooling.
The unconditional drop in the likelihood of attending schooling for those displaced in the
countryside is about 9 percentage points and 0.6 years. Accounting for birth place, gender,
and age does not much change the estimates. Movers to other urban hubs experienced higher
levels of schooling; 15.5 pps increase in attending primary school and 1.24 years of schooling.
Columns (5)-(8) show that urban-born displaced into rural areas are more likely to work
in agriculture (by 0.175 pps), as compared to services. The sign of the correlations are reversed
for those moving during the war to another urban area. The coefficient on service employment
(out of agriculture) is is 0.21 pps higher (lower), compared to a baseline of 0.34 (0.54).
3.3 Interactions
We report in Appendix C that those with higher levels of schooling are more likely to shift into
service employment. This suggests that human capital investments can go hand in hand with
structural transformation (see also Porzio et al., 2020).
4 Sibling Analysis
While the Mozambican civil war entailed several unpredictable and idiosyncratic aspects, the
full Census estimates do not yet capture causal relationships. Families and individuals may have
sorted into different environments and incurred in educational investments based on hard-to-
observe individual, household, and locality characteristics. To sharpen identification, we exploit
the fact that in the chaos of the war, attacks by militias and rebels often resulted in families
separation.12 The Mozambican war was ripe with instances of abductions, child-soldiering
raids, and the forced relocation of thousands. UNICEF estimated that by 1989, there were
12
Recognizing the pervasiveness of this phenomenon, UNICEF and the International Committee of the Red
Cross (ICRC) have set up programs to reunite families in post-conflict settings.
14about 250, 000 separated children from either their parents or their siblings.13 .
In this Section, we compare (close to age) siblings that experienced different displacement
paths during the war. This setting allow us to account for regional characteristics at birth and
residence in 1977 at the most granular level, and family attributes, household size, preferences,
aspirations, and networking capital. The within-family design also accounts for religion, eth-
nicity, culture, and social practices, which are strong correlates of education in Africa (Alesina
et al., 2021b). We first provide an overview of households with separated siblings. Second, we
lay down the sibling-pair empirical specification. Third, we present the within-family results.
Fourth, we summarize the sensitivity checks. Fifth, we go over the heterogeneity analysis.
Appendix D gives descriptives and presents the sensitivity and heterogeneity analysis.
4.1 Split Households. Patterns and Characteristics
4.1.1 Patterns
Table 3 plots the distribution of 45, 445 households with at least two 12 − 32 year-old siblings
residing in different districts in 1992 but together in the same household in 1997.14 Approxi-
mately 10, 000 rural-born families had one sibling moving to a city by 1992, while the remaining
sibling(s) were in their birthplace. 5, 970 households had (at least) one sibling in a neighbor-
ing country and another in the region of birth. About 9, 000 rural households had a son or
daughter residing in another rural district in 1992, with a sibling staying at birthplace. 8, 000
urban-born households had siblings experiencing different displacement trajectories. More than
5, 000 households had siblings internally displaced into different regions (e.g., city and other
rural districts). There are 4, 195 households with siblings facing three types of displacement.
13
In Appendix A, we review accounts and testimonies of children separated from their families during the
war using at the time reports and surveys (Gersony, 1988; Human Rights Watch, 1991; Boothby et al., 1991).
14
Siblings are sons or daughters of the household head. In the Appendix we also compare all young individuals
in the same household with different displacement paths during the war to account for those that in 1997 had
not reunited with their siblings. These non-reunited young individuals appear in the census in some other
relationship to the household head (nephew, niece, etc).
15Table 3: Displacement Patterns of Split Households
Split Household (12-32 yo)
Households Proportion Siblings Proportion
NM Rural and IDP Rural → Urban 10,020 0.22 28,663 0.21
NM Rural and IDP Rural → Rural 9,132 0.20 25,853 0.19
NM Rural and Externally Displaced 5,970 0.13 17,552 0.13
NM Rural and IDP Urban → Urban 170 0.00 440 0.00
NM Rural and IDP Urban → Rural 188 0.00 504 0.00
NM Urban and IDP Urban → Rural 2,448 0.05 6,877 0.05
NM Urban and IDP Urban → Urban 4,294 0.09 13,763 0.10
NM Urban and Externally Displaced 1,243 0.03 4,112 0.03
NM Urban and IDP Rural → Urban 451 0.01 1,436 0.01
NM Urban and IDP Rural → Rural 256 0.01 658 0.00
Ext. Displ. and IDPs 1,736 0.04 4,934 0.03
Various Trajectories of IDPs 5,342 0.12 13,979 0.10
More than 3 displacement trajectories 4,195 0.09 17,717 0.13
Total 45,445 1.00 136,488 1.00
The table reports in columns (1) and (2) the number and percentage of split households, defined as those where at least
two 12-32 year-old individuals in 1997 with different displacement trajectories. Columns (3) and (4) give the number and
percentage of separated siblings of households with different trajectories. For rural-born and urban individuals there are
four possibilities: (1) non-displaced (NM rural and NM urban); (2) internally displaced people (IDP) to an urban locality;
(3) IDPs displaced to a rural area; (4) Externally displaced outside Mozambique.
Figure 2, panels (A)-(D) plot the spatial distribution of separated households at the end
of the civil war. Panels (A)-(B) portray the number of split households across birth districts
(admin-2 units) and residence locality in 1997 (admin-4 units). Panels (C)-(D) reflect the share
of split households to total households across districts and localities of residence during the 1997
Census, respectively. There are more split households in areas proximate to Maputo/Matola,
Beira, Xai Xai, Inhambane, and Chimoio, the main (coastal) cities in the South and Center.
Separated households are somewhat less likely in the Northern provinces, as the civil war there
spread after the mid-1980s. Once we standardize by population (number of households), regions
more heavily affected by the civil war including those South of the Zambezi river (just north
of Beira) have a higher density of split households.
4.1.2 Households with and without Separated Siblings
Our analysis rests on the comparison between households with separated siblings and house-
holds in which siblings remained together. The latter category consists of families that moved
together and households that remained in their birthplace. Table D.2 and Table D.3 in the
Appendix show that household heads and grandparents of families with separated siblings have
16Number of Households in Separated Sibling Sample
Panel A: District of Birth Panel B: Locality in 1997
Share of Households in Separated Sibling Sample
Panel C: District of Birth Panel D: Locality in 1997
Figure 2: Panels (A) and (B) plot the spatial distribution of the number of households where at least two
siblings, aged 12-32 in 1997, have followed different displacement trajectories across 216 birth regions (admin-2
units) and 1,195 localities of residence in 1997 (admin 4 units). Panels (C) and (D) plot the distribution of
households with separated siblings across birth regions and residence localities as a share of birth district and
residence households with at least two siblings, aged 12-32 in 1997.
similar education levels to non-split households. Given that these investments were made prior
to the war, it suggests that the two sets of families are likely comparable on other non-observable
dimensions to begin with. Households with separated siblings are, on average, larger and the
mother (spouse of the household head or the female head) reports more children born alive.
Larger families may have found it harder to stay put or to move together during a protracted
war. Split households compared to families that never moved also experienced more adverse
17conditions, as reflected in child mortality.15 This is not the case when we compare separated
families to families that were displaced together. As we do not know the time of children’s
death, we cannot conclude whether displaced families faced higher mortality before or during
displacement. However, the simple tabulations reveal that separated families have experienced
more deprivation and adversity compared to households that were not displaced, reinforcing
the involuntary nature of displacement.
4.2 Specification
In our baseline within-family specification the unit of analysis is a pair of siblings i, j with
different displacement trajectories.
∆Yij = α + β1 ∆EDPij + β2 ∆IDP (R − U )ij + β3 ∆IDP (R − R)ij +
(2a)
δi Xi + δj Xj + φ∆Ageij + µli + µlj + ij
∆Yij = α + β4 ∆IDP (U − R)ij + β5 ∆IDP (U − U )ij +
(2b)
δi Xi + δj Xj + φ∆Ageij + µli + µlj + ij
∆Yij denotes the difference in outcomes between siblings i and j. Xi and Xj denote
sibling-specific controls, age constants, gender, and an indicator for the eldest child in the
household.16 We also include siblings’ age difference fixed-effects, ∆Ageij . As siblings may
have been born in different places, we include birth-district fixed effects, µli and µlj .
4.3 Results
Table 4 reports the sibling-pair estimates for differences in schooling in columns (1)-(4), and
sectoral employment in columns (5)-(8). Panel A presents results for rural born, while Panel
B examines urban born.
15
We construct family child mortality by subtracting from the number of born-alive children those not alive
in 1997. For these comparisons we omit 5.5% of families with multiple wives.
16
Birth order may impact selection into displacement and schooling. Signing the bias is, however, unclear. On
the one hand, households may relocate the eldest sibling to the cities or safer rural areas to secure a safe-haven
for the rest of the family to follow. On the other hand, families may prefer that the eldest sibling stays behind
to protect the house and ancestral farmland.
18Table 4: Forced Displacement, Schooling, and Employment - Separated Sibling Analysis
∆ Agriculture ∆ Service Sector
∆ Schoolingij ∆ Years of Schoolingij
Employmentij Employmentij
(1) (2) (3) (4) (5) (6) (7) (8)
Panel A: Born Rural
∆ Externally Displacedij 0.018 0.013 0.070 -0.003 -0.078*** -0.050*** 0.028*** 0.011
[0.024] [0.008] [0.160] [0.065] [0.016] [0.014] [0.008] [0.008]
∆ Intern. Displ. Rural → Urbanij 0.077*** 0.073*** 0.544*** 0.530*** -0.046*** -0.039*** 0.045*** 0.043***
[0.010] [0.007] [0.066] [0.052] [0.011] [0.009] [0.009] [0.009]
∆ Intern. Displ. Rural → Ruralij 0.030*** 0.028*** 0.240*** 0.235*** -0.001 -0.003 -0.002 -0.001
[0.005] [0.005] [0.029] [0.030] [0.005] [0.005] [0.004] [0.004]
Non-Mover Mean 0.197 0.197 1.095 1.095 0.848 0.848 0.081 0.081
Observations 102,426 102,426 102,426 102,426 32,860 32,851 32,860 32,851
R-squared 0.006 0.074 0.009 0.084 0.008 0.086 0.005 0.052
Panel B: Born Urban
∆ Intern. Displ. Urban → Ruralij -0.075*** -0.087*** -0.393*** -0.492*** 0.004 0.006 0.011 0.014
[0.018] [0.016] [0.110] [0.099] [0.010] [0.011] [0.011] [0.011]
∆ Intern. Displ. Urban → Urbanij 0.030*** 0.022* 0.357*** 0.283*** -0.019 -0.017 0.021 0.023
[0.011] [0.012] [0.096] [0.094] [0.013] [0.012] [0.014] [0.014]
Non-Mover Mean 0.425 0.425 2.526 2.526 0.527 0.526 0.335 0.335
Observations 45,576 45,576 45,576 45,576 6,966 6,951 6,966 6,951
R-squared 0.004 0.114 0.005 0.121 0.001 0.140 0.001 0.074
Sample Age 12-32 12-32 12-32 12-32 12-32 12-32 12-32 12-32
Controls No Yes No Yes No Yes No Yes
Own District of Birth FE No Yes No Yes No Yes No Yes
Sibling District of Birth FE No Yes No Yes No Yes No Yes
Age Difference FE No Yes No Yes No Yes No Yes
The table reports linear model (LM) estimates associating the difference between siblings on an indicator variable that
takes the value of 1 if the individual has completed one year of formal education and zero otherwise [models (1)-(2)], years
of schooling [models (3)-(4)], an indicator variable that takes the value of 1 if an individual is employed in agriculture
and zero otherwise [models (5)-(6)] and an indicator variable that takes the value of 1 if an individual is employed in the
service sector and zero otherwise [models (7)-(8)]. The sample consists of siblings, aged 12-32 years old in 1997, who come
from split households (i.e., at least one brother and sister experienced a different displacement trajectory). Panel A gives
estimates across rural born. ∆ Externally Displacedij measures the difference between siblings on externally displaced
status (those who in 1992 resided in neighboring countries and those born in neighboring countries). ∆ Intern. Displ.
Rural → Urbanij is a variable that measures the difference between siblings on rural to urban displacement status (rural-
born individuals who reside in 1992 in urban regions) and ∆ Intern. Displ. Rural → Ruralij is a variable that measures
the difference between siblings on rural to rural displacement status (rural-born individuals residing in a rural area outside
their region of birth in 1992). Panel B gives estimates across urban-born individuals. ∆ Intern. Displ. Urban → Ruralij is
a variable that measures the difference between siblings on urban to rural displacement status (urban-born residing in 1992
in rural regions) and ∆ Intern. Displ. Urban → Urbanij is the difference between siblings on urban to urban displacement
status (urban-born residing in an urban region in 1992 outside their region of birth). The rural-urban classification follows
the 1997 Mozambican Census. Heteroskedasticity-adjusted standard errors clustered on two dimensions (admin-2 region
of birth of sibling i and admin-2 region of residence in 1992 of sibling i) are reported below the coefficients. *, **, and ***
indicate statistical significance at the 90%, 95%, and 99%, confidence level, respectively.
4.3.1 Rural Born [Panel A]
Externally Displaced: Refugees have similar levels of schooling to non-mover siblings, a
pattern that echoes the cross-sectional patterns across all 12-32 year olds in Table 2. Even
though the UN built primary schools in camps, villages and towns in Zimbabwe and Malawi
with Mozambican refugees, there is not much evidence that this translated into significantly
higher investments in education. This is likely driven by the dearth of employment opportu-
nities leading, potentially, to low perceived returns to education. Specifications (5)-(8) suggest
19however a small occupational shift of refugees out of agriculture, possibly due to the loss of
land during the period of displacement. Compared to their non-moving siblings, externally
displaced have 5pps lower likelihood of working in agriculture, five years after the end of the
war.
IDPs to Urban: Turning now to IDPs in cities and towns, the education specifications
reveal substantial gains. Namely, a 7.3 percentage points increased likelihood of attending some
primary schooling and 0.53 more years of schooling, compared to their siblings staying behind
in rural areas. The magnitudes are considerable, roughly a third of the mean for their non-
displaced brothers and sisters (with primary school access of about 20% and one year of formal
schooling on average). The within-family estimates are smaller than the cross-sectional ones,
revealing considerable selection. Columns (5)-(8) look at occupational shifts. Rural-to-urban
IDPs have 4 pps higher likelihood of non-agricultural (service) employment.
IDPs to Other Rural The sibling-pair comparisons show that displacement to other
than birthplace rural areas also increases education. The estimates imply a 3pps higher likeli-
hood of attending school and an increase of 0.24 years. These estimates, while not large, are
supportive of the uprootedness hypothesis as rural Mozambique was at the time one of the most
impoverished and most insecure parts of the world. We return to this issue in the next Section.
IDPs into other rural areas have employment similar to their staying behind siblings. This
finding accords with the historical narratives, as IDPs in the countryside continued working
in agriculture. for example, in RENAMO’s notorious forced-labor camps or in FRELIMO’s
communal villages [see Appendix A].
4.3.2 Urban Born [Panel B]
IDPs to Rural: Urban-born displaced to the countryside have about 9pps lower likelihood of
attending primary school and about 0.5 less years of schooling, as compared to their brothers
and sisters who stayed in their cities and towns of birth. These results suggest that FRELIMO’s
forced relocation of urban dwellers in the countryside during “operation production” and the
move of dissidents into “development villages” had adverse consequences for human capital.
IDPs displaced to the countryside do not seem to have a differential attachment to agriculture
20compared to their siblings (albeit in a considerably smaller sample and starting from a lower
baseline). The within-family estimates for the urban-born are much smaller in absolute value
as compared to the cross-sectional ones, revealing selection.
IDPs to Other Urban: Urban-born moving to other cities and towns have similar
education and sectoral employment to their staying-behind brothers and sisters. The marginally
significant within-family correlation (0.02) is 5-7 times smaller than the cross-sectional highly
significant estimates, illustrating spatial sorting.
4.4 Sensitivity Analysis
We conduct several sensitivity checks that, for brevity, we report in subsection D.2. First,
we simply add family fixed effects to the cross-sectional specifications (equations 1a and 1b).
While we cannot control for sibling-pair features, these simpler specifications are directly com-
parable to the cross-sectional estimates in Table 2. These results are similar to the sibling-pair
specifications. Second, we rerun the sibling pair specifications among individuals 12 and 18
years in 1997, as co-habitation rates with parents drop for older children. Results are stable.
Third, we expand the comparisons to extended family members, such as cousins or other rela-
tives, in the same household. Fourth, we drop the oldest (male) sibling to minimize concerns
of parents’ favoritism. Fifth, rather than controlling for gender, we only consider boy-to-boy
and girl-to-girl comparisons. Sixth, we zoom on siblings four, three, and even two years apart.
Across all permutations, we obtain similar results to Table 4. (i): Schooling of refugees is
similar to their siblings, of similar age and gender, staying in the countryside. (ii): There are
considerable benefits for rural-born IDPs displaced to urban centers; about 5 − 6pps higher
likelihood of attending any primary school, 0.35 − 0.5 extra years of schooling; and a 30pp
increased propensity to work outside agriculture. (iii): Rural IDPs displaced to another rural
area other than their birthplace district also enjoy small-to-modest higher schooling attainment
and years. (vi): Urban-born displaced into the countryside have lower schooling and are more
likely to work in agriculture after the end of the war.
214.5 Heterogeneity
We also explored heterogeneity, reported in subsection D.3. First, we look at siblings moving
with an older household member, without detecting significant differences. Second, we examine
whether split but reunited in the birthplace siblings fare differently compared to separated
siblings who reunited in a different location after the civil war. The estimates are similar
across the two groups. Third, we test whether refugees in countries with different integration
strategies (e.g., Zimbabwe hosted UN camps while in Zambia, Tanzania, and Swaziland refugees
gathered in informal camps and villages) fare any differently when compared to their siblings
staying behind. There is again not much heterogeneity.
5 Place-Based vs. Uprootedness Effects
The within-household estimates are in line with both the importance of place-based effects (as
IDPs into cities and towns invest in education the most) and the uprootedness hypothesis, as
even rural to rural displacement generates some educational improvements. In this section, we
further unpack these mechanisms and estimate jointly place-based and uprootedness effects.
Appendix E reports robustness checks.
5.1 Approach
To capture the role of regions, we first compile for each displaced measures reflecting differences
between the destination (displacement) region d and (birth) origin district (o) in development
and civil war intensity. Given noise and imprecision in the regional data, we aggregate via
principal components proxies of development and conflict.17 We aggregate six proxies of re-
gional development: (i) log population density in 1997, excluding individuals born after 199218 ;
(ii) share of (non-displaced) grandparents that speak Portuguese or have some schooling; (iii)
offspring mortality of non-displaced women older than 35; (iv) log road density in 1973; (v) log
number of colonial agricultural markets (cantinas) per sq. km. in 1965; and (vi) log number
17
subsection 2.3 gives variable sources. Appendix B provides summary statistics, the correlation structure,
and mappings of the spatial distribution of all development and conflict proxies.
18
The correlation between population density in 1997 and density at the birth district is 94%.
22You can also read