Food Policy - Open Scholarship @ IU Bloomington
←
→
Page content transcription
If your browser does not render page correctly, please read the page content below
Food Policy xxx (xxxx) xxx
Contents lists available at ScienceDirect
Food Policy
journal homepage: www.elsevier.com/locate/foodpol
Informal vendors and food systems planning in an emerging African city
Stacey Giroux a, *, Jordan Blekking a, b, Kurt Waldman b, Danielle Resnick c, Daniel Fobi b
a
Ostrom Workshop, Indiana University, 513 N. Park Ave., Bloomington, IN 47408, United States
b
Department of Geography, Indiana University, Student Building 120, 701 E. Kirkwood Ave., Bloomington, IN 47405, United States
c
International Food Policy Research Institute (IFPRI), 1201 Eye Street NW, Washington, DC 20005, United States
A R T I C L E I N F O A B S T R A C T
Keywords: Rapid urban growth is straining infrastructures, economies, and food security of cities in sub-Saharan Africa
Informal vendors (SSA). Amid competing issues of sanitation, housing, and unemployment, planning for urban food security re
Zambia ceives less attention. Despite the proliferation of supermarkets in SSA, informal food vendors remain crucial
Food access
sources of food for the majority of households. However, as cities grow and planners try to adapt, these informal
Urban food systems
vendors are generally left out of planning considerations, marginalized by policies that do not support this
business model, or subjected to political vicissitudes. This paper analyzes how vendors in emerging cities are
economically, socially, and spatially integrated within the urban food system, highlighting the assets these
vendors represent and the ways they might support growth in cities. We map vendors’ networks of food sup
pliers, and describe sources of operating capital and labor assets to show the range of services vendors utilize and
the types of institutions, businesses, and individuals that vendors use to support their work. We spatially analyze
the relationship between vendors and suppliers, and between vendors and households, to demonstrate how
enmeshed these vendors are in the broader food system and the links they create between consumers and
suppliers. We demonstrate that due to spatial differences and vendors’ and consumers’ needs in emerging cities,
a one-size-fits-all approach for integration of informal vendors in the food system is less likely to be successful in
terms of either economic development or household food security.
1. Introduction in urban areas. Limited access to food can mean that large swathes of
urban areas face chronic food insecurity. The inability of current food
Globally, over half the population lives in urban areas, with that systems to meet the food demands of urban residents in SSA has been
proportion expected to grow to 68% by 2050 (UN DESA, 2019). The referred to as “the emerging development issue of this century” (Crush
population of sub-Saharan Africa (SSA) is expected to shift to a majority and Frayne, 2010, p. 6).
of urban residents around 2035 (UN DESA, 2019). Such rapid popula Increasingly however, the challenge of urban food security is gaining
tion and urban growth present challenges for infrastructures, econo policy prominence on global and regional agendas. For instance, with
mies, and food security in cities in SSA. Prioritization of sanitation, the signing of the Milan Urban Food Policy Pact1 in 2015 and the launch
housing, and employment means that planning for urban food security of the New Urban Agenda2 a year later, national and local policymakers
of residents receives less attention. To date, the majority of food security have gradually acknowledged the need to strengthen urban food systems
research in SSA has focused on rural production and food availability to provide affordable and nutritious food (UN, 2017). Other initiatives
(Crush and Frayne, 2010; Crush and Riley, 2019), although focus is include the C40 Urban Food Systems Network3 and the Food and Agri
shifting to issues of food accessibility, particularly in the context of culture Organization’s Food for the Cities Programme4 that examines
urban food security (Frelat et al., 2016). Most urban residents must city-region food systems. All of these initiatives acknowledge that in
purchase food rather than grow it for themselves, creating a need to equalities in urban housing and employment pose distinct challenges for
understand the relationship between food accessibility and food security food accessibility and affordability and require a more comprehensive
* Corresponding author.
1
http://www.milanurbanfoodpolicypact.org/.
2
http://habitat3.org/the-new-urban-agenda/.
3
https://www.c40.org/networks/food_systems.
4
http://www.fao.org/in-action/food-for-cities-programme/en/.
https://doi.org/10.1016/j.foodpol.2020.101997
Received 26 May 2020; Received in revised form 28 September 2020; Accepted 28 October 2020
0306-9192/Published by Elsevier Ltd. This is an open access article under the CC BY license (http://creativecommons.org/licenses/by/4.0/).
Please cite this article as: Stacey Giroux, Food Policy, https://doi.org/10.1016/j.foodpol.2020.101997
S. Giroux et al. Food Policy xxx (xxxx) xxx
policy response rather than a purely sectoral focus on agriculture. understood (Fox, 2012; Mitlin and Satterthwaite, 2013; Potts, 2011; UN
The urban food system landscape in SSA features a range of retailers DESA, 2018). Although primary cities, those large cities that often serve
and producers that households may patronize, including small local as national administrative centers (e.g., Lusaka, Nairobi, Accra), will
grocers and specialty shops like butchers, local farmers, formal mar continue to grow, smaller, secondary cities (often defined as having a
ketplaces, informal or street vendors, and supermarkets, which continue population between 100,000 and 500,000; UN DESA, 2018) will witness
to make significant inroads in urban areas of SSA (Blekking et al., 2017; the majority of population growth, particularly in Africa and Asia.
Reardon et al., 2003; Reardon and Timmer, 2012). However, informal A significant proportion of the urban population in SSA is engaged in
food vendors in particular are crucial sources of food for the majority of informal employment. “Informal” refers to “income generating activities
households in SSA (Battersby and Watson, 2018a, 2018b; Crush and that operate outside the regulatory framework of the state” (Meagher,
Frayne, 2011; Roever and Skinner, 2016). Informal food vendors are 2013, p. 2). The view of two separate economies, formal and informal, is
individual food retailers who generally operate outside the formal food no longer generally accepted. Instead, scholars and practitioners
provisioning system and in many contexts are conducting business recognize that the formal and informal intersect and are linked in
without legal status or protection. In Zambia, such vendors are a het various ways (Chen, 2012; Meagher, 2013). Central to our contribution
erogeneous constituency. Street vendors who violate zoning codes by is this concept of linkages, as we examine the ties informal vendors have
operating in public spaces, such as the sides of roads or outside estab with a range of individuals and businesses. These informal vendors are
lished markets, are technically illegal based on Statutory Instrument No. part of the informal economy but are also key nodes in food systems in
44 of 2007 (amended in 2018 under the Local Government Act Statutory SSA more broadly.
Instrument No. 12), deemed a “public nuisance,” and face range of fines. Despite a large body of work on informality in African economies (e.
In addition, the Public Health Act as well as the Food and Drugs Act g., Lourenço-Lindell, 2010; MacGaffey and Bazenguissa-Ganga, 2000),
govern when and where local authorities can seize foods that are research focusing on informal vendors and their role in the food system
deemed unsafe and unfit for consumption, and can fine traders is limited. This is especially true for those operating outside any kind of
accordingly (Skinner and Haysom, 2016). Vendors who work within market structure – that is, those individuals operating fresh or prepared
markets—known as marketeers—are legally allowed under the 2007 food vending enterprises either in place on the street, or on foot, mobile.
Markets and Bus Stations Act; however, due to either ignorance of reg Organizations such as FAO and Women in Informal Employment:
ulations or poverty, some may not have obtained the proper business Globalizing and Organizing (WIEGO) have collected statistics and re
licenses and food safety permits, or do not comply with the council fee ported on street vendors in African contexts (e.g., Chen, 2012; FAO,
structure established for selling from a stall or table. 2016a; Roever, 2014; Vanek et al., 2014), and scholars working with
Vendors’ treatment by policymakers in Africa has thus far ranged bodies such as the African Food Security Urban Network (AFSUN) have
from benign neglect to outright repression. When urban policymakers in illustrated how important informal vendors are to ensuring food security
SSA do plan for or enact measures to manage urban food systems, among urban residents in SSA (e.g., Battersby et al., 2016). Others have
informal vendors are increasingly left out of planning considerations, or highlighted the resilience of vendors as supermarkets spread across SSA
are marginalized by policies that do not support this business model, (e.g., Nickanor et al., 2019) or revealed the power structures under
often in the name of “modernizing” cities (Battersby and Watson, 2018a; which vendors must attempt to operate (e.g., Porter et al., 2007; Siame
Berger and van Helvoirt, 2018; Smit, 2018; Wanyama et al., 2019). At et al., 2021). In addition to informal vendors, household food sources
worst, vendors are harassed and forcibly removed or relocated, their also include small local shops selling mainly non-perishable goods,
wares and stands confiscated or even destroyed. Such actions ignore restaurants, food remittances and aid, urban agriculture, food sharing
vendors’ integral role in addressing spatial disparities in the food system via social networks, and, increasingly in some parts of SSA, supermar
(Benson et al., 2005; Okwi et al., 2007). For example, households on the kets. However, food access and sourcing are especially dependent on
urban periphery may be more closely linked to production areas for their income and context. In urban areas, though households may shop across
food access, while those in the town center may rely more on shops the range of informal and formal retailers, poorer households tend to
(Anand et al., 2019). rely more on informal vendors, while wealthier households shop more
Given the growing focus on urban food security, what role can frequently at supermarkets (Battersby and Watson, 2018a, 2018b;
informal vendors play in supporting urban food systems, and what Skinner, 2016). Informal food vendors provide poorer households with
support do they need to ensure such food systems are resilient? This better opportunities to achieve food security by being spatially acces
paper utilizes data on informal vendors’ personal networks coupled with sible and specifically serving such households by doing things like of
household survey data collected in the town of Mumbwa, Zambia. The fering credit or “breaking bulk” (Battersby, 2012). Across SSA, over 70%
analysis reveals how vendors are economically, socially, and spatially of households rely on these vendors for food access by regularly sourcing
integrated in the urban food system and illustrates spatial aspects of both food from them (Battersby and Watson, 2018b; Crush and Frayne,
vendors’ utilization of food suppliers and household food sourcing from 2011).
vendors. We argue that policies and planning for urban food systems in For the vendors themselves, there has been a range of studies (Anku
SSA must include informal vendors, but furthermore, that in terms of and Ahorbo, 2017; FAO, 2016a; Skinner and Haysom, 2016) that both
integrating vendors in the food system, a one-size-fits-all approach is less illustrate the diversity among vendors (e.g., in educational level, na
likely to be successful in terms of either economic development in the tionality, to what degree vending is a survival strategy) and identify
informal sector or household food security. In doing so, we continue to some general features of them: they tend to be self-employed or owner-
shift conversation to focus on the assets that street vendors can provide operators, female, and crucial sources of employment, especially for
for rapidly urbanizing cities in SSA, rather than viewing them as a policy women. They also typically do not have access to running water or
nuisance or a political tool, as when candidates for office selectively electricity, yet they offer a wide range of prepared, packaged, and fresh
enforce or ignore anti-vending laws in order to win votes from particular foods (Battersby et al., 2016; FAO, 2016a; Resnick et al., 2019; Skinner,
constituencies (Resnick, 2019). 2016). We also know that while urban informal vendors’ activities,
rights, and political awareness vary widely by city size and governance
2. Background context, the common response of cities to these vendors has been
repression (Brown et al., 2015; Kamete, 2007, 2009; Kamete and Lindell,
By 2030, a majority of the global urban population is projected to 2010), although enforcement of repressive tactics also varies widely by
live in cities of fewer than one million people (Shifa and Borel-Saladin, the location and size of city governments (Resnick et al., 2019).
2018). Urbanization in SSA is a dynamic process that is happening very Regulators’ concerns over informal vending include loss of business
rapidly, is unique across locations and histories, and is not well for formal retailers, street congestion, potential for increased crime in
2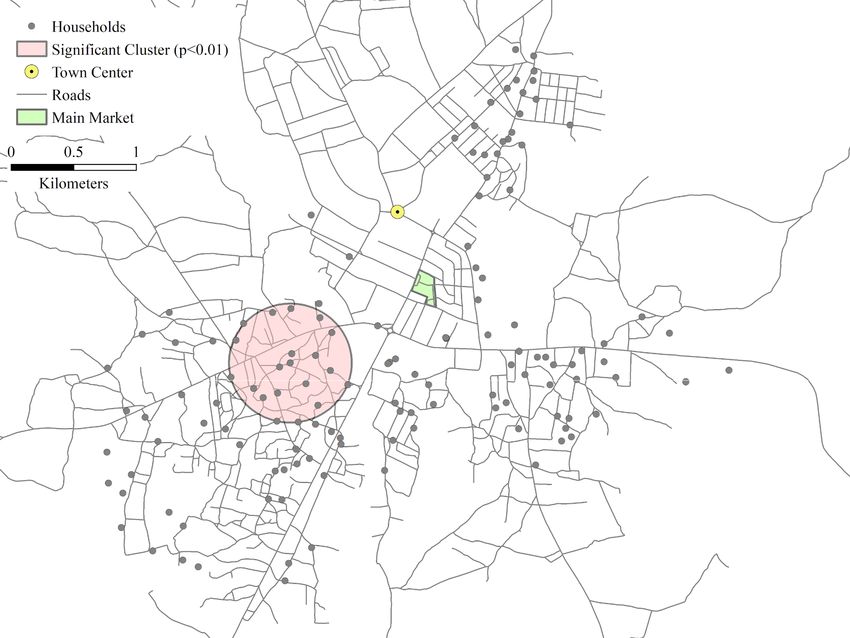
S. Giroux et al. Food Policy xxx (xxxx) xxx
areas of dense informal trading, loss of tourism because vendors are cities and may function as district- or provincial-level government
perceived to make cities look ugly or un-modern, and disease spread centers, logistics hubs, or manufacturing or service industry centers.
(Chileshe, 2020). In conjunction with a narrative that has evolved over Tertiary cities in particular may be largely trade-based with high levels
time to cast informal vendors in a negative light (Potts, 2008), and of informal employment (Roberts, 2014, p. 37). The World Bank (2017)
inconsistent efforts to enforce anti-vending laws, attempts to enforce refers to tertiary cities as agrocities–defined as agriculture towns and
food safety and public health regulations have led to further fraught cities with under one million people—and notes that they face distinct
relationships between vendors and legal authorities. Vendors’ knowl policy challenges in terms of providing access to business skills for micro
edge and performance of proper hygiene and public health practices enterprises and sufficient dietary diversity to consumers.
varies (e.g., FAO, 2016a; Mjoka and Selepe, 2017), and cities tend to be Mumbwa is a compelling place to study an urban food system
unable to consistently support and enforce food safety laws because of because it tells us something about the processes of growth and urban
limited resources. In addition, vendors are not always able to comply ization in a less densely settled environment. We can see how early in
with laws due to cost (e.g., required medical examinations) or low terventions in food systems planning might ameliorate some of the
availability of services (e.g., infrastructure for laboratory tests; Monney dynamics of food security that have become so problematic in more
et al., 2013). While cities and governments often maintain a “generally mature cities across SSA. In a place like Mumbwa, where supply chains
punitive approach to the informal sector, that focuses on regulation and are shorter, the linkages between informal food vendors and farmers,
control” (Skinner and Haysom, 2016, p. 14), in the long run, such processors, wholesalers, and consumers are clearer. As such, there are
repressive tactics have generally proved to be fruitless (Kazembe et al., more opportunities for food policy interventions to strengthen these
2019; Onodugo et al., 2016; Steel et al., 2014). Scholars and practi linkages to be more “strategic rather than responsive” (Battersby and
tioners have encouraged planning departments to recognize the Watson, 2018b, p. 205).
important role that informal vendors play in local food security and to
include informal vendors in food system planning for cities: “Rather 3. Study site and methods
than resorting to draconian measures, governments across the continent
must find ways to engage with informal workers that will ensure Africa’s 3.1. Study site
urban populations have adequate access to safe and nutritious foods”
(Resnick, 2017, para. 7). In Zambia, 72 percent of the urban labor force is informally
With this paper, we make two major contributions. First, we link employed, which is defined as a lack of entitlement to annual paid leave
three important sets of dynamics relevant to informal vendors in food and absence of social security (Central Statistical Office, 2015). Food
systems in SSA: the critical role of informal vendors in urban food se retail is an especially critical sub-sector of informal employment, espe
curity (e.g., Battersby et al., 2016; Crush and Frayne, 2011; Skinner, cially for women, who concentrate in fresh fruits and vegetables.
2016), their role in agricultural value chains (e.g., Reardon et al., 2003; Research in the capital of Lusaka suggests that the urban poor purchase
Reardon and Timmer, 2012), and the way informal trade functions as a more than 90 percent of their food from informal traders (Chileshe,
major source of income for the urban poor (e.g., Chen et al., 2004; Portes 2013). In Kitwe, a major secondary city, 88 percent of households report
et al., 1989). As Roever and others have described, informal street sourcing from open-air markets and almost half claim to purchase their
vendors make important contributions to urban life beyond their own food from street vendors (Skinner, 2018). Yet, minimal research has
employment and food security of citizens (Roever, 2014). The ways that been conducted on informal food vendors’ importance and livelihoods
informal workers are linked to other parts of the economy generate outside the country’s major cities.
demand for a range of other services, such as transportation, porters, and As such, this study focused on collecting data in Mumbwa, Zambia, a
suppliers of goods (Roever and Skinner, 2016). small city about two hours west of Lusaka via tarmac road (Fig. 1). Buses
Empirically, however, these linkages between vendors and con run from Lusaka, the national capital, daily, and it is close enough that a
sumers on the one hand and vendors and food suppliers on the other small number of the vendors we interviewed reported that they procured
have not been jointly analyzed. Using a unique set of data on both food to sell from Lusaka. Mumbwa is a rapidly expanding city: shortly
household consumption and vendors’ business operations, we analyze before data collection began, the city’s boundaries had been extended
vendors’ networks of food sourcing, startup and lending, and labor as (personal communication, Mumbwa council members, June 12, 2019),
sets to show the range of services vendors utilize and the types of places and there was ample evidence of new housing structures. Mumbwa is the
and individuals, across the continuum of economic formality, that capital of Mumbwa District, in Central Province. At the last census
vendors use to support their business. These places and individuals (2010), Mumbwa’s population was 20,390, with a projected population
include formal and informal lenders, local farms, the central market, growth rate of 3.3% (Central Statistical Office, 2012, 2013). The Zam
local shops, and family members, among others. Vendors are not merely bian Air Force has a base in this district, and Kafue National Park is close
surviving but are actively engaged with operating a business, drawing by to the west. The district is largely agricultural, with some copper and
on multiple types of resources to do so and creating additional economic gold mining industry, and the only Zambian-owned cotton ginnery is
links in the city in the process. just outside of Mumbwa.
We also directly link vendors to producer, distributor, and aggre The food retail landscape in Mumbwa consists mainly of small local
gator nodes, and integrate household-level food purchasing data to help shops or grocers and informal street vendors, but includes wholesalers
illustrate spatial aspects of both vendor-supplier relationships and con and one open-air traditional market. At the time of data collection in
sumer utilization of vendors. We provide visualizations of vendor- June 2019, a Choppie’s supermarket was due to open in the fall, and
supplier linkages, and spatially analyze the relationship between ven some small shopkeepers were cleaning and updating their stores in
dors and suppliers to test whether there are spatial differences in vendor anticipation of the increased competition. In terms of the policy envi
utilization of the central market as wholesaler. We then add a spatial ronment around informal vendors in Mumbwa, government officials are
analysis of household utilization of informal vendors, identifying clus guided by the federal Public Health Act, which lays out the acceptable
ters of household food retail sourcing around vendors. ways food can be handled, and the Local Government Act Statutory
We examine these dynamics in the tertiary city of Mumbwa, Zambia. Instrument No. 12 (Street Vending and Nuisances), which lays out
Urban food systems research in SSA and urban policy initiatives have sanctions for activities such as selling produce in any public place other
been almost entirely focused on primary and secondary cities. However, than a market established by the local council. In Mumbwa, informal
a growing proportion of citizens in SSA live in tertiary cities, which are vendors may be harassed and are warned multiple times before having
more numerous than secondary cities (UN DESA, 2019). According to goods confiscated, and they also face fines for noncompliance with the
Roberts (2014, p. 36), tertiary cities often serve as support for larger law. Officials are more concerned to confiscate highly perishable goods
3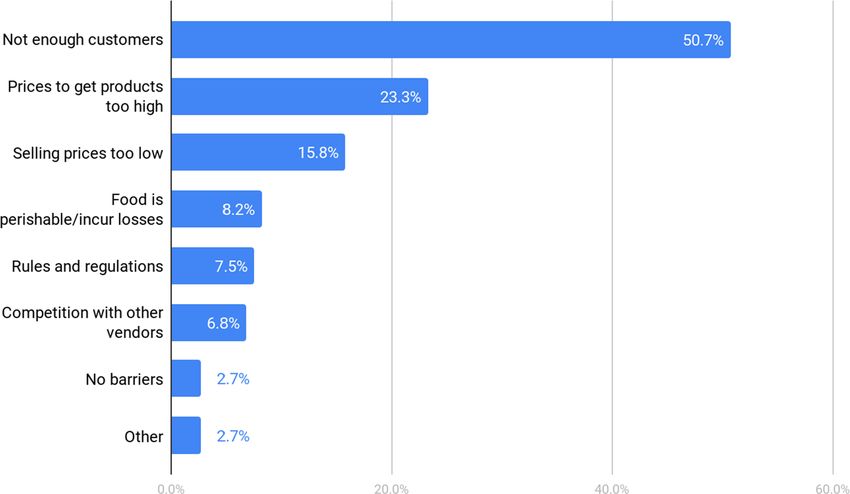
S. Giroux et al. Food Policy xxx (xxxx) xxx
Fig. 1. Map of study area.
such as meat, dairy, and prepared foods, and all vendors are regularly paid employees who helps regularly in the business or is involved in the
encouraged to sell from the main market in town rather than in the street business with the vendor; and anyone who helped the vendor get their
(personal communication, Mumbwa council members, June 12, 2019). business reestablished after having been forcibly removed. For each of
these categories of people or places, we followed up with questions such
as individuals’ relationship to the vendor, which foods were sought from
3.2. Data collection and analysis each supplier, and how others helped with the business. We also asked
demographic questions and some additional questions about experi
In this paper we present data collected from informal street vendors ences with forced removal, barriers to business, ability to get a loan, and
and households. There is no existing sampling frame for informal street general questions about their businesses.
vendors. Given the size of Mumbwa and our resources, we attempted to For household sampling, we focused on low and low-middle income
traverse all streets in Mumbwa, including those in the residential areas, residential areas, and used a stratified area random sampling method
at least one time and interview all street vendors (including mobile (Montello and Sutton, 2006). Sampled residential areas represent both
vendors) who were selling at least one of five main staple foods: maize, formally-designated and informally-established residential areas. The
tomatoes, greens (such as kale, rape or others), onions, or cooking oil. northwest area of Mumbwa was not sampled because that area is pri
This food item criterion did not exclude many street vendors that we marily higher-income residential housing. We sampled a minimum of 30
saw. We sought interviews on weekdays between 9:00 AM and 5:00 PM. households in each of the four sampled residential areas to ensure
We did not interview vendors who owned their own permanent store geographic distribution across areas of interest throughout Mumbwa.
front, nor did we interview any vendors who were established at formal One household member over the age of 18 and with knowledge of the
(i.e., legally sanctioned) markets. Additional vendors sometimes sold in household food practices responded to the survey, although there were
the main business district later in the evenings, but given that we had an instances when multiple household members were present during the
all-female enumerator team, we decided not to pursue additional in interview. When this occurred, the household member first contacted by
terviews after dark. From time to time a vendor was not at their stall and the research assistant provided the final answer to questions. The
we were not able to interview them – reasons for absence ranged from household survey collected data on household demographics, assets,
running errands to one vendor who was in the house giving birth when and food purchasing behavior.
we came by. We may also have missed vendors who only sold on the We present descriptive data about vendors and households, and re
weekends, although the majority of vendors operated six days a week or sults from a spatial analysis using hot spot (Getis-Ord Gi*) detection and
more (81% of our sample). We are confident that we reached a large Kulldorff spatial scan statistic. Hot spot analysis is used to discern
majority of vendors in Mumbwa who met our criterion for foods sold. whether there are concentrations of vendors within Mumbwa that
Vendors were only interviewed if they were over the age of 18. source more (less) from the traditional market, which is located in the
The data collection instrument for informal vendors asked vendors central business district of Mumbwa. Vendors treating markets and
for information about individuals and entities that provided them other established shops or supermarkets as wholesalers is a common
different kinds of instrumental support in their business, and we used a occurrence in Mumbwa as in other locations (Battersby et al., 2016;
software program specifically designed to capture personal network Nickanor et al., 2019). To identify spatial patterns in the differences in
data (Enso, 2018). We asked about food suppliers for each of the five urban food accessibility, we use the Kulldorff spatial scan statistic to
staple foods (maize, greens, tomatoes, onions, and cooking oil); anyone identify areas where there are higher (lower) than average values for the
who lent the vendor money or gave them credit to help them get started number of times a household visits informal vendors during a typical 14-
with the business; anyone who currently lends money or gives credit on day period.
a regular basis to help keep the business going; anyone aside from any
4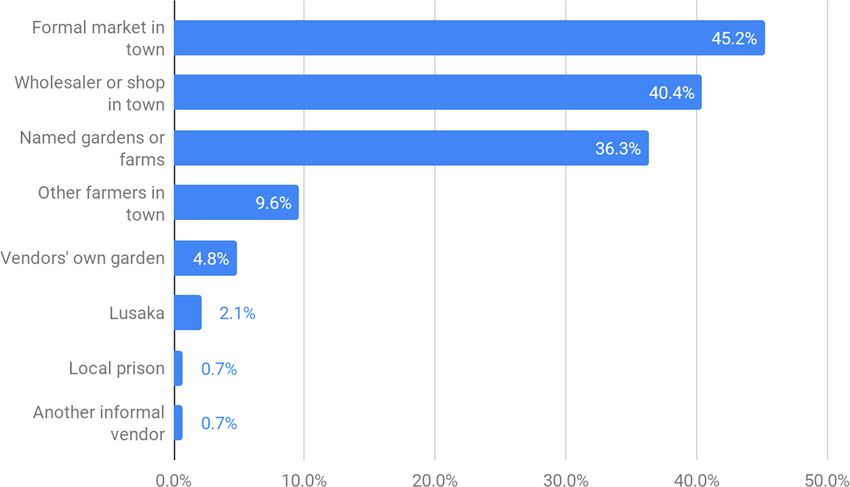
S. Giroux et al. Food Policy xxx (xxxx) xxx
4. Results informal banking institutions and other institutions like NGOs. Friends
and other vendors also provide unpaid help to vendors, mainly by selling
4.1. Vendor demographics and business characteristics for a vendor or watching their location when the vendor has to be away,
or helping to set up the location for business. Notably, no vendors have
The survey instrument for vendors asked three main demographic helpers who keep them informed of rules or regulations that pertain to
questions: age, highest level of education completed, and sex. The their business in the city, and very few vendors report having help
vendors were primarily female (88%), ranged in age from 18 to 66 with getting reestablished in business after being removed. This latter sta
an average and median of 35 years, and ranged in education from no tistic is due at least in part to the high number of vendors who, as noted
formal schooling to having completed post-secondary school. The mean above, stated that they “never really stopped” selling, that is, they
and median level of education was completion of primary school, with continued to sell and to be chased by local authorities. And if authorities
43% of vendors having completed primary school and 7.5% having do not confiscate or destroy vendors’ wares or infrastructure, vendors
completed secondary school. In addition, male vendors on average would be less likely to need help reestablishing their businesses. Fig. 3
completed more school than female vendors. Compared with vendors shows the proportion of vendors who leveraged linkages for each type of
elsewhere in SSA, more vendors in Mumbwa had at least some formal support, and what kind of person or institution provided that support.5
schooling (about 89% versus 82%; FAO, 2016b), yet fewer vendors in
Mumbwa had completed secondary school than vendors in Cape Town
(about 7.5% versus 20%; Battersby et al., 2016). Male vendors having 4.3. Vendor-supplier relationships
completed more school than female vendors is in line with other findings
(e.g., FAO, 2016b). One hundred and forty-six vendors mentioned 204 suppliers that
Vendors have worked in this trade on average for just over six years, they use to source the five staples in question. Vendors on average
with some having begun as recently as in the weeks prior to our field named more suppliers than other sources of support for their business. A
work and others having worked for as many as 32 years. We did not ask number of vendors mentioned the same suppliers, such as the central
whether vendors were migrants. Vendors work on average between six market in town and certain businesses and wholesalers. Many vendors
and seven days a week, with most working every day and only a few used multiple suppliers, while a handful sourced only from one supplier
working as little as two days a week. Vendors spent on average about a unique to them. Fig. 4 shows the categories of suppliers categorized into
half hour walking to reach a given food supplier, although 22.6% of broad groups and the usage of each by vendors.
vendors participate in group purchases of food suppliers. When asked why vendors used each of their suppliers, vendors often
For the majority of vendors, this work is their livelihood. For just noted that it was because the supplier was near their home (which was
over 75% of vendors, selling food is the only source of income for their often their selling location) or was otherwise conveniently located. Cost
household, and nearly 90% of vendors see this job as a permanent was an additional important consideration, but vendors consider a range
occupation, rather than a temporary survival strategy. Just over 17% of of reasons for choosing suppliers, such as quality of produce, or that the
vendors have paid employees, 8.5% pay to use the space from which supplier brings the goods to them - another aspect of convenience for
they sell food, and almost two-thirds (64.5%) have always sold from the vendors. Additional reasons generated by vendors included security for
same location. Most vendors choose their location out of convenience, as customers at the supplier, or the ability to be particular in choice (e.g.,
opposed to making the decision with respect to business opportunities or could choose the size of tomatoes they wanted). We note that no vendors
to escape threat of harassment. cited an ability to purchase on credit from a supplier as a reason.
Vendors also face business challenges. Half the vendors stated that, if In Fig. 5, we provide a visual representation of the network of all the
needed, they would not be able to secure a loan of as little as 250 kwacha vendor-supplier relationships. Some nodes represent a more general
(about $19 at the time of the survey). Twenty-nine percent had expe type of supplier named by vendors, such as the nodes that indicate a
rienced forced suspension or relocation of their business, the majority of general response along the lines of “multiple farmers” (despite asking
those (73.8%) having been told that it was due to concerns about cholera vendors for specificity in naming suppliers). We show the linkage to
outbreaks. Vendors reported having been removed by the local council, each vendor who provided this more generic response, because there are
and in one instance a vendor cited soldiers having been involved. About many farmers scattered throughout the area and we have no sense of
43% of vendors who had been removed said that they “never really whether one vendor’s farmer suppliers overlap with another’s. In
stopped selling” or that they were “still being chased.” But for vendors contrast to the choice to display multiple nodes to represent multiple
who did stop selling, their businesses were closed on average for about farmers, we left a single node type coded to represent multiple whole
7.5 months, with a range of two weeks to as long as two years. As for salers or shops in town because all shops and wholesalers are centrally
perceived barriers to business, the majority of vendors were concerned located in the business district and we can be sure that there is some
about the volume of business in terms of having enough customers, degree of overlap among shops and wholesalers used among, though we
rather than pricing and competition, which were much less of a concern cannot say for sure how they do overlap. Here we see that the most
for vendors (Fig. 2). Other responses included high costs for renting frequently used supplier is the traditional, open-air market in town,
selling space or transport of goods, suppliers being too far away, and which is the white square node with the most vendor connections to it.
unpredictability of income. There are a number of vendors who use that as their sole supplier, while
others use a mix of the market and other suppliers. There are a few other
4.2. Vendors’ instrumental support for the business suppliers who are used by multiple vendors, such as local wholesalers
and particular farms or gardens. However, there are also a few vendors
Overall, vendors named on average 2.56 network members, that is,
those individuals or businesses that they leverage to support their en 5
terprises. Vendors had on average 1.4 suppliers, and while 31% of The tiny share of vendors who claim that they depended on NGOs to help
them reestablish business is most likely due to three factors. First, the NGO
vendors named no sources of support other than their suppliers, other
community is largely concentrated in Lusaka. Second, it has become more
vendors named up to six network members. In addition to supplier links,
restricted and smaller since the introduction of the Non-Governmental Orga
we asked about four specific categories of support: financial support to nization (NGO) Registration Act in 2009; before the Act, more than 10,000
start or currently support the business, help reestablishing the business NGOs existed but a decade later, only 550 officially were registered. Third,
after forced removal, and other unpaid types of support. Family serve as there are few NGOs that specifically represent the rights of vendors, and those
sources of support in each of these ways, most often by financial support that do are largely advocacy-based with few resources to offer members (Hin
and other unpaid support. But vendors also forge ties with formal and felaar et al., 2020).
5
S. Giroux et al.                                                                                                                        Food Policy xxx (xxxx) xxx

                                                           Fig. 2. Main barriers food vendors face.

                   Fig. 3. Proportion of vendors who receive various types of support, and the person or institution providing that support.

who source from unique suppliers who only supply that particular                   traditional market, as well as a range of other types of suppliers,
vendor, and some who only sell food that they grow themselves.                     including some of the shops or wholesalers and certain gardens or farms.
                                                                                   We can see that it is not only vendors who are physically close to the
                                                                                   traditional market who use it as a supplier, and some vendors travel a
4.4. Spatial dynamics of vendors and suppliers                                     significant distance to source at multiple locations, such as at both the
                                                                                   traditional market and another farm or garden.
    We take a subset of suppliers for whom we were able to capture                     Given the above figure and the high rate of use of the traditional
geographic location (latitude/longitude), and explicitly map those along           market as a supplier, we then focus specifically on that market and test
with vendors’ locations to show the extent to which vendors move across            whether there are hot (cold) spots in terms of vendor usage of the
the landscape to source their supplies (Fig. 6). While this is only a subset       traditional, open-air market in central Mumbwa. A hot spot of vendors
of suppliers, because we were not able to gather GPS locations for all             sourcing from the traditional open-air market will feature a cluster of
suppliers, it does include the most frequently used supplier, the

                                                                               6
S. Giroux et al. Food Policy xxx (xxxx) xxx
Fig. 4. Types of suppliers used by vendors. Vendors use more than one type of supplier so categories sum to more than 100%. Notes on categories of suppliers: In
addition to the main, open-air traditional market, vendors also referred to the old market in town as a supply location (“Formal market in town”). Vendors named
specific wholesale or shops in town, or said generally that they sought supplies at shops in town (“Wholesaler or shop in town”). Likewise, vendors sometimes noted
farms specifically by name or individuals who owned the farm or garden (“Named gardens or farms”), but other times would only say more generally that they
sourced from “multiple farmers in town,” without specifically naming any of them (“Other farmers in town”).
vendors that source from the market. When the cluster of vendor re 6.1 household members on average, with a dependency ratio of 1.27,
sponses are substantially different from those of the global population, a which represents 1.27 dependent (below 15 years old or over 65 years
statistically significant value is observed. This analysis uses Fixed Dis old) household members to working age members. Out-cluster house
tance Band to conceptualize the spatial relationship. holds are made up of 5.43 household members, and have a significantly
To more clearly illustrate our findings, we combine the hot (cold) different dependency ratio of 0.96.
spots of 95% and 99% into one category: >95%. We find evidence of Perhaps most important, we find the two clusters have statistically
spatial patterning in vendor usage of certain suppliers in two notable significant differences in their food accessibility, which is an aspect of
clusters of vendors (Fig. 7). Toward the southwest of Mumbwa, we food security, based on values derived from a simplified version of the
identify a collection of hot spot values representing 28 vendors that Household Food Insecurity Access Scale (HFIAS). The United States
source from the traditional, open-air market in central Mumbwa. To the Agency for International Development developed HFIAS to quantify
southeast of the first grouping, we find a grouping of cold spot values. experiences related to food inaccessibility by households (Coates et al.,
This grouping comprises vendors that source from nearby gardens 2007). HFIAS is a measure of limited economic accessibility and
located to the south and the east of their location (not indicated in the household consumption, rather than a measure of physical accessibility
figure). The hot spot is located in a more densely populated area of the to food retailers. The metric is a composite score typically comprising
city, with little space for growing crops, and this may help explain why nine questions, with each answer having an assigned value based on the
the vendors in this area tend to use the main market for the supplier. severity of the experience. Because the questions pertain to negative
This is in contrast to the cold spot, which is less densely populated and is outcomes (i.e. lack of food access), lower values represent better food
near large gardens that vendors can use to source food to sell. access, while higher values represent poor food access. We opted to use a
simplified version of HFIAS with five questions after consultation with
local research assistants, who felt a concise battery of questions would
4.5. Spatial dynamics of households
provide a more culturally appropriate measure. For this simplified
version of HFIAS, values can range from 0 (better food access) to 15
To identify spatial patterns of urban food accessibility, we use the
(worse food access). Households inside the cluster have average HFIAS
Kulldorff spatial scan statistic to investigate whether there are clusters of
values of 7.7, while households outside the cluster have HFIAS values of
households with higher (lower) than average number of visits to
4.5, on average. Substantively, these values indicate households inside
informal vendors during a 14-day period. The method uses 999 per
the cluster have lower food accessibility compared to households
mutations to identify clusters. Clusters identified by the Kulldorff spatial
outside of the cluster. Because HFIAS is a way to measure challenges and
scan statistic are not found during the same permutation. Each permu
responses related to food accessibility (limited portion size, skipping
tation is conducted under a differently sized circular window. Our
meals, etc.), households can both receive a HFIAS score indicating low
spatial analysis of household purchasing behavior in Mumbwa indicates
food accessibility and possess physical access to food suppliers. How
one cluster of households reporting statistically significantly higher than
ever, physical access to food suppliers does not mean the households
average number of visits to informal vendors in a 14-day period (p <
possess the financial resources required to purchase food from those
0.05; Fig. 8).
suppliers.
The statistically significant cluster comprises 17 households located
With regard to food accessibility and the local food system, we find
to the southwest of the geographic center of the city. We find substantial
households within the identified cluster visit street vendors approxi
and significant differences between the mean values of multiple
mately 11.5 times during a 14-day period, on average. Households
household characteristics between households within and outside of the
outside this cluster visit street vendors significantly less often.
identified cluster (Table 1). On average, in-cluster households consist of
7S. Giroux et al. Food Policy xxx (xxxx) xxx
Fig. 5. Vendor and supplier linkages. Nodes are not in any geographic relation to each other in this figure.
Households within the cluster also visit traditional, open-air markets 5. Policy implications
and small grocers significantly more often than households outside of
the cluster. On average, in-cluster households visit the market and shops Vendors in this emerging city serve as linkages at multiple points in
about seven times in the 14-day period, while out of cluster households the economic system of the city, but more importantly, they function as
typically visit the market and small grocers five times during a 14-day key nodes in the food system. Spatial factors related to their role as
period. This suggests that households outside of the cluster have the linking agents are also key for food systems planning. Vendors not only
financial resources to make larger food purchases less often, while utilize multiple food suppliers for their businesses, but a majority also
households inside the cluster do not have the same resources. As a result, draw financial and instrumental support from banking institutions (both
they have to make purchases more frequently to meet their food needs. formal and informal) and other individuals. A proportion of vendors also
Households located in the cluster also exhibit different food purchasing employ local residents. However, vendors’ positions in Mumbwa are
behaviors compared to those outside the cluster. Food cost per capita per tenuous, given the lack of access to loans and legal recognition or pro
month is K50 (about $3.80 at time of survey) less for in-cluster house tection, including the ever-present possibility for repression. In addition,
holds, which also have fewer assets. many vendors are in effect spatially hamstrung: they locate their busi
Finally, we direct attention to the overlap between the cluster in nesses close to their homes for reasons of convenience and other obli
Fig. 8 and the hot spot in Fig. 7. In this area of the city, residents (Fig. 8) gations, yet not having enough customers is the primary problem they
rely on frequent food purchases (often daily or every other day). Ven face.
dors that operate there are the primary source for fresh produce (Fig. 7), As links in the food system, vendors expand the footprint of the urban
which is sourced from the traditional market, hence the hot spots rep food system, moving food into residential areas. Food that grows on
resenting vendors. In this part of the city, there is no wholesale market, local farms, or that is brought to the main market for sale, is purchased
like the one in the city center. Without street vendors operating there, by vendors who then facilitate outward distribution toward the city’s
residents would have to travel to the main market. The overlap of these margins. Importantly, vendors serve consumers who may not otherwise
two clusters then also illustrates how vendors are important actors in the be able to travel to the main node of the food system (in many cases the
food system, particularly in this area, because they offer affordable food formal open-air market) or to the outer extent of the food system
options in affordable quantities. (farmers on the periphery): households’ use of informal vendors does
exhibit spatial patterning and reflects the spatial context of poverty.
Vendors also promote cross-scale linkages from local to global food
8S. Giroux et al. Food Policy xxx (xxxx) xxx
Fig. 6. Vendors’ usage of and positions relative to 21 particular suppliers. The line that extends southeast off the map goes to the Soweto Market in Lusaka.
systems. Vendors’ ties with farms, the local market, and small shops growth. For vendors in particular, local government approaches to
facilitate food movement at a local to regional scale, while engagement organize or regulate vendors may be more effective if targeted at groups
with national chains (e.g., Zambeef) and selling processed food products of vendors, rather than a one-size fits all, food system-wide approach.
purchased in stores link to national and global scales. For example, in Liberia, street traders organized to negotiate a Memo
A significant portion of the food system in growing urban areas in randum of Understanding with the mayor of the capital city of Monrovia
Africa is informal and is integrated with the more formal food system - in 2018, which intends to regularize street vending and allow traders to
but not from a policy perspective. Spatial analyses such as those in this operate in certain parts of the city without harassment if the traders
paper would not support proposals that, for example, lump informal adhere to a set of stipulations. There are strict penalties if either side
food vendors in with other informal commodity sellers and place them in reneges on the agreement, and both the traders and the mayor are
a single market location, or take informal food vendors alone as a group required to meet monthly to ensure an open dialogue about any chal
and relocate them. Such actions would likely leave many households less lenges or unforeseen issues (Reed and Bird, 2019). While government
food secure, because they ignore the spatial aspects of food distribution officials in Mumbwa must adhere to laws around street vending, there
and access, removing important nodes that are heavily relied upon by could be room for such local negotiations among parties at the city level.
low-income and less food secure households. Assessing and working with spatial aspects of food distribution and
Secondary and smaller cities in particular can take advantage of access could help ensure economic viability of vendors’ and suppliers’
planning opportunities for urbanization and urban food system gover livelihoods and help ensure access to food by the poorest households.
nance, which can in turn bolster efforts toward inclusive growth and Where cities are able, they might take advantage of the social and eco
poverty reduction. For example, smaller cities have more possible entry nomic web already constructed by informal vendors and consumers as a
points to plan for infrastructure, and they may serve as first stops for way to think about integrated growth planning and citizen provisioning.
rural, often poorer, migrants, providing pathways out of rural poverty They might take advantage of these linkages and the market opportu
(Christiaensen et al., 2013; Richards et al., 2016; Shifa and Borel- nities that will come with increased urbanization to help harness the
Saladin, 2018). Such cities should not look to larger primary cities as power that local farmers, vendors, small shops, and markets have to
models in planning because the nature of the issues they face, in work together to create a food system that benefits all these micro- and
conjunction with their levels of urbanization and growth, are different. smaller enterprises while ensuring food security for households. When
Creating appropriate food systems for secondary and smaller cities will supermarkets enter local food systems, so much of this power is lost
likely require flexible planning, utilizing context-specific approaches (Steel, 2012). For example, researchers have documented how poorly
that are multi-faceted. While informal vendors can be well networked, supermarkets tend to integrate local farmers into their supply chains
for many, the business model remains one of convenience, and there is a (Battersby et al., 2016; Michelson, 2013), and there is evidence that
lack of robust markets required to sustain them all. More direct supermarkets in other urban contexts in SSA are not improving food
involvement of informal vendors in planning will be difficult, yet would security as some have promised (Skinner and Haysom, 2016). This is not
help to improve efficiency in terms of the number and spatial distribu to say that a purely local food system is a good goal for cities in SSA
tion of sellers and help develop a food system that is more amenable to (Born and Purcell, 2006), or that the networks of informal vendors will
9S. Giroux et al. Food Policy xxx (xxxx) xxx
Fig. 7. Distribution of hot (cold) spots of street vendors that source from the main market in Mumbwa, Zambia.
be the main driver in developing sustainable food systems (Meagher, described earlier in the paper. Such patchworks of regulations around
2005, 2006). But smaller cities in SSA have assets at hand, and many are street food vending have been noted in other countries in SSA, such as
already doing some of the things advocated by the emerging new food Ghana (FAO, 2016a).
geography, such as fostering shorter supply chains and a diversified food Second, a common policy employed to deal with vendors is to either
supply (Viljoen and Wiskerke, 2012), both of which are facilitated by relocate them in established markets away from congested streets and
informal vendors. With appropriate support from state institutions, central business districts or designate certain streets in which they may
these cities can leverage informal vendors to help forge and strengthen operate (Skinner and Haysom, 2016). When not designed with the input
links within the food system at multiple levels, setting cities up to create of vendors, examples from around the Global South illustrate how these
the food systems they want and engage with the global system of food policies often fail because vendors revert back to the streets to find
production, distribution, and consumption on their own terms. customers or to be closer to suppliers (e.g. Anjara, 2016; Bhowmik,
Making any of these planning options more viable requires redress 2010; Steel et al., 2014). A more sophisticated understanding of how
ing existing policymaking biases towards informal food vendors in space and location affects food access and business networks, such as
Zambia and elsewhere in SSA. First, vendors tend to lack an institutional that provided in this paper, is therefore needed by local governments
partner with whom to negotiate their rights and responsibilities, face and urban planners before embarking on such campaigns.
confusing regulatory environments, and are often used as political Finally, informal vendors are often treated by policymakers as a li
pawns in election years. For instance, in 1992, the Statutory Instrument ability, but they can play a crucial role in the food system in times of
No. 134, known as the Local Government Street Vending and Nuisances crises. During the COVID-19 pandemic, many vendors, including those
Regulations, stipulated that it was illegal to sell produce in any place in Zambia, were initially cleared from the street and forced to shut
other than a designated market and to purchase food from street vendors down. This is problematic because for many vendors this is their only
(Munkoyo, 2015). In 2007, as part of the then-government’s “Keep livelihood and for many consumers, particularly the most food insecure,
Zambia Clean and Healthy” campaign, the Ministry of Local Govern this is their only source of food. This is also unfortunate since vendors
ment amended these regulations (Street Vending and Nuisances Act can play a role in moving food around the city safely in the context of a
Amendment of 2007) to increase fines for those trading in unauthorized pandemic: because of the extent of their spatial footprint, vendors are
places (GRZ, 2007). In the wake of a cholera outbreak in 2018 that was able to transport food to peri-urban areas without contributing to dense
traced to informal food retailers, the government also issued Statutory consumer interaction. Notwithstanding the complexity of land use and
Instrument No. 10, which updated the fines for contravening any of 55 property rights laws in urban Africa, it would be useful to have a food
potential restrictions, including working as a hawker in the same area distribution system that is set up to serve a broad range of citizens in a
for more than five days in a calendar month, selling food in any street or city, and is spatially dispersed so that there are few or no retail nodes
public place besides a market, and failing to provide adequate clean and that become overwhelmed (Institute for Poverty, Land and Agrarian
safe water on one’s business premises (GRZ, 2018). These instruments Studies, 2020). That means leveraging and supporting informal food
are in addition to regulations around public health and foodstuffs vendors and viewing them as a means for improving food access and
10S. Giroux et al. Food Policy xxx (xxxx) xxx
Fig. 8. Cluster identification of households that purchase significantly more time during a 14-day period from informal vendors.
food systems across scales.
Table 1
Comparison of descriptive statistics of in-cluster and out-cluster households.
6. Conclusion
Households Households Statistical
inside cluster outside cluster significance of
Small scale vendors are crucial cogs in local to global food systems in
(N = 17) (N = 119) difference
between means emerging African cities, facilitating cross-scale food transfers. They
Variable Mean SD Mean SD expand the existing footprint of the food system to peri-urban house
HFIAS (0 = better food 7.7 2.6 4.5 3.7 *** holds and poorer households who are forced to purchase food frequently
access) and in small quantities. Vendors are heterogeneous in terms of their
Assets 0.9 0.7 1.6 1.7 spatial dispersion and business models, selling a range of products,
Household Members 6.1 2.5 5.4 2.4 sourcing from varying locations, and serving different types of con
Dependency Ratio 1.3 0.9 1.0 0.8 *
Food Expenditures per 158.3 136.1 208.3 169.8
sumers. They are often treated as a monolith and ignored in the policy
Capita per Month making process, despite the valuable role they play in the food system.
(Zambian Kwacha) They provide complementary services to the emerging supermarket
***
Number of times in the 11.6 4.7 5.0 5.4 trends across SSA and elsewhere, and should be viewed as assets rather
past 14 days the
than hindrances to food security.
household purchased
from a roadside food
retailer CRediT authorship contribution statement
**
Number of times in the 7.8 5.7 5.2 4.9
past 14 days the Stacey Giroux: Conceptualization, Methodology, Formal analysis,
household purchased
Investigation, Writing - original draft, Writing - review & editing,
from an open-air
market Visualization, Project administration, Funding acquisition. Jordan
Number of times in the 7.3 5.7 4.7 4.6 **
Blekking: Conceptualization, Methodology, Formal analysis, Investi
past 14 days the gation, Writing - original draft, Writing - review & editing, Visualization,
household purchased
Project administration. Kurt Waldman: Conceptualization, Methodol
from a small grocer
ogy, Investigation, Writing - original draft, Writing - review & editing,
*You can also read