Flooding in Norway under a near - future 2021-2050 climate: Rainfall vs.

Page created by Richard Osborne
 
CONTINUE READING
Flooding in Norway under a near - future 2021-2050 climate: Rainfall vs.
Flooding in Norway under a near
future 2021-2050 climate: Rainfall vs.
snowmelt floods and their uncertainties

     Deborah Lawrence1, Torill Engen-Skaugen2,
     Lars Roald1, Gusong Ruan1, Stein Beldring1

 1Norwegian Water Resources and Energy Directorate (NVE)
       2 Norwegian Meteorological Institute (met.no)
Flooding in Norway under a near - future 2021-2050 climate: Rainfall vs.
Climate change impacts on flooding
and their uncertainties
   Demand for information regarding climate change
    impacts on flood frequency for use in adaptation
    (dam safety, transport, areal planning)

   Differing climate scenarios, models and methods can
    produce dissimilar results: How can these be
    summarised and used in practical applications?
⇒ Ensemble methodology for analysing hydrological
    projections and their uncertainties
Flooding in Norway under a near - future 2021-2050 climate: Rainfall vs.
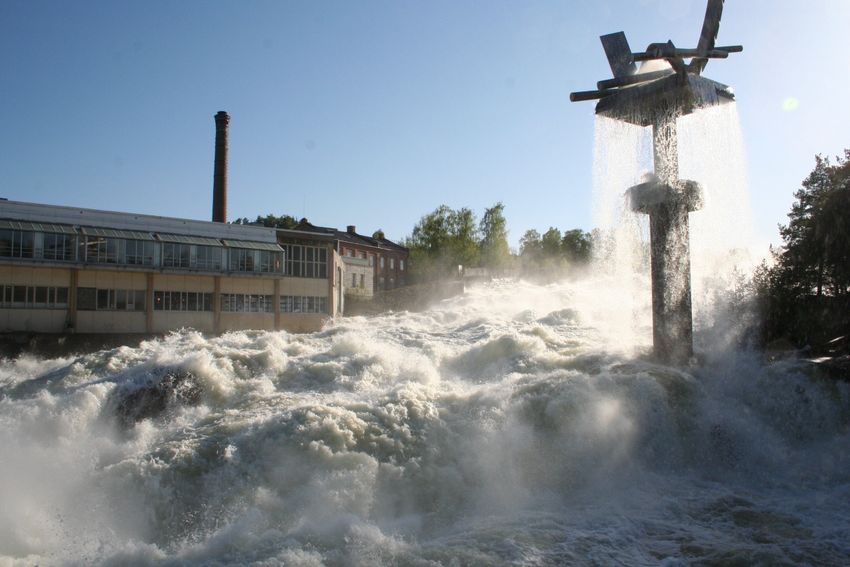
Some factors contributing to flooding in Norway
which are likely to be impacted by climate change:
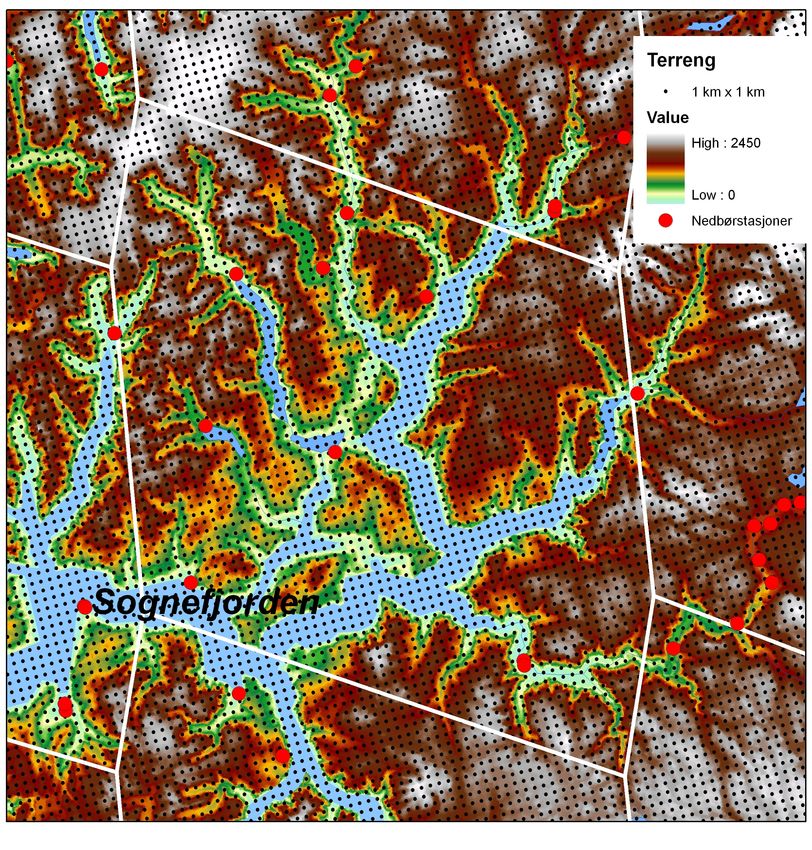
                                     Runoff from rainfall
                                     and/or snowmelt

                                                              Hønefossen, May, 2008; Photo:NVE

                                             Intense precipitation
                                             in localised areas

  Manndalen, May, 2010; Photo: NVE

      Excess rainfall in areas with
      limited infiltration

                                                                                 Photo: NVE
Flooding in Norway under a near - future 2021-2050 climate: Rainfall vs.
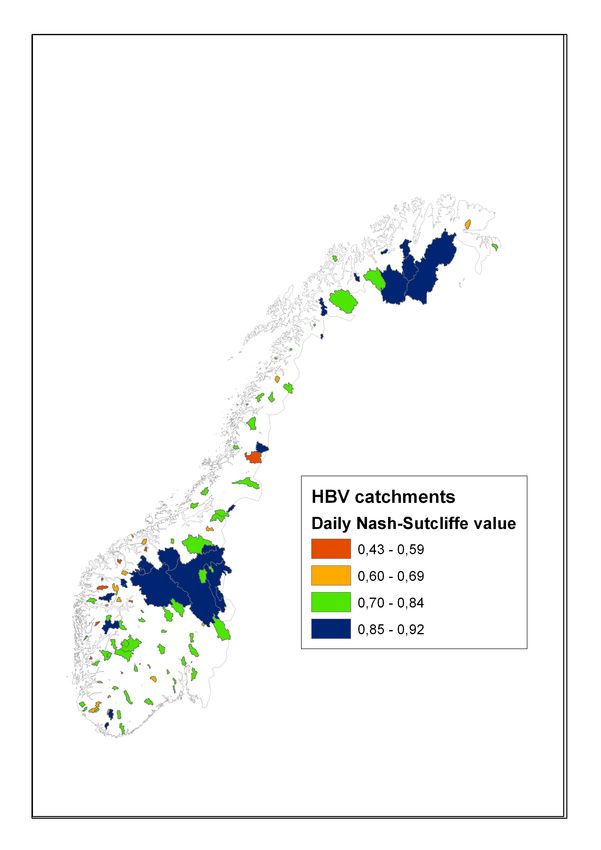
Modelling chain for hydrological
       impact projections
SRES Emission scenario

   Global climate model

      Regional climate model

             Adjustment of P,T to local 1 x1 km grid

                Hydrological models

                      Flood frequency estimation
Flooding in Norway under a near - future 2021-2050 climate: Rainfall vs.
140
           140
           120

mm/måned
           120
mm/måned
           100
           100
            80
            80
            60
            60
            40
            20
             00
                   jan feb
                  jan   feb mar
                            mar apr
                                apr mai
                                    mai jun
                                         jun jul
                                              jul aug sep
                                                      sep okt
                                                          okt nov des
                            55550 Hafslo
                      55550 Hafslo  54130 Lærdal
Flooding in Norway under a near - future 2021-2050 climate: Rainfall vs.
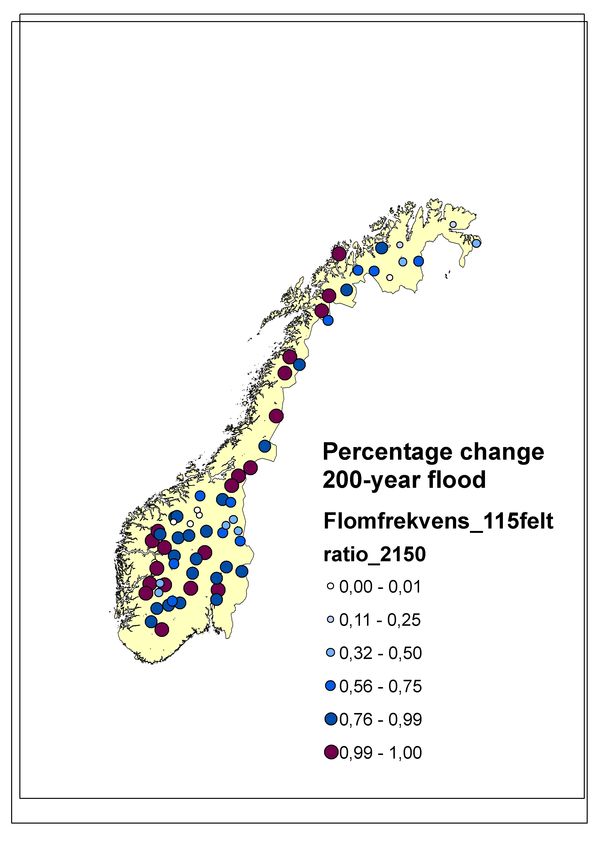
Ensemble approach for probabilistic
   hydrological projections
3 GCM/RCMs (with SRES A1B emissions)
Echam5/HIRHAM5
BCM/RCA3
HadCM3Qref/HIRHAM

2 Methods for transferring RCM output
to 1 x 1 km grid
Delta change
Empirical adjustment method (met.no)

25 calibrated hydrological models
 for 115 catchments

Flood frequency analysis for
200-year flood
                                        Catchment areas
                                        from 3 to 15,000 km2
⇒ Construct pdfs from
150 results for each catchment
Flooding in Norway under a near - future 2021-2050 climate: Rainfall vs.
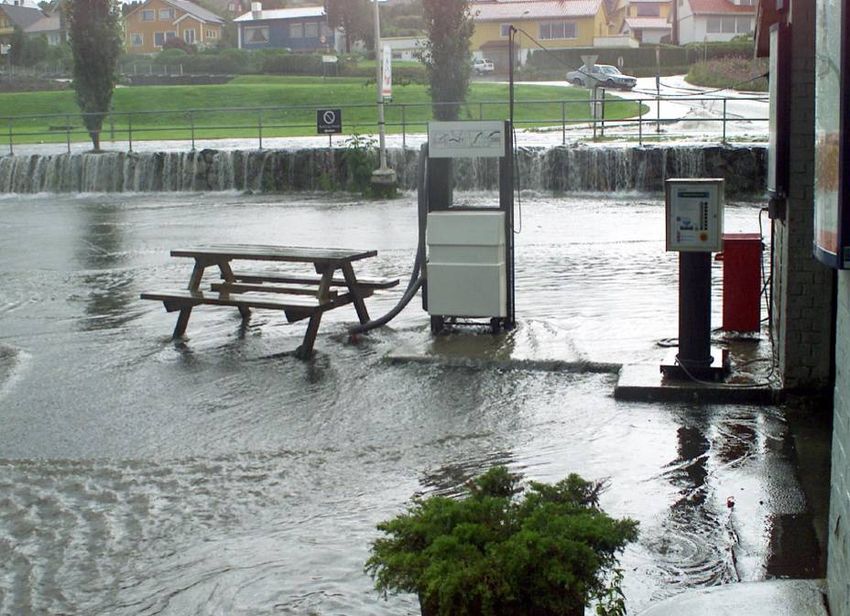
Flood frequency estimation applied
to annual maximum flood series
                                                        Viksvatn (Hestadfjord) - 83.2
                                                 IS92a ECHAM4/OPYC3 NorClim/HIRHAM 25x25 km
                                                           'Empirical Adjustment' to 1 x 1 km
                              900
                              850           1981-2010 GEV from annual max series
                              800
                                            2021-2050 GEV from annual max series
Peak daily discharge (m3/s)

                              750
                              700           2021 - 2050 Annual maximum series
                              650           1981 - 2010 Annual maximum series
                              600                                                                      % change in
                              550       2021-2050
                                        30-year flood
                                                                                                       200-year
                              500
                              450
                                                                                                       flood
                              400
                              350                                  X               X
                              300
                              250
                              200
                              150                                                                  1981-2010
                              100                                                                  200-year flood
                                    1                    10                  100                1000
                                                          Return period (years)
Flooding in Norway under a near - future 2021-2050 climate: Rainfall vs.
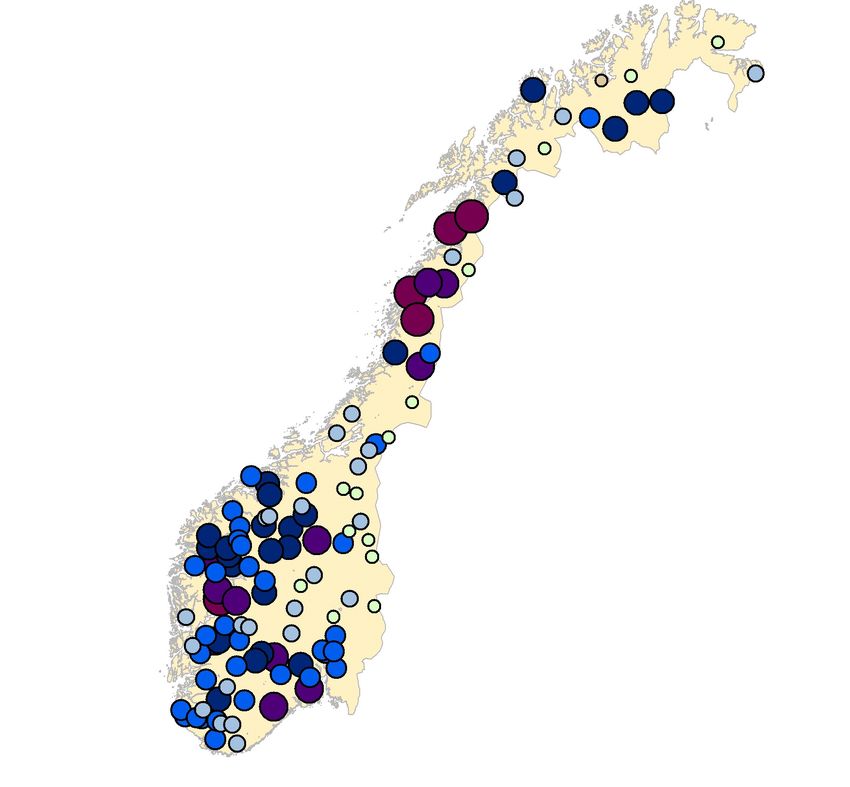
Projected change in 200-yr. flood
between 1961-1990 and 2021-2050
  Median of                 90th percentile
  150 models                of 150 models

               Change (%)                     Change (%)
Flooding in Norway under a near - future 2021-2050 climate: Rainfall vs.
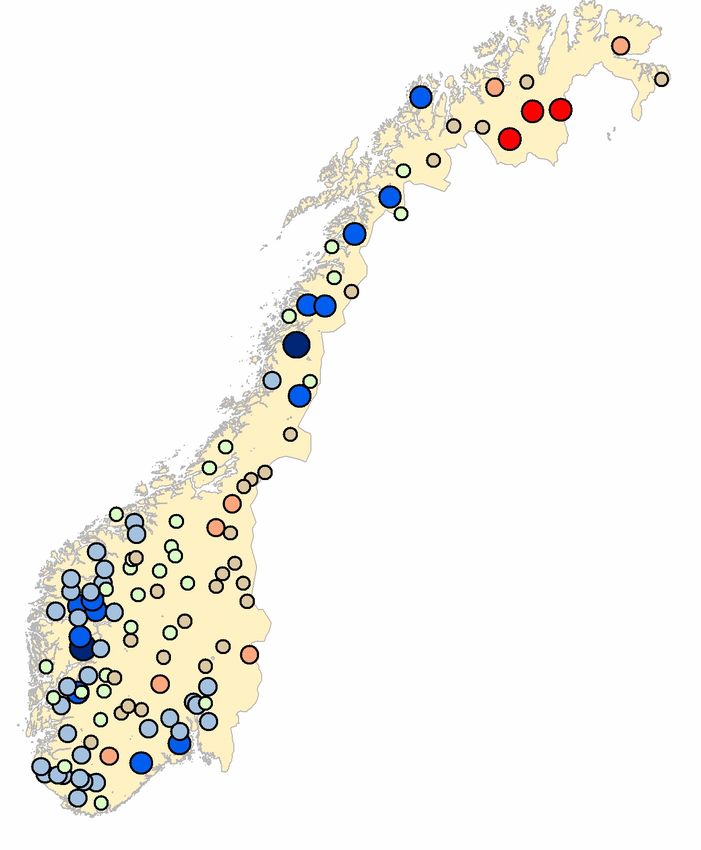
Range of uncertainty in projections
 Median of                 Range
 150 models                10 to 90%

              Change (%)               Range (%)
Flooding in Norway under a near - future 2021-2050 climate: Rainfall vs.
Uncertainty – Relative magnitude of
                                   sampled         sources
                                      Downscaling method

                               100
Percentage below given value
                                90                                      Delta change
                                80
                                70                                      Empirical adjustment
                                60
                                50
                                40
                                30
                                20
                                                                                                Uncertainty source
                                10
                                 0                                                              with largest magnitude:
                                     15         17       19          21         23         25
                                                 Mean annual peak runoff (mm/day)                  GCM/RCM
                                          Percentage change in 200-year flood
                                                                                                   EA/DC
                               • Differences in GCM/RCM                                            HBV parameter
                                 tend to be more significant
                                 in inland and northern areas                                   N = 115
                                                                                                GCM/RCM = 50
                               • Western Norway dominated                                       EA/DC = 38
                                                                                                HBV = 27
                                 by uncertainty from HBV
                                 and methods for adjusting
                                 P, T
Uncertainty from flood frequency
                              analysis relative to model uncertainty
                                                       Viksvatn - 83.2
                                              A1B HadCM3Qref/HIRHAM (25 x 25 km)
                                                   'Empirical Adjustment' til 1 x 1 km
                              900
                              850       1961-1990 Gumbel
                              800
                                        2021-2050 Gumbel
Peak daily discharge (m3/s)

                              750
                              700       2021 - 2050 annual maxima
                              650       1961 - 1990 annual maxima                           Model uncertainty
                              600
                              550
                              500
                                                                                 X
                              450
                              400
                              350                                                X
                              300
                              250                                                                 35% increase
                              200                                                                  in 200-year
                              150                                                                      flood
                              100
                                    1               10                    100            1000
                                                      Return period (years)
Seasonal analysis - Rainfall-induced
peak flows in annual maximum series

             Red – Type 1: > 67% of annual
             maximum in mar-july (snowmelt
             dominance)
             Green – Type 2: 34 – 66%
             (transitional)
             Blue – Type 3: < 33%
             (rainfall dominance)

         1961 - 1990                         2021-2050

  ⇒ Change towards increasing occurrence of
  autumn/winter peak flows in annual series
Relative magnitude of rainfall-
induced peak flows in annual series

          Ratio of Max (Aug – Feb)
                  Max (all months)

     1961 - 1990                     2021-2050

⇒Largest peak flow in some ’snowmelt’ areas
is actually an autumn/winter rainfall flood
Projected increase in probable
maximum precipitation (PMP)

Median of
three scenarios
                  Percentage change
                  in PMP between
                  1961-1990 and 2021-2050
Further comments
 •Ensemble approach is an effective method for
      summarising hydrological projections and the
      relative contributions of uncertainty sources
•Only ’sampled’ uncertainties are represented, and
       other factors should not be disregarded

Implications for dam safety analyses in Norway:
•Flood frequency analysis indicates regions of
       increase vs. reduction in low frequency events
•Change of seasonality can have implications for the
       season considered in the flood calculations
•PMP is projected to increase in all regions, so that
       PMF estimated with event-based modelling
       can be expected to increase
You can also read