FIVE IN A ROW UA Take: Edmonton - Q2 2021 - Urban Analytics
←
→
Page content transcription
If your browser does not render page correctly, please read the page content below

Q2 2021

   UA Take: Edmonton

FIVE IN A ROW
Q2-2021 UA TAKE EDMONTON: FIVE IN A ROW

  An impressive 450 sales were recorded in Edmonton in the second quarter of 2021. This
  represents a 17 percent sales increase from last quarter and is now the fifth consecutive
  quarter the market has experienced a quarterly increase. The 450 sales recorded in the
  second quarter of the year was the third highest quarterly total of new multi-family units in
  Edmonton since UA began tracking this market. While the Southwest has historically been the
  most active submarket in the city, the Southeast, Northeast, and Northwest submarkets also
  recorded substantial quarterly increases, all rising by over 40 percent. The new home market
  in Edmonton has experienced a 62 percent year-over-year increase in sales. Continued
  strong sales has resulted in a reduction in released and unsold inventory and presents an
  interesting opportunity for developers to bring new product online in the communities that
  have experienced high levels of demand. As social restrictions lift it appears as though the DIY
  boom, which played a role in the exponential increase in lumber prices, is showing signs of
  slowing which should help stabilize construction costs. This should allow builders to more
  accurately estimate future costs and hopefully allow them to bring additional supply to the
  market. Currently there are only 3.6 months of inventory in the new multi-family sector of
  Edmonton’s residential market which provides evidence to the need for additional supply
  moving forward.

  Some key statistics and observations from UA’s Q2-2021 review of the new multi-family home
  sector of the Edmonton Market include:

  • Both wood frame condominium and townhome product types recorded quarterly sales
    increases, rising by 126 percent and 10 percent, respectively.

  • Quarterly sales increased were recorded in the Southeast, Northeast, and Northwest
    submarkets – rising by 56, 47, and 46 percent, respectively.

  • The total number of actively selling projects in the market (83) decreased for the eighth
    consecutive quarter. Total released and unsold inventory decreased by 26 percent
    compared to the previous quarter.

  • Standing inventory decreased by 10 percent (69 units) compared to the previous quarter.

  • 55 percent of all released and available inventory are move in ready, although the majority
    of these move-in ready units (48 percent) belong to an equal proportion of both wood
    frame and concrete condominiums.

  • The average unit price all new home product in Edmonton has increased by nine percent on
    a year-over-year basis.

 Q2-2021 UA TAKE EDMONTON: FIVE IN A ROW                                                             2
FIFTH CONSECUTIVE QUARTERLY SALES INCREASE
450 new multi-family sales were recorded in Edmonton in the second quarter of the year
which represents a 17 percent increase compared to Q1-2021. The increase in demand is
attributed to the continued release of pent-up demand and favorable interest rates. A
large proportion of the sales generated in the second quarter came from first-time home
buyers. This marks the fifth consecutive quarter of sales increases, with total unit
absorptions up by 62 percent compared to Q2-2020.
QUARTERLY UNIT SALES COMPARISON
583
497
450
440
439
427
418
415
385
359
356
352
330
323
308
293
282
277
196
Q4-2016 Q2-2017 Q4-2017 Q2-2018 Q4-2018 Q2-2019 Q4-2019 Q2-2020 Q4-2020 Q2-2021
Chart 1
QUARTERLY SALES BY PRODUCT-TYPE
Both wood frame condominium and townhome product types experienced an increase in
sales compared to the previous quarter, rising by 126 percent and 10 percent,
respectively. Townhome sales continued to surge and accounted for over 81 percent of
total new home sales in the second quarter. All product types have increased in total
sales compared to the same quarter of 2020 with concrete condominium, wood frame
condominium and townhome sales increasing by 17, 13, and 80 percent, respectively.
Q2-2021 UA TAKE EDMONTON: FIVE IN A ROW 3400 EDMONTON SALES BY PRODUCT TYPE 366
350
300
250
200
150
100 77
50
7
0
Q4-2016 Q2-2017 Q4-2017 Q2-2018 Q4-2018 Q2-2019 Q4-2019 Q2-2020 Q4-2020 Q2-2021
Chart 2 Concrete Wood Frame Townhomes
SOUTHWEST AND SOUTHEAST SUB-MARKET LEADS SALES IN Q1
The Southwest sub-market continued to lead the market in quarterly sales, recording a total of
174 sales in the second quarter. This figure represents 39 percent of overall sales for the
quarter. Collectively, the Southwest and Southeast sub-markets accounted for 67 percent of
total sales in the second quarter. The Southeast experienced the largest increase in quarterly
sales, up 56 percent compared to Q1-2021. Sales representatives noted that traffic has
consisted primarily of recent immigrant couples and families who were previously renting in
the area and due to the favorable interest rates have been able to purchase a home. The next
two largest quarterly sales increases occurred in the Northeast and Northwest submarkets
which rose by 47 and 46 percent, respectively.
QUARTERLY SALES BY SUB-MARKET COMPARISON
182
174
128
96
87
82
75
54
51
45
18
37
29
9
8
7
7
7
6
5
5
Downtown Northwest Northeast Southwest Southeast St. Albert Sherwood Park
Chart 3 Q2-2020 Q1-2021 Q2-2021
Q2-2021 UA TAKE EDMONTON: FIVE IN A ROW 4QUARTERLY SALES BY AGGREGATE AREA
700
600
500 302
400
300
200 129
100 12
0 7
Q4-2016 Q2-2017 Q4-2017 Q2-2018 Q4-2018 Q2-2019 Q4-2019 Q2-2020 Q4-2020 Q2-2021
Chart 4 Downtown St. Albert & SP North South
DECREASE IN RELEASED INVENTORY
The new multi-family home sector of Edmonton’s residential market recorded a 26 percent
decrease in released and unsold inventory in the first quarter of 2021 compared to the
previous quarter, and a 46 percent decrease on a year-over-year basis. All submarkets in
Edmonton, not withstanding St. Albert and Sherwood Park experienced a decreased in unsold
inventory as a limited number of new projects were launched during the second quarter. The
continued demand and lower inventory levels present developers with an opportunity to
launch new projects in successful submarkets such as the Southwest, Southeast and
Northwest. There are currently 1,181 total units available for purchase in the city, which
equates to 3.6 months of inventory with the current pace of sales in the market. The highest
inventory total exists in the Southwest submarket, which currently has 416 released and
unsold units.
RELEASED & UNSOLD INVENTORY BY SUB-MARKET
773
557
484
416
346
294
112
259
102
248
227
218
87
80
204
73
180
62
49
46
149
Downtown Northwest Northeast Southwest Southeast St. Albert Sherwood Park
Chart 5 Q2-2020 Q1-2021 Q2-2021
Q2-2021 UA TAKE EDMONTON: FIVE IN A ROW 5SLIGHT DECREASE IN STANDING INVENTORY
STANDING INVENTORY
1,012
952
918
910
901
843
812
761
738
730
728
723
721
707
687
652
621
592
Q4-2016 Q2-2017 Q4-2017 Q2-2018 577 Q4-2018 Q2-2019 Q4-2019 Q2-2020 Q4-2020 Q2-2021
Chart 6
The number of completed and unsold (i.e. move-in ready) units decreased by 10 percent during
the second quarter of the year and currently totals 652 units. This represents a 23 percent drop in
completed and unsold units since the second quarter of 2020. The reduction in completed and
available units comes amidst a surge in lumber prices due to a shortage of other construction
materials which has driven up prices of new homes. Despite this market shock developers have
continued to complete units which supplements the demand for urgent buyers.
There were 268 wood frame condominiums, 301 concrete condominiums and 83 townhomes that
were unsold and available for immediate possession at the end of the second quarter. Low levels
of townhome standing inventory is reflective of the continued demand for this housing type in the
market. Almost all the actively selling wood frame and concrete condominium projects were
completed prior to 2020.
ACTIVELY SELLING PROJECTS BY PRODUCT TYPE
136 132 132
127 131
122
114 117 113
107 111
105 105
97 100
91 88 86
74
83
72
71
74
66
63
57
54
72
53
53
70
48
64
62
63
63
61
60
41
38
41
39
36
39
37
37
37
36
35
28
26
25
23
12 16
11 14
11 14
9 14
22
22
21
21
20
20
20
20
17
17
17
16
16
15
14
Q4-2016 Q2-2017 Q4-2017 Q2-2018 Q4-2018 Q2-2019 Q4-2019 Q2-2020 Q4-2020 Q2-2021
Chart 7 Concrete Wood Frame Townhomes
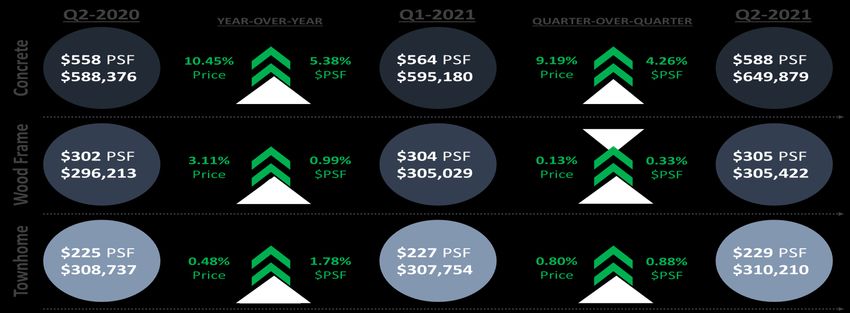
Q2-2021 UA TAKE EDMONTON: FIVE IN A ROW 6PRICING TRENDS
• The average unit price for concrete condominiums increased by 9.2 percent
compared to the previous quarter to $649,879. This price influenced somewhat by
St. Albert which is averaging $799,680 for concrete condominium product.
• The average unit price for wood frame condominiums increased by 0.13 percent
compared to the previous quarter and is up 3.1 percent compared to Q2-2020.
• Townhome prices have remained relatively flat on a quarterly and yearly basis, and it
was noted by sales representatives that prices have not been increased in order to
attract entry level home buyers.
BUYER TRENDS
There was a mix of active buyer groups in Edmonton’s new multi-family home market
throughout the second quarter of 2021. These groups included entry level buyers, young
professionals, downsizers, and recent immigrant families. The majority of purchasers this
quarter comprised of entry level and downsizer buyers, as most of the product being
absorbed targeted younger purchasers looking to start a family. Much of the townhome
product also appeals to empty nesters looking to downsize from a larger detached home
and are not yet ready for condominium living. Demand also continues to be driven by
historically low interest rates currently being offered. Many sales representatives
indicated traffic at presentation centres remained steady during the second quarter of
2021.
Q2-2021 UA TAKE EDMONTON: FIVE IN A ROW 7CREATIVE INCENTIVES TRENDS Many projects withdrew incentives that were utilized throughout the pandemic, however there are still some projects which are offing some notable promotions such as: Concrete Condominiums • Up to $65,000 off on remaining first and second floor suites Wood Frame Condominiums • Up to $25,500 off purchase price • Up to $12,500 off select units • Up to $10,000 off purchase price • Up to $20,000 off purchase price Townhomes • $15,000 in upgrades on next five units sold • $5,000 design credit • $5,000 pre-sale promotion • $10,000 off with referral program • Free basement development • Front and rear landscaping • No condo fees for a year SUMMATION The new home market in Edmonton appears to be sustaining the momentum coming off the lows experienced in 2020. UA has now observed strong quarterly sales absorptions for the fifth consecutive quarter in a row. As the DIY boom is now showing signs of slowing, the price for lumber commodities has softened and should hopefully make price setting for future projects and phases easier for new home builders. UA anticipates that immigration will start to pick up and that the new home demand experienced in the Edmonton market will continue throughout the second half of the year. There is an overwhelming sense of opportunity in the city for developers to bring new product online in communities which have experienced reduced levels of available inventory. Q2-2021 UA TAKE EDMONTON: FIVE IN A ROW 8
ALBERTA STATE OF THE MARKET

 Keep an eye out for UA’s Q2-2021 edition of the ALBERTA STATE OF THE MARKET
 report, which provides an aggregate summary of the status of new home markets in
 Edmonton and Calgary, with economic metrics relevant to the housing industry.

 CLICK HERE to download the second quarter report.

Tell us what you think and what you need

 We appreciate your feedback. Please contact us with any questions regarding this UA
 Take or any of our other periodic publications. In addition to maintaining the most current
 new multi-family home and rental apartment project data on NHSLive.ca, UA provides
 advisory and consulting services that can be tailored to meet your firm’s specific needs to
 help it make better decisions. Please contact us to discuss how we can assist you in the
 design or positioning of your new multi-family home community.

                               URBAN ANALYTICS INC.
                                    (403) 294-0135
                           info-alberta@urbananalytics.ca

Q2-2021 UA TAKE EDMONTON: FIVE IN A ROW                                                        9
You can also read


