Five-Echelon Multiobjective Health Services Supply Chain Modeling under Disruption
←
→
Page content transcription
If your browser does not render page correctly, please read the page content below
Hindawi
Mathematical Problems in Engineering
Volume 2021, Article ID 5587392, 16 pages
https://doi.org/10.1155/2021/5587392

Research Article
Five-Echelon Multiobjective Health Services Supply Chain
Modeling under Disruption

 Farnaz Javadi Gargari,1 Mahjoube Sayad,1 Seyed Ali Posht Mashhadi,2
 Abdolhossein Sadrnia ,3 Arman Nedjati,3 and Tahereh Yousefi Golafshani4
 1
 Department of Industrial Engineering, Alzahra University, Tehran, Iran
 2
 Department of Industrial Engineering, Islamic Azad University, South Tehran Branch, Iran
 3
 Assistant Professor of Department of Industrial Engineering, Quchan University of Technology, P.O. Box: 94771-67335, Quchan,
 Iran
 4
 Almahdi Aluminum Co, Hormozgan Province, Bandar Abbas, Iran

 Correspondence should be addressed to Abdolhossein Sadrnia; a.sadrnia@qiet.ac.ir

 Received 18 March 2021; Revised 19 April 2021; Accepted 25 April 2021; Published 19 May 2021

 Academic Editor: Mohammad Yazdi

 Copyright © 2021 Farnaz Javadi Gargari et al. This is an open access article distributed under the Creative Commons Attribution
 License, which permits unrestricted use, distribution, and reproduction in any medium, provided the original work is
 properly cited.

 Medicine unreliability problem is taken into consideration as one of the most important issues in health supply chain man-
 agement. This research is associated with the development of a multiobjective optimization problem for the selection of suppliers
 and distributors. To achieve the purposes, the optimal quota allocation is determined with respect to disruption of suppliers in a
 five-echelon supply chain network and consideration of the distributor centers as a hub location-allocation mode. The objective of
 the optimization model is involved in simultaneous minimization of transactions costs dealing with suppliers, expected pur-
 chasing costs from suppliers, expected percentages of delayed and returned products in each distributor, as well as transportation
 cost in each echelon and fixed cost for distributor centers, and finally maximization of the expected scores for suppliers and high
 priority of product customers. The optimization problem is formulated as a mixed-integer nonlinear programming model. The
 proposed optimization model is utilized to investigate a numerical case study for asthma-specific medicines. The analyzing
 procedure is conducted based on the collected real data from Cobel Darou pharmaceutical company in 2019. Furthermore, a fuzzy
 multichoice goal programming model is considered to solve the proposed optimization model by R optimization solver. The
 numerical results confirmed the authenticity of the model.

1. Introduction reduction of the treatment costs, increment of the quality of
 health systems, patient safety, as well as improvement and
Nowadays, engineering and science advances have con- enhancement of the effectiveness, and efficiency through a
tributed to the significant reduction of incurable disease and methodology, which is called the health supply chain.
infant mortality in human societies. It occurred due to the Many researchers believe that the application of prin-
classification of the issue of health and treatment as one of ciples of management in the health supply chain, in addition
the most important multidisciplinary topics in human so- to the decrement of the cost of care and treatment, leads to
cieties. However, healthcare costs have had a rising trend, the improvement of the quality of services [2, 3]. Never-
and thus, controlling and mitigating of costs of health theless, potential disturbances have raised risks against
systems make considerable concerns in this domain [1]. supply chains [4]. Healthcare area has suffered continuous
Therefore, scholars and researchers and also governments challenges over decades [5]. To deal with this, researchers
attempt to reduce the rate of healthcare costs by monitoring and practitioners have focused on devise and imple-
these kinds of costs. The health organizations demand mentation of various practices [6]. The major challenges for

2 Mathematical Problems in Engineering

the pharmaceutical supply chain include lack of coordina- distribution of medicines and equipment in this sector. To
tion, inventory management, human resource dependency, date, studies have been done on supply chain network design
absent demand information, order management, shortage under disruptions in different areas, such as supplier se-
avoidance, warehouse management, expiration, shipment lection and order allocation [18] and blood supply chain [19]
visibility, and temperature control [7]. One of the challenges by using different quantitative approaches. Accordingly,
of this field is the disorder of medicine distribution that leads some of the studies have affected the impact of epidemic
to medicine deficiencies. Inadequate distribution and outbreaks on supply chains [20, 21]. Due to two unique
medicine and equipment deficiencies disrupt suppliers so features, the disasters caused by disease outbreaks vary from
that they cannot supply the demand for distribution centers other disasters: their long-term damage and their growing
and hospitals in time. Thereby, the overall efficiency of the spread. Failure to control such disasters will result in severe
system and responsibility reduces significantly. The origin of disruptions in supply chains and communities and will
such disorders may be either in transportation systems or in result in irreparable losses. Coronavirus 2019 (COVID-19) is
supplier centers themselves, which includes price fluctua- one of those disasters that has caused severe disease [22].
tions, demand fluctuations, equipment failure, and quality Also, careful pharmacy management has a strong effect on
failure [8]. Moreover, natural disasters, equipment failures, the capacity of a country to tackle public health issues.
terrorist attacks, labor strikes, and change in property could Pharmaceutical supply management is one of the most
be the reason for such disorders [9]. In reality, the cases that operational problems in the healthcare industries [23].
include such disorders are summarized as follows: (1) the However, as the relevant literature demonstrates, few
tragic earthquake in Bam caused severe damage to the in- studies have been carried out in the field of hierarchical
frastructure, underground, and transport systems [10], (2) localization, which considers disruption in supply centers
Hurricane Katrina (2005), which caused the destruction of within the health services networks. According to the
manufacturing and transportation equipment in the coast of mentioned cases, this paper presents a five-objective hier-
the Persian Gulf [11], (3) the earthquake in Japan (2011) that archical location for designing health services networks that
halted production in a wide range of industries due to the distribution centers are considered as a hub location-allo-
power outage and the blockage of transportation routes [12], cation method. In the proposed model, unlike the previous
and (4) the outbreak of coronavirus in the Wuhan city in the research, we consider several key issues, which help to
winter of 2020, which caused more than 213 countries (based manage and design health services networks, such as the
on https://www.worldometers.info/coronavirus/countries- hierarchical organization of the networks, purchasing a
where-coronavirus-has-spread/%20live%20data%20in% group of medicine, disrupting the tasks of the suppliers, and
20the%20first%20of%20June%202020) to implement the its effects, which undoubtedly lead to a lack of inventory.
quarantine, more than policy and disruption to transport Since the model is formulated as a multiobjective function, a
systems. Coronavirus outbreak affected more than 6,235,658 fuzzy multiobjective goal programming model is considered
cases and taken the lives of about 373,176 up to the end of to solve the proposed optimization model using the R op-
May 2020. It should be noted that these statistics relate to the timization solver. A practical case study is also presented
end of March 2020; significantly, infected population according to the actual information of Cobel Darou phar-
numbers and death rates change daily [13]. The earthquake maceutical company to show the application of the proposed
in China (2008), the tornados of the Philippines in 2013, and model and effectiveness of the designed method.
the Indian Ocean tsunami are also among the natural di- The rest of this paper is structured as follows. Section 2
sasters. Apart from natural disasters, human disasters have comprises a review of the health supply chain literature. In
also disrupted related organizations. Disasters like the Section 3, the proposed methodology and assumptions are
Mumbai attacks in 2011 and the September 11 terrorist characterized for the problem. Section 4 presents a case
attack in the United States are among the human disasters. study for validation of the represented model. Section 5 is
[14] This shows the importance of logistics network design dealt with the development of sensitivity analysis for the
with high reliability in unfavorable conditions. model, and the results are displayed by a diagram. Finally,
 The supply chain disruption makes vital impacts on the whole results of this paper are provided in Section 6. The
patient level, especially in the shortage of medicines [15, 16]. obtained conclusion proves the application of the proposed
The world has witnessed a 300% increase in new medicine model in the real world.
shortages since 2006. Recently, multiple countries and do-
mains have been involved in this problem [15]. The problem
 2. Literature Review
posed by the supply chain disruptions puts the pharma-
ceutical companies under tangible pressure and may also In this section, we examine the relevant literature in two
compromise human health by medicine shortages. Inap- separate but complementary parts in the field of health
propriate situations for distribution of medicines, hospital services networks: hierarchical location-allocation for health
equipment, and their shortage can cause irreparable damage networks and facility location problems under disruptions.
to countries and health systems. However, desirable
implementation of the health supply chain management can
considerably contribute to the reduction of the total costs in 2.1. Hierarchical Location-Allocation for Supply Chains of
the healthcare sector [17]. Besides, the evolution of the lo- Health Networks. Location-allocation of facilities is the lo-
gistics system can lead to the improvement of the cation of a set of facilities to minimize the cost of the
Mathematical Problems in Engineering 3

response to demands. In other words, hierarchical location- et al. [37] proposed a hierarchical location-allocation model
allocation models deal with the location of new facilities in for health network design considering the referral system.
specific regions and the assignment of demand nodes to
established facilities. Depending on the nature of the system,
these models can include single-level or hierarchical net- 2.2. Facility Location Problems under Disruptions. In this
works. Several studies have been carried out in this field. The section, primarily, we report a brief history of disruption in
purpose of the present study is not to investigate all the the systems and supply chain. Afterward, we review the
impacts related to the location-allocation model, but a se- studies that have been carried out in the field of health care.
lection of research studies is presented to review this field In the last decade, the problems under the disruption have
comprehensively. The studies carried out for single-level been considered by many researchers. Drezner [38] con-
systems include the location-allocation model in the field of ducted the first study of Two Location Problems with Un-
health care services with geographical considerations to reliable Facilities and defined the P-Median and (p, q)
assess different options for providing services [24], assessing problems by assuming that the facilities may be inactive. On
the location of blood banks of the American red cross in the the other hand, supply chain disruption orientation (SCDO)
middle region of the Atlantic Ocean [25], the multistage concept is considered as the first systematic empirical in-
location-allocation model for organ transplant centers [26], vestigation for organizational responses to the disruptions of
and the evaluation of the location models of emergency the supply chain, which was introduced by [39]. It is essential
services using a simulation method [27]. Khodaparasti et al. to carry out some research studies about various aspects of
[28] presented a multiperiod location-allocation model for supply chain disruption such as strategic management
the home for the aged network to improve access to services. [40, 41], strategic (resilience) management [42, 43], and risk
In cases where there is a relationship between facilities at management [44, 45]. The supply chain is highly affected by
different levels of communication, the system is considered information flow, as well as goods and financial resource
hierarchical. The majority of health care systems have a flows, and thus it is necessary to integrate these items to
hierarchical organization, some of which are as follows: due decline the vulnerabilities [46]. Another research by Cui
to the weak geographical access in developing countries, et al. [47] and Shen et al. [48], which considered the sto-
Rahman and Smith [29] proposed a hierarchical location- chastic scenario-based formulations, also has investigated
allocation model for scheduling the health services. Hodgson the supply chain disruption. Furthermore, Peng et al. [12]
and Jacobsen [30] proposed the concept of "expected dis- decreased the risk of disruption for a logistics network under
tance under referral" for primary health care centers using facility failure using p-robust. To solve the problem, a hybrid
the P-median hierarchical location-allocation model. metaheuristic algorithm was employed based on genetic
Fahimnia et al. [14] investigated a two-objective location of algorithms, local improvement, and the shortest pathway.
mobile blood donation facilities in a blood supply network, Shishebori and Yousefi Babadi [49] addressed the designing
which includes different levels including blood donors, problem of a robust and reliable medical service (MS) center
mobile blood donation facilities (blood donation vehicles), location network by considering the disruption in the system
local and regional blood donation centers, and hospitals and constraint on investment budget and p-robust con-
(demand points). In the same year, Mestre et al. [31] pre- straints. At this time, An et al. [50] have designed an article
sented two hierarchical location-allocation models with a to address potential risks and disruptions in emergency
demand under uncertainty to enhance the geographic access service planning that including the facility disruption risks,
while minimizing the costs in the hospital network. Also, congestion in road traffic, and queuing delays in facilities. A
Hovav and Tsadikovich [32] proposed a facility location scenario-based stochastic mixed-integer nonlinear program
inventory problem to reduce the cost of the influenza (MINLP) used the Lagrangian relaxation approach to solve.
vaccination program. Elalouf et al. [33] to reduce operating Zarrinpoor et al. [51] designed the reliable hierarchical lo-
costs by repairing and maintaining blood sample collection cation-allocation model for medical service networks in
chain have developed a model for facility location problem which they considered disruption in the facilities. To ensure
solving and proposed the dynamic programming (DP) al- the quality of services and demand, they added the queuing
gorithm and fully polynomial time approximation scheme systems to their model. Finally, the model is formulated
(FPTAS) algorithm to solve it. Chaiwuttisak et al. [34] based on the two-stage optimization approach, and decision
proposed a binary integer programming model for location- making is defined in two stages. To minimize the cost and
allocation problem in two-level based on goals of improving time of emergency delivery of products to customers after a
blood supply while reducing transport costs. Safaei et al. [35] disaster, a biobjective robust optimization model has been
proposed a location-allocation model for pharmacies in designed with considering possible disruptions in facilities
Chalus city according to the Group Purchase Organization and routes and a Lagrangian relaxation and ε-constraint to
(GPO) which is the proposed multiobjective model that was solving the approach have been proposed [52]. To reduce
optimized using goal programming. Wang et al. [36] pro- greenhouse gas emissions in the biofuel supply chain net-
posed a hierarchical location-allocation model to describe work, Fattahi and Govindan [53] proposed a cost-effective
trade between social, economic, and environmental factors multistep random program to show the impact of disruption
in health networks from the supply and demand perspective. risk dimensions and sustainability dimensions on biofuels.
Then, they solved the model by a bilevel multiobjective To reduce potential risks and disruptions in supply chain
particle swarm optimization algorithm. Finally, Barzinpour design, Sabouhi et al. [9] have provided an integrated
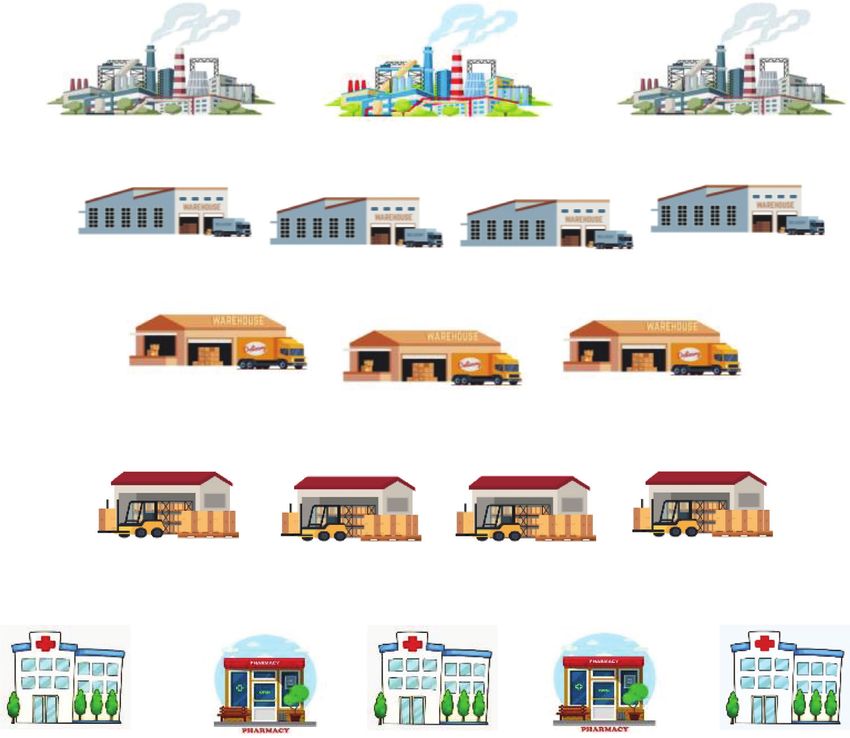
4 Mathematical Problems in Engineering

approach based on data envelopment analysis (DEA) and In this study, the proposed objective functions are
mathematical planning methods. First, the efficiency of characterized as follows: minimization of transactions costs
potential suppliers is determined by fuzzy DEA, and then a with suppliers, minimization of expected purchasing costs
two-stage possibilistic-stochastic programming model is from suppliers, minimization of expected percentages of
created to select a supplier, and the results are examined in a delayed goods and returned goods in each distributor, as
pharmaceutical company for the application of the pre- well as transportation cost in each echelon and fixed cost for
sented model. In the health supply chain section, Haghjoo distributor centers, and finally maximization of the expected
et al. [54] proposed a dynamic robust location-allocation scores for suppliers and total priority of product for
model to solve the disruption in the blood supply to hos- customers.
pitals and designed a scenario-based robust approach for the The number of two suppliers is generally selected for
inherent uncertainty of the problem. Besides, to solve the each hub-center distributor. The second supplier is desig-
large-scale problems, they proposed two metaheuristic al- nated as the backup supplier for the first selected center. If
gorithms, namely, the self-adaptive imperialist competitive the demand is not supplied by the first center because of
and invasive weed optimization. In this regard, Hamdan and disruption, the backup supplier will be allocated 100 percent
Diabat [19] designed a biobjective robust optimization of the quota.
model for the medical blood supply chain with considering Assumptions of the problem are denoted as follows:
disruption in the facilities. A Lagrangian relaxation-based
 Suppliers may be nonaccessible because of disruption
algorithm is developed for solving large-scale instances.
Table 1 shows how the proposed model covers all of these. Delay in providing each quota is allowed
The coding of columns of the problem type in Table 1 is also It is allowed to return the product to distributors by
defined in Table 2. customers or other distributors
 According to Table 1, most of the research papers The problem is investigated in multiple periods
presented in the health supply chain section consider the
 Each quota can be allocated to the second supplier for
model as a single level, and also, no research in the literature
 supporting the nonprovided demands, which cannot be
uses different aspects of capacity constraint, multiperiod,
 supplied by the first supplier
and hub simultaneously.
 Only one center is selected in each level of the
3. Problem Description distribution

This paper is focused on a five-echelon multiobjective op-
timization program for the selection of suppliers and dis- 3.1. Mathematical Model. This section is developed to ad-
tributors. In this regard, the optimal quota allocation is dress the proposed mathematical model for the problem. To
determined with respect to disruption of suppliers and do this, the mathematical model is given in equations
consideration of the distributor centers as a hub location- (1)–(40). Table 3 represents the required notations for the
allocation mode. The relationships between the five echelons models.
in the model are shown in Figure 1. The objective functions are as follows:

 ⎜
 ⎛
 ⎜
 ⎜ ⎟
 ⎞
 ⎟
 ⎟
 ⎜
 ⎜
 ⎜ ⎟
 ⎟
 ⎟
 Min z1: ⎜⎜
 ⎜
 ⎜Q kjpt C kjpt Y kjt 1 − R k + R k Q kjpt + kjpt kjt ⎟
 C Y ⎟
 ⎟
 ⎟
 ⎜
 ⎜ ⎟
 ⎟
 k j p t ⎜
 ⎝ k j p t ⎟
 ⎠
 k≠k

 + Fj Xj + Fh Xh + Fn Xn + TSkjpt Lkj Ykjt Qkjpt 1 − Rk + Rk Qkjpt
 j h n k j p t (1)

 TSkjpt Lkj Ykjt +
 k j p t
 k≠k

 TSjhpt Ljh β Ykjt Qjhpt + TShnpt Lhn Yjht Qhnpt + TSnipt Lni Ynit Qnipt ,
 j h p t h n p t n i p t

 Min Z2 : αkpt CCkjpt Ykjt , (2)
 k j p t

 Min Z3 : hjpt Qjhpt Yjht + hhpt Qhnpt Yhnt + hnpt Qnipt Ynit , (3)
 j h p t h n p t n i p t
Mathematical Problems in Engineering 5

 Table 1: Classification of the related papers.

 Health Network structure Model features
 Problem System Case
Articles supply Single Solution method
 Type disruption Hierarchical Hub Multiperiod Capacity study
 chain level
Jacobs et al. [25] FLP ✓ ✓ Scenario base ✓
 Robust possibilistic
Zahiri et al. [26] FLAP ✓ ✓ ✓ programming and ✓
 GAMS
Ünlüyurt and
 MCLP ✓ ✓ CPLEX ✓
Tunçer. [27]
Khodaparasti Outer approximation
 LAP ✓ ✓ ✓ ✓ ✓
et al. [28] algorithm (AOA)
Hodgson and
 MHLAP ✓ ✓ CPLEX
Jacobsen. [30]
 ε-constraint and
Fahimnia et al.
 FLP ✓ ✓ ✓ ✓ Lagrangian relaxation
[14]
 and GAMS
 ε-constraint and
Mestre et al. [31] MHLAP ✓ ✓ ✓ ✓ ✓
 CPLEX
Hovav and
 FLIP ✓ ✓ ✓ ✓ Heuristic algorithm ✓
Tsadikovic [32]
Elalouf et al. DP algorithm and
 FLP ✓ ✓ ✓
[33] FPTAS algorithm
Chaiwuttisak
 FLAP ✓ ✓ ✓ CPLEX ✓
et al. [34]
 Weighted goal ✓
Safaei et al. [35] HGPP ✓ ✓
 programming (WGP)
 and Lingo
Li et al. (2018) HFLAP ✓ ✓ (BLMOPSO) ✓
 algorithm
Barzinpour et al.
 HLAP ✓ ✓ ✓ ε-constraint
[37]
Drezner [38] PQCP ✓ ✓ Heuristic algorithm
Cui et al. [47] UFLP ✓ ✓ Lagrangian relaxation
 Approximation
Shen et al. [48] UFLP ✓ ✓ ✓
 algorithm
Peng et al. [12] LNDP ✓ ✓ ✓ Genetic algorithm
Shishebori and
Yousefi Babadi FL/NDP ✓ ✓ ✓ ✓ CPLEX ✓
[49]
An et al. [50] FLP ✓ ✓ Lagrangian relaxation ✓
Zarrinpoor et al. Benders
 MHLAP ✓ ✓ ✓ ✓ ✓
[51] decomposition (BD)
 Lagrangian relaxation
Diabat et al. [52] HFLAP ✓ ✓ ✓ ✓ ✓
 and ε-constraint
Fattahia and Rolling horizon
 FLP ✓ ✓ ✓ ✓ ✓
Govindan [53] procedure
Sabouhi et al. [9] LIP ✓ ✓ ✓ ✓ Fuzzy DEA ✓
Haghjoo et al. Robust optimization
 DRLAP ✓ ✓ ✓ ✓ ✓ ✓
[54] and two metaheuristic
Hamdan and
 HFLAP ✓ ✓ ✓ ✓ ✓ Lagrangian relaxation ✓
Diabat. [19]
 Fuzzy multichoice
Current study HHLAP ✓ ✓ ✓ ✓ ✓ ✓ goal programming ✓
 model and R solver
6 Mathematical Problems in Engineering

 Table 2: Coding of problem type in Table 1.
Problem type
Facility location problem FLP
Facility location inventory problem FLIP
Maximal coverage location problem MCLP
Hierarchical group purchasing problem HGPP
Hierarchical location-allocation problem HLAP
Logistic network design problem LNDP
Median hierarchical location-allocation problem MHLAP
Hierarchical hub location-allocation problem HHLAP
Location-allocation problem LAP
Location inventory problem LIP
Facility location-allocation problem FLAP
Hierarchical facility location-allocation problem HFLAP
(p, q)-center problem PQCP
Facility location/network design problem FL/NDP
Dynamic robust location-allocation problem DRLAP

 Unreliable supplier Reliable supplier Unreliable supplier

 Hub distributor

 Nonhub distributor

 Node distributor

 Customers

 Backup connections
 Connections
 Figure 1: General view of the problem.

 Min Z4 : sjpt Qjhpt Yjht + shpt Qhnpt Yhnt + snpt Qnipt Ynit , (4)
 j h p t h n p t n i p t

 Max Z5 : qk Ykjt , (5)
 k j t
Mathematical Problems in Engineering 7

 Table 3: Notations.
Ckjpt : unit purchasing price of product p given by supplier k to hub distributor j at period t
CCkjpt : transaction costs of providing product p via supplier k to hub distributor j at period t
TSkjpt : unit transportation price of product p from supplier k to hub distributor j at period t
TSjhpt : unit transportation price of product p from hub distributor j to nonhub distributor h at period t
TShnpt : unit transportation price of product p from nonhub distributer h to node distributor n at period t
β: rate of discount for the transference of products from hub distributors to nonhub distributors
αkpt : binary parameter (equal to one if product p can be supplied by supplier k at period t; otherwise, zero)
hjpt : percentage of returned product p to hub distributor j at period t
hhpt : percentage of returned product p to nonhub distributor h at period t
hnpt : percentage of returned product p to node distributor n at period t
sjpt : percentage of late delivered product p by hub distributor j at period t
shpt : percentage of late delivered product p by nonhub distributor h at period t
snpt : percentage of late delivered product p by node distributor n at period t
Ljh : distance from hub distributor j to nonhub distributor h
Lhn : distance from nonhub distributor h to node distributor n
Ykjt : binary parameter (equal to one if the trade from supplier k to hub distributor j at period t is set; otherwise, zero)
Yjht : binary parameter (equal to one if the trade from hub distributor j to nonhub distributor h at period t is set; otherwise, zero)
Yhnt : binary parameter (equal to one if the trade from nonhub distributor h to node distributor n at period t is set; otherwise, zero)
Ynit : binary parameter (equal to one if the trade from node distributor n to customer i at period t is set; otherwise, zero)
Xj : binary parameter (equal to one if the hub distributor j is established; otherwise, zero)
Qkjpt : optimal order of product p from supplier k to hub distributor j at period t
Qjhpt : optimal order of product p from hub distributor j to nonhub distributor h at period t
Qhnpt : optimal order of product p from nonhub distributor h to node distributor n at period t
Qnipt : optimal order of product p from node distributor n to customer i at period t
Xh : binary parameter (equal to one if the nonhub distributor h is established; otherwise, zero)

 Max Z6 : λnpt Qnipt Ynit . (6)
 n i p t

 Equation (1) gives the first objective function, which is ⎜
 ⎛
 ⎜
 ⎜ ⎟
 ⎞
 ⎟
 ⎟
 ⎜
 ⎜
 ⎜ ⎟
 ⎟
 ⎟
developed to minimize the total purchase cost from ⎜
 ⎜
 ⎜ ⎟
 ⎟
 ⎟
 ⎜⎜
 ⎜
 ⎜ Q Y
 kjpt kjt 1 − R k + Q kjpt R k Y ⎟
 kjt ⎟
 ⎟
 ⎟ ≤ Wj ∀ j, t,
suppliers considering disruption of them, also the total ⎜
 ⎜ ⎟
 ⎟
 ⎟
 k p ⎜
 ⎜
 ⎝ k ⎟
 ⎠
fixed cost of distributors, and total transportation cost.
 k≠k
Equation (2) characterizes the second objective function.
It minimizes the total transaction cost of products be- (7)
tween suppliers and hub distributors. The transaction cost
is comprised of those fixed costs for the establishment of Qjhpt Yjht ≤ Wh ∀h, t, (8)
relations and cooperation with suppliers such as supplier j p
selection, negotiations for contracting, an inspection of
goods, and quality control. Equation (3) denotes the third Qhnpt Yhnt ≤ Wn ∀n, t, (9)
objective function. This function is aimed to minimize the h p
expected total percentages of the returned products. This
type of cost will occur if each distributor has not the ability Qnipt Ynit ≤ Dipt ∀i, p, t, (10)
to supply the next level of distributor or customer demand n
with the expected quality. Equation (4) represents the
fourth objective function. It minimizes the expected total Qjhpt Yjht ≤ Qkjpt Ykjt ∀j, p, t, (11)
percentage of the late delivered products. The fifth ob- h k
jective function is developed in equation (5). This ob-
jective function maximizes the expected scores for the Qhnpt Yhnt ≤ Qjhpt Yjht , ∀h, p, t, (12)
selected suppliers based on a conducted periodical eval- n j
uation. Equation (6) describes the sixth objective func-
tion. This function leads to maximize the priority of the Qnipt Ynit ≤ Qhnpt Yhnt , ∀n, p, t, (13)
supplied products for customers. i h
 The constraints are formulated for the optimization
model as the following equations: hjpt Qjhpt Yjht ≤ Hjp ∀ j, p, (14)
 h t
8 Mathematical Problems in Engineering

 hhpt · Qhnpt · Yhnt ≤ Hhp , ∀ h, p, not exceed the maximum acceptable percentage of each
 (15) product for each distributor. Constraints (17)–(19) guar-
 n t
 antee that the total percentages of late delivered product for
 hnpt · Qnipt · Ynit ≤ Hnp , ∀ n, p, each product at all periods of time do not exceed the
 (16) maximum acceptable percentage of each product for each
 i t
 distributor. Constraint (20) controls the number of the
 sjpt · Qjhpt · Yjht ≤ Sjp , ∀ j, p, selected trade between each hub distributor and suppliers
 (17) which must be less than or equal 2 in our problem. Indeed,
 h t
 both suppliers require to supply products, whereas the
 shpt · Qhnpt · Yhnt ≤ Shp , ∀ h, p, second supplier is considered as a backup for the first
 (18)
 n t supplier in the disruption condition. Constraints (21)–(23)
 reveal that only one trade must occur between distributors,
 shpt · Qhnpt · Yhnt ≤ Shp , ∀ n, p, as well as node distributors and customers. Constraints
 (19)
 n t (24)–(29) control that each supplier to be selected before to
 be allocated a quota. It ensures that if the hub or node
 Ykjt ≤ 2, ∀j, t, (20) distributor is not selected, the right hand side is zero, and
 k thus the trades in the left hand side could not be set.
 Constraints (30) and (31) indicate the given values for the
 Yjht ≤ 1 , ∀h, t, (21) decision variables in the model.
 j

 Yhnt ≤ 1 , ∀n, t, 3.2. Solution Method. In this paper, a fuzzy multichoice goal
 (22)
 h programming model is utilized to solve the proposed model.
 In this approach, three goals (choices) are considered for
 Ynit ≤ 1, ∀i, t, (23) each objective function. The model chooses a goal among the
 n three choices for each function, and somehow the answer of
 all objective functions is close to their optimal answer. Due
 Ykjt ≤ αkpt , ∀j, p, t, (24) to the ease and accuracy in solving the model, a linearized
 model is proposed for this method [55]. Table 4 and con-
 Ykjt ≤ Xj , ∀k, j, t, (25) straints (20)–(28) are represented to introduce new symbols
 for the model and linearized model of the fuzzy three-choice
 Yjht ≤ Xj , ∀j, h, t, goal programming method, respectively. Additionally,
 (26)
 constraints (6)–(19) are repeated for this model.
 Yjht ≤ Xh , ∀j, h, t, (27) max zt � f1 µ1 + f2 µ2 + f3 µ3 + f4 µ4 + f5 µ5 + f6 µ6 ,
 (32)
 Yhnt ≤ Xh , ∀h, n, t, (28)
 z1 − g 1 z1 − g 2 z − g
 µ1 ≤ 1 − − u1 + − v1 − u1 + 1 − 3 v2 − u1 ,
 Yhnt ≤ Xn , ∀h, n, t, (29) d1 d2 d3
 (33)
 Qkjpt , Qjhpt , Qhnpt , Qnipt ≥ 0, ∀k, j, h, n, i, p, t, (30)
 z2 − g 4 z2 − g 5 z − g
 µ2 ≤ 1 − − u2 + − v3 − u2 + 2 − 6 v4 − u2 ,
 Ykjt , Yjht , Yhnt , Ynit , Xj , Xh , Xn ∈ {0, 1}, ∀k, j, h, n, i, t. d4 d5 d6
 (31) (34)
 Constraints (7)–(9) ensure that the total products which z3 − g 7 z3 − g 8 z − g
are supplied by each distributor do not exceed their initial µ3 ≤ 1 − − u3 + − v5 − u3 + 3 − 9 v6 − u3 ,
planned capacities. They ensure that the orders do not vi- d7 d7 d9
olate the capacity of hub distributors j, h, and n. Constraint (35)
(10) refers to satisfaction of the buyer’s demand for each
product at each time period by the last echelon of distrib- z4 − g
 10 z − g z − g
 µ4 ≤ 1 − − u4 + 4 − 11 v7 − u4 + 4 − 12 v8 − u4
utors. Constraints (11)–(13) control the feasibility of supply d10 d11 d12
of goods in every echelon of supply chain. Constraint (11) (36)
says for each distributor at each time period if there is a trade
from a supplier, then an order less than or equal to the g g − z g − z
 13 − z5
supplier trade could be set to a nonhub distributor. Con- µ5 ≤ 1 − + u5 + 14 + 5 v9 − u5 + 15 + 5 v10 − u5 ,
straints (14)–(16) guarantee that the total percentages of the d13 d14 d15
returned product for each product at all periods of time do (37)
Mathematical Problems in Engineering 9
Table 4: The fuzzy three-choice goal programming model. Formula (32) refers to maximization of the membership function for each single
objective function.
Parameters
g 1 . . . g 18 :considered fuzzy goals for functions
f 1 ...f 6 : the weight of the objective functions of (1) to (6) in the general objective function
d−1 . . . d−12 : maximum negative permissible deviation of each aspiration choice of the relevant objective function value
d+13 . . . d+18 : maximum positive permissible deviation of each aspiration choice of the relevant objective function value
Variables
v1 . . . v12 : binary variable aspiration choice
µ1 . . . µ6 : the membership function of z1 to z6
g g − z g − z concerned with the linearization of the model. Constraints
16 − z6
µ6 ≤ 1 − + u6 + 17 + 5 v11 − u6 + 18 + 6 v12 − u6 , (41)–(43) represent the type and range of the variables.
d16 d17 d18 In Section 4, a real numerical case study is considered for
(38) this model.
v1
u1 ≤ , 4. Numerical Results
v2
v3 In this section, a numerical case study is surveyed for
u2 ≤ , asthma-specific medicines. Accordingly, the real data of
v4
Cobel Darou pharmaceutical company were collected in
v5 2019. Also, it is noted that the R optimization solver is
u3 ≤ ,
v6 utilized to solve this real example. The value of parameters
(39)
v7 is specified as follows. The exact values are represented for
u4 ≤ , the demand and probability of supplier disruption in Ta-
v8
ble 5 and Table 6, respectively. It would be valuable to
v9 denote that the buyer of pharmacies is located in 4 cities of
u5 ≤ ,
v10 Iran comprising Tehran, Esfahan, Ahvaz, and Mashhad
v11 , which is demonstrated in Figure 2. The demands for the
u6 ≤ investigated centers are considered as 5 of the highest level
v12 ,
of applicants in each city, which are indicated to be
expressed for cities with the indexes 1 to 20, respectively.
u 1 ≥ v1 + v2 − 1 ,
The value of other parameters is declared on the base of the
u 2 ≥ v3 + v4 − 1 , interval in Table 7 due to improving expression in the
u3 ≥ v5 + v6 − 1, paper. The whole exact value of parameters is in the in-
(40) troduced intervals, and generally, the value has been ob-
u4 ≥ v7 + v8 − 1,
tained for the parameters of q and λ using the well-known
u5 ≥ v9 + v10 − 1, AHP methods [56].
u6 ≥ v11 + v12 − 1, It is obvious that there are 2 suppliers for the selected
pharmacies, with the names of AstraZeneca and GSK, which
u1 · u10 ≥ 0, (41) are introduced by the indexes k � 1 and k � 2 in the model,
respectively. In addition, indexes p � 1 to p � 5 are devoted
v1 · v12 ∈ {0, 1}, (42) to the pharmacies with the names of Pulmicort, Symbicort,
Flixotide, Seretide, and Rhinocort, respectively.
Furthermore, the values of the first choice are considered for
µ1 · µ6 ≥ 0. (43) aspirations as the optimal value of the single function, and
consequently, the second and third choices are considered for
Constraints (33)–(38) are utilized to control the mem- aspirations with 10 and 20% variations, respectively. It is done in
bership functions of Z1 to Z6. They are used for minimization comparison with the optimal value (increase for minimization
of Z1 to Z6; the maximum value of the negative permissible and decrease for maximization functions). The maximum
deviation for the objective function of any aspiration value is negative and positive deviations for each choice and the weight
considered in the fraction denominator of these functions. of the objective functions are also determined by experts.
Besides, because Z5 and Z6 are maximum, the maximum The presented model has been solved based on these
value of the positive deviation for the objective function of parameters. Table 8 gives the results of the objective func-
any aspiration value is applied in the denominator of the tions for the numerical example.
fraction. Constraint (39) is dealt with the limitation of The obtained values are considered for objective func-
choosing the aspiration, which demonstrates that the model tion as rational results. These values are proportionate to the
can select an aspiration in each function. Constraint (40) is expectation level with the emphasis on actual parameters. In10 Mathematical Problems in Engineering Table 5: The values of demands. Dipt p�1 p�2 p�3 p�4 p�5 t�1 570 640 120 346 90 t�2 1001 720 456 221 54 i�1 t�3 375 370 0 408 60 t�4 367 10 15 25 5 t�1 484 60 123 423 110 t�2 1965 60 310 1046 68 i�2 t�3 1687 115 10 890 0 t�4 236 130 80 75 50 t�1 352 128 651 780 15 t�2 2005 1328 450 654 87 i�3 t�3 426 147 12 38 26 t�4 190 0 30 580 0 t�1 269 56 98 69 52 t�2 706 244 53 471 22 i�4 t�3 54 10 0 30 10 t�4 10 168 0 54 1 t�1 189 120 94 39 0 t�2 1007 23 152 430 0 i�5 t�3 52 0 26 15 164 t�4 67 0 11 25 52 t�1 406 357 83 124 351 t�2 0 401 112 131 25 i�6 t�3 18 1314 12 1807 173 t�4 8 0 4 110 0 t�1 127 11 87 250 56 t�2 21 29 2 469 32 i�7 t�3 1 79 23 16 5 t�4 36 163 0 123 1 t�1 298 0 36 14 169 t�2 47 101 149 0 42 i�8 t�3 17 22 11 0 0 t�4 136 0 170 0 0 t�1 230 36 1113 14 75 t�2 126 0 26 159 41 i�9 t�3 1008 85 0 21 7 t�4 13 13 0 5 6 t�1 552 11 0 39 63 t�2 123 25 0 137 1 i � 10 t�3 63 140 0 11 1 t�4 20 63 102 1 0 t�1 363 160 498 260 1109 t�2 106 350 52 11 114 i � 11 t�3 106 113 110 0 15 t�4 98 39 110 231 18 t�1 630 1100 98 469 0 t�2 117 1100 174 47 112 i � 12 t�3 12 0 24 58 0 t�4 69 1100 16 132 112 t�1 392 99 613 26 95 t�2 20 36 59 2 41 i � 13 t�3 3 48 7 26 0 t�4 11 5 7 2 59 t�1 123 56 635 98 1115 t�2 4 169 15 135 52 i � 14 t�3 46 110 12 135 0 t�4 26 0 19 0 569
Mathematical Problems in Engineering 11

 Table 5: Continued.
Dipt p�1 p�2 p�3 p�4 p�5
 t�1 1405 690 120 75 0
 t�2 55 2 20 25 101
i � 15
 t�3 236 3 2 0 141
 t�4 10 95 46 12 10
 t�1 460 15 300 169 75
 t�2 145 10 100 115 115
i � 16
 t�3 84 52 250 50 77
 t�4 41 63 22 59 55
 t�1 290 504 605 130 20
 t�2 1296 575 123 102 109
i � 17
 t�3 232 325 457 25 64
 t�4 85 240 110 90 74
 t�1 40 500 20 134 23
 t�2 818 250 17 79 125
i � 18
 t�3 196 215 68 230 513
 t�4 70 100 105 300 420
 t�1 142 235 500 151 495
 t�2 210 320 120 100 858
i � 19
 t�3 520 300 407 72 21
 t�4 400 326 98 510 600
 t�1 190 440 105 410 480
 t�2 440 4 120 100 80
i � 20
 t�3 193 80 220 25 110
 t�4 770 80 540 312 100

 Table 6: The values of disruption of suppliers.
R1 5.87%
R2 3.61%

 Unreliable
 supplier
 Connections

 Reliable
 supplier

 Backup connections

 Supplier Node distributor
 Hub distributor Customer
 Nonhub distributor
 Figure 2: The case study’s network topology.
12 Mathematical Problems in Engineering
Table 7: The intervals of parameters.
TS [50,150]
W [5000,10000]
C [200,850]
CC [20,50]
h [0, 0.1]
s [0.01, 0.25]
H [0.1,0.2]
S [0.1,0.4]
F [4000,10000]
q [3,8]
L [5 × 10⁴ , 9 × 10⁵ ]
λ [2,9]
β 35%
α ∈{0, 1}
Table 8: The membership functions of a numerical example.
µ1 0.91
µ2 0.89
µ3 0.72
µ4 0.67
µ5 0.80
µ6 0.81
9000
8000
7000
6000
5000
4000
3000
2000
1000
0
Function Function 2 Function 3 Function 4 Function 5 Function
1 × 10⁹ 6 × 10⁴
Case study results Decreasing C
Increasing C Decreasing CC
Increasing CC
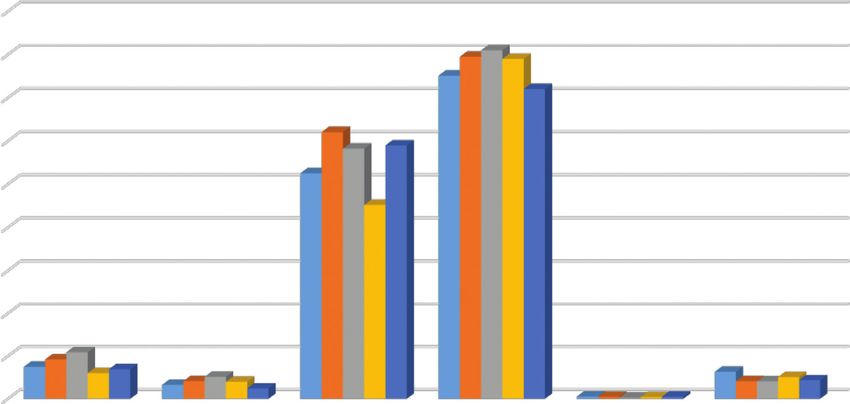
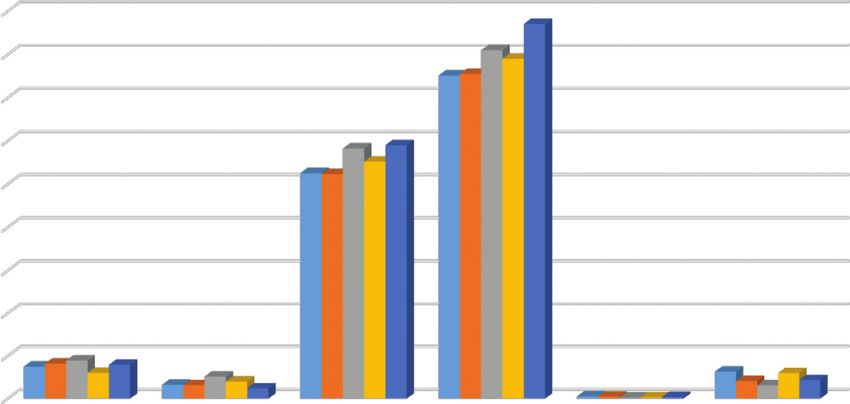
Figure 3: The results of function with alteration values of C and CC in four examples.
the next section, the sensitivity analysis is investigated for the attained consequences are shown in Figure 3. The next step is
case study by changing the value of some parameters. focused on changing the range of h and q. The outcomes are
demonstrated in Figure 4. In the last step, the values of q and
R are changed and their results are indicated in Figure 5.
5. Sensitivity Analysis In these examples, it is obvious that the value of func-
In this section, an attempt has been performed to prove the tions proportionally alters with the fluctuation of parame-
authority of the presented model. Therefore, it is essential to ters. Indeed, all of them correctly respond to any alterations.
analyze the model by changing the values of some param- Increment and decrement of the values of C and CC have
eters. The alternations are addressed in the following par- virtually effect on all function. According to the formulas of
agraphs, and their results are depicted by the diagram. To the objective functions, increasing or decreasing the values
develop a sensitivity analysis, the first step has been asso- of C and CC directly affects the first and second objective
ciated with changing the interval of values of C and CC. The functions, respectively, and indirectly affects otherMathematical Problems in Engineering 13 9000 8000 7000 6000 5000 4000 3000 2000 1000 0 Function Function 2 Function 3 Function 4 Function 5 Function 1 × 10⁹ 6 × 10⁴ Case study results Decreasing h Increasing h Decreasing s Increasing s Figure 4: The results of function with alteration values of h and s in four examples. 10000 9000 8000 7000 6000 5000 4000 3000 2000 1000 0 Function Function 2 Function 3 Function 4 Function 5 Function 1 × 10⁹ 6 × 10⁴ Case study results Decreasing R Increasing R Decreasing q Increasing q Figure 5: The results of function with alteration values of R and q in four examples. functions. Increasing or decreasing the value of C has not and decreasing the value of q have not had such an effect on had such an effect on the objective functions, while in- the objective functions. However, the most important re- creasing or decreasing the value of CC has a more significant percussion is reached by variation in R. The functionality of effect on the objective functions than C. However, this effect all functions improves by reducing the value of R, and by is not to improve the performance of the functions, Because increasing the values of R, all functions become more un- objective functions 1 to 4 are of type Min and objective desirable than the optimal results. These results demonstrate functions 5 and 6 are of type Max and by increasing the value the magnitude of surveying the disruptive conditions in of CC, the values of objective functions 1 to 4 increased and supply chain management. The dynamic and inaccurate the values of objective functions 5 and 6 decreased, and by nature of the quantity and quality of manufactured products decreasing the value of CC, only the objective function 2 has created a high degree of uncertainty and risk in supply improved slightly in terms of performance. Furthermore, chains. Therefore, it is necessary to identify and formulate variations in the values of h and s have expected reactions, these kinds of risks. Additionally, the uncertain mode of and according to the above analysis, we can conclude that supplier disruption probability brings the model closer to the values of the objective functions improved collectively the real-world model. Eventually, it is vivid that the validity only through decreasing the value of h. Finally, increasing of the modeling process is proved through this analysis.
14 Mathematical Problems in Engineering

6. Conclusions and Further Research Ideas industry,” Performance in Supply Chain Management (SCM),
 vol. 35, pp. 195–200, 2015.
In this paper, the hub location-allocation problem was [3] R. Uthayakumar and S. Priyan, “Pharmaceutical supply chain
studied to optimize six objective functions such as mini- and inventory management strategies: optimization for a
mization of transaction costs, delayed goods, returned pharmaceutical company and a hospital,” Operations Research
goods, and total fixed cost. Medicine unreliability problem is for Health Care, vol. 2, no. 3, pp. 52–64, 2013.
one of the most important issues in health supply chain [4] C. W. Craighead, J. Blackhurst, M. J. Rungtusanatham, and
management. This study tries to help the decision makers in R. B. Handfield, “The severity of supply chain disruptions:
 design characteristics and mitigation capabilities,” Decision
health management institutions to optimize the distribution
 Sciences, vol. 38, no. 1, pp. 131–156, 2007.
activities. It is worth noting that the parameters of supplier
 [5] M. Taghi, A. Nedjati, and R. Kazemi, “Solving health care
disruption probabilities were considered as uncertain pa- facility location problems with new heuristic algorithm
rameters. An authentic case study was exerted for health method,” International Journal Of Modeling and Optimiza-
supply chain management, and then it was investigated via tion, vol. 3, pp. 12–14, 2013.
the fuzzy multichoice goal programming method in R op- [6] N. Agami, M. Saleh, and M. Rasmy, “Supply chain perfor-
timization solver. According to these results, it is certified mance measurement approaches: review and classification,”
that the introduced model is proper and adaptable for Journal of Organizational Management Studies, vol. 2012,
problems in real-world situations. Also, sensitivity analyses Article ID 872753, 20 pages, 2012.
were considered with respect to variations in parameters, [7] N. Privett and D. Gonsalvez, “The top ten global health supply
and the importance of the R parameter is clearly shown in a chain issues: perspectives from the field,” Operations Research
way that if the risks and disruptions in the supply chain are for Health Care, vol. 3, no. 4, pp. 226–230, 2014.
properly identified and addressed for reducing it, all the [8] J.-M. Lawrence, N. U. Ibne Hossain, R. Jaradat, and
expected goals in the supply chain management can be M. Hamilton, “Leveraging a Bayesian network approach to
achieved, which generally includes cost reduction, mini- model and analyze supplier vulnerability to severe weather
 risk: a case study of the U.S. pharmaceutical supply chain
mization of expected percentages of delayed and returned
 following Hurricane Maria,” International Journal of Disaster
goods, and increase customer satisfaction. This evaluation
 Risk Reduction, vol. 49, Article ID 101607, 2020.
procedure confirms the significance and validity of the [9] F. Sabouhi, M. S. Pishvaee, and M. S. Jabalameli, “Resilient
recommended model. supply chain design under operational and disruption risks
 Some limitations of the study are the traffic situation considering quantity discount: a case study of pharmaceutical
consideration during the distribution time which affect of supply chain,” Computers & Industrial Engineering, vol. 126,
the delayed products. The truck load layout design could be pp. 657–672, 2018.
considered for the last echelon. The vehicle types and ca- [10] H. Abolghasemi, M. H. Radfar, M. Tabatabaee, N. S. Hosseini-
pacities could improve the problem design. Divkolayee, and F. M. Burkle, “Revisiting blood transfusion
 As further research studies in this area, it is possible to preparedness: experience from the Bam earthquake re-
use multiobjective metaheuristic algorithms and multi- sponse,” Prehospital and Disaster Medicine, vol. 23, no. 5,
criteria decision-making methods for the selection of sup- pp. 391–394, 2008.
pliers and distributors. In addition, various types of supply [11] N. Aydin and A. Murat, “A swarm intelligence based sample
risks can also be considered for analyzing the process. Other average approximation algorithm for the capacitated reliable
extensions can expand the model and represent other facility location problem,” International Journal of Production
 Economics, vol. 145, no. 1, pp. 173–183, 2013.
benefits of a supply chain for the achievement of a win-win
 [12] P. Peng, L. V. Snyder, A. Lim, and Z. Liu, “Reliable logistics
position.
 networks design with facility disruptions,” Transportation
 Research Part B: Methodological, vol. 45, no. 8, pp. 1190–1211,
Data Availability 2011.
 [13] WHO, Corona Virus Disease (COVID-19) Outbreak Situation.
The data used to support the study are available from the 1 June 2020, WHO, Geneva, Switzerland, 2020, https://www.
corresponding author upon request. who.int/emergencies/diseases/novel-coronavirus-2019.
 [14] B. Fahimnia, A. Jabbarzadeh, A. Ghavamifar, and M. Bell,
 “Supply chain design for efficient and effective blood supply in
Conflicts of Interest disasters,” International Journal of Production Economics,
 vol. 183, pp. 700–709, 2017.
The authors declare that they have no conflicts of interest. [15] P. Bogaert, T. Bochenek, A. Prokop, and A. Pilc, “A qualitative
 approach to a better understanding of the problems under-
References lying drug shortages, as viewed from Belgian, French and the
 European union’s perspectives,” PLoS One, vol. 10, no. 5,
 [1] N. Rego, J. Claro, and J. Pinho de Sousa, “A hybrid approach Article ID e0125691, 2015.
 for integrated healthcare cooperative purchasing and supply [16] K. Pauwels, S. Simoens, M. Casteels, and I. Huys, “Insights
 chain configuration,” Health Care Management Science, into European drug shortages: a survey of hospital pharma-
 vol. 17, no. 4, pp. 303–320, 2014. cists,” PLoS One, vol. 10, no. 3, Article ID e0119322, 2015.
 [2] N. Habidin, N. A. Shazali, M. Ithnin, Z. Zainol, N. Salleh [17] J. De Vries and R. Huijsman, “Supply chain management in
 Hudin, and W. S. W. Mustaffa, “A review of supply chain health services: an overview,” Supply Chain Management: An
 innovation and healthcare performance in healthcare International Journal, vol. 16, no. 3, pp. 159–165, 2011.
Mathematical Problems in Engineering 15

[18] S. PrasannaVenkatesan and M. Goh, “Multi-objective sup- [33] A. Elalouf, S. Hovav, D. Tsadikovich, and L. Yedidsion,
 plier selection and order allocation under disruption risk,” “Minimizing operational costs by restructuring the blood
 Transportation Research Part E: Logistics and Transportation sample collection chain,” Operations Research for Health Care,
 Review, vol. 95, pp. 124–142, 2016. vol. 7, pp. 81–93, 2015.
[19] B. Hamdan and A. Diabat, “Robust design of blood supply [34] P. Chaiwuttisak, H. Smith, Y. Wu, C. Potts,
 chains under risk of disruptions using Lagrangian relaxation,” T. Sakuldamrongpanich, and S. Pathomsiri, “Location of low-
 Transportation Research Part E: Logistics and Transportation cost blood collection and distribution centres in Thailand,”
 Review, vol. 134, Article ID 101764, 2020. Operations Research for Health Care, vol. 9, pp. 7–15, 2016.
[20] T.-M. Choi, “Innovative “bring-service-near-your-home” [35] A. S. Safaei, F. Heidarpoor, and M. M. Paydar, “A novel
 operations under corona-virus (COVID-19/SARS-CoV-2) mathematical model for group purchasing in healthcare,”
 outbreak: can logistics become the messiah?” in Trans- Operations Research for Health Care, vol. 15, pp. 82–90, 2017.
 portation Research Part E: Logistics and Transportation [36] L. Wang, H. Shi, and L. Gan, “Healthcare facility location-
 ReviewElsevier, Amsterdam, Netherlands, 2020. allocation optimization for China’s developing cities utilizing
[21] D. Ivanov, “Predicting the impacts of epidemic outbreaks on a multi-objective decision support approach,” Sustainability,
 global supply chains: a simulation-based analysis on the vol. 10, no. 12, 2018.
 coronavirus outbreak (COVID-19/SARS-CoV-2) case,” [37] F. Barzinpour, M. Maleki Rastaghi, and M. S. Pishvaee, “A
 Transportation Research Part E: Logistics and Transportation multi-objective hierarchical location-allocation model for the
 Review, vol. 136, Article ID 101922, 2020. healthcare network design considering a referral system,”
[22] K. Govindan, H. Mina, and B. Alavi, “A decision support International Journal of Engineering, vol. 31, no. 2, pp. 365–
 system for demand management in healthcare supply chains 373, 2018, http://www.ije.ir/article_73129_
 considering the epidemic outbreaks: a case study of coro- 7191547c1a8311e212712e9f8632ddb9.pdf.
 navirus disease 2019 (COVID-19),” Transportation Research [38] Z. Drezner, “Heuristic solution methods for two location
 Part E: Logistics and Transportation Review, vol. 138, Article problems with unreliable facilities,” Journal of the Operational
 ID 101967, 2020. Research Society, vol. 38, no. 6, pp. 509–514, 1987.
[23] O. Aptel and H. Pourjalali, “Improving activities and de- [39] C. Bode, S. M. Wagner, K. J. Petersen, and L. M. Ellram,
 creasing costs of logistics in hospitals: a comparison of U.S. “Understanding responses to supply chain disruptions: in-
 and French hospitals,” The International Journal of Ac- sights from information processing and resource dependence
 counting, vol. 36, no. 1, pp. 65–90, 2001. perspectives,” Academy of Management Journal, vol. 54, no. 4,
[24] P. Harper, A. K. Shahani, J. E. Gallagher, and C. Bowie, pp. 833–856, 2011.
 “Planning health services with explicit geographical consid- [40] Y. Sheffi and J. B. Rice, “A supply chain view of the resilient
 erations: a stochastic location–allocation approach,” Omega, enterprise,” MIT Sloan Management Review, vol. 47, no. 1,
 vol. 33, no. 2, pp. 141–152, 2005. p. 41, 2005.
[25] D. A. Jacobs, M. N. Silan, and B. A. Clemson, “An analysis of [41] C. S. Tang, “Robust strategies for mitigating supply chain
 alternative locations and service areas of American red cross disruptions,” International Journal of Logistics Research and
 blood facilities,” Interfaces, vol. 26, no. 3, pp. 40–50, 1996. Applications, vol. 9, no. 1, pp. 33–45, 2006.
[26] B. Zahiri, R. Tavakkoli-Moghaddam, and M. S. Pishvaee, “A [42] U. Jüttner and S. Maklan, “Supply chain resilience in the
 robust possibilistic programming approach to multi-period global financial crisis: an empirical study,” Supply Chain
 location-allocation of organ transplant centers under un- Management: An International Journal, vol. 16, no. 4,
 certainty,” Computers & Industrial Engineering, vol. 74, pp. 246–259, 2011.
 pp. 139–148, 2014. [43] S. Y. Teoh and H. S. Zadeh, “Strategic resilience management
[27] T. Ünlüyurt and Y. Tunçer, “Estimating the performance of model: complex enterprise systems upgrade implementation,”
 emergency medical service location models via discrete event Pacific Asia Journal of the Association for Information Sys-
 simulation,” Computers & Industrial Engineering, vol. 102, temss, vol. 103, 2013.
 pp. 467–475, 2016. [44] H.-C. Pfohl, H. Köhler, and D. Thomas, “State of the art in
[28] S. Khodaparasti, M. E. Bruni, P. Beraldi, H. R. Maleki, and supply chain risk management research: empirical and con-
 S. Jahedi, “A multi-period location-allocation model for ceptual findings and a roadmap for the implementation in
 nursing home network planning under uncertainty,” Oper- practice,” Logistics Research, vol. 2, no. 1, pp. 33–44, 2010.
 ations Research for Health Care, vol. 18, pp. 4–15, 2018. [45] D. Vlachos, E. Iakovou, K. Papapanagiotou, and D. Partsch,
[29] S.-U. Rahman and D. K. Smith, “Use of location-allocation “Building robust supply chains by reducing vulnerability and
 models in health service development planning in developing improving resilience,” International Journal of Agile Systems
 nations,” European Journal of Operational Research, vol. 123, and Management, vol. 5, no. 1, pp. 59–81, 2012.
 no. 3, pp. 437–452, 2000. [46] H. Peck, “Reconciling supply chain vulnerability, risk and
[30] M. J. Hodgson and S. K. Jacobsen, “A hierarchical location- supply chain management,” International Journal of Logistics
 allocation model with travel based on expected referral dis- Research and Applications, vol. 9, no. 2, pp. 127–142, 2006.
 tances,” Annals of Operations Research, vol. 167, no. 1, [47] T. Cui, Y. Ouyang, and Z.-J. M. Shen, “Reliable facility lo-
 pp. 271–286, 2008. cation design under the risk of disruptions,” Operations Re-
[31] A. M. Mestre, M. D. Oliveira, and A. P. Barbosa-Póvoa, search, vol. 58, no. 4, pp. 998–1011, 2010.
 “Location-allocation approaches for hospital network plan- [48] Z.-J. M. Shen, R. L. Zhan, and J. Zhang, “The reliable facility
 ning under uncertainty,” European Journal of Operational location problem: formulations, heuristics, and approxima-
 Research, vol. 240, no. 3, pp. 791–806, 2015. tion algorithms,” INFORMS Journal on Computing, vol. 23,
[32] S. Hovav and D. Tsadikovich, “A network flow model for no. 3, pp. 470–482, 2011, https://EconPapers.repec.org/
 inventory management and distribution of influenza vaccines RePEc:inm:orijoc:v:23:y:2011:i:3.
 through a healthcare supply chain,” Operations Research for [49] D. Shishebori and A. Yousefi Babadi, “Robust and reliable
 Health Care, vol. 5, pp. 49–62, 2015. medical services network design under uncertain
You can also read