Fiscal 2021 Results Briefing Meeting - May 19, 2021 Nisshin Seifun Group Inc.
←
→
Page content transcription
If your browser does not render page correctly, please read the page content below

Fiscal 2021
Results Briefing Meeting

           May 19, 2021

     Nisshin Seifun Group Inc.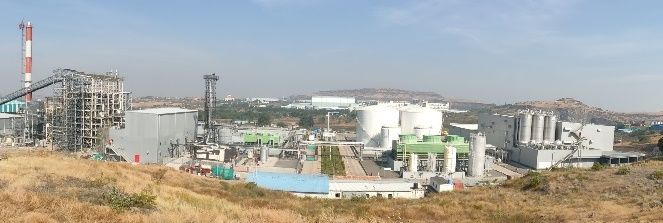
Contents

I. Fiscal 2021 Results and Fiscal 2022 Forecasts
II. Overview of the “NNI-120 II” Medium-term Management
    Plan
III. Individual Group Business Responses to the Novel
     Coronavirus Pandemic and Long-term Vision “NNI
     ‘Compass for the Future’” Initiatives
(Ref.) The Wheat Market

                                                          1
I. Fiscal 2021 Results and Fiscal 2022
   Forecasts

                                         2
1. Fiscal 2021 Results
   Net sales decreased due to several factors. These included a decline in sales in the flour milling business, largely reflecting
   lower wheat flour prices due to price revisions for wheat and decreased demand caused by the pandemic, coupled with a
   temporary decrease in facility construction completion and effects from the transfer of the pet food business. These factors
   outweighed beneficial effects from the new consolidation of Tokatsu Foods Co., Ltd. in the first quarter.
   Operating profit was lower for the year despite a recovery in performance in the U.S. flour milling business, robust
   shipments in Japan of household-use processed foods and raw materials for pharmaceuticals, along with a reduction in
   various expenses. This decline mainly reflected reduced profit in the flour milling business (Japan, Australia, etc.) from
   lower demand and other issues caused by the pandemic, coupled with a decline in sales in the prepared dishes and other
   prepared foods business, and a temporary decrease in facility construction completion.
   On the other hand, business forecasts were met thanks to improved production efficiency in the prepared dishes and other
   prepared foods business and beneficial effects from cost reductions across all businesses.

                                                                                        * Figures rounded down to nearest million yen

                                 Fiscal 2021                    Forecasts                        Fiscal 2020 Results
       (Millions of yen)           Results                                 Change                                   Change

         Net sales                  679,495             700,000                (2.9)%           712,180                 (4.6)%
  Overseas sales ratio                 22.9%               22.5%                –                   23.3%                –
    Operating profit                  27,197              26,000               +4.6%               28,852               (5.7)%
     Ordinary profit                  29,886              27,000             +10.7%                31,434               (4.9)%
  Profit attributable to
   owners of parent
                                      19,011              17,000             +11.8%                22,407             (15.2)%
                                                                                                                                        3
2. Fiscal 2021 Performance in Review
• The fiscal year ended March 31, 2021 witnessed major disruption in people’s lifestyle patterns, as
repeated growth and contraction in the spread of the novel coronavirus pandemic throughout the
year led to the declaration of two states of emergency in Japan, among other concerns. Amid these
changes, the business environment impacted each of the Group’s companies in positive and negative
ways, culminating in lower sales and profits for the year.
Fiscal 2021 Review of Performance by Segment
Flour Milling Segment (Japan) Flour Milling Segment (Overseas)
• Demand for pasta, instant noodles and similar household-use products rose, lifted by a • In the U.S., business performance recovered. Similarly, sales of wheat flour for
shift toward at-home dining demand; demand for commercial-use products used in household-use processed food manufacturers was firm.
bread, sweets and other products for specialty stores and restaurants declined. • In Australia, business performance worsened, the result of a downturn in shipments of
• The Company’s commercial-use wheat flour shipments declined by 2.3%. In contrast, prepared mix and bakery-related ingredients, coupled with deterioration in productivity.
the overall market was widely expected to decline by around 3%. • Operating profit was lower year on year, primarily due to worsening business
• Operating profit declined year on year, mainly due to lower shipments and performance in Australia, despite the recovery in U.S. performance.
deterioration in the product mix.
Processed Food Segment (Japan) Processed Food Segment (Overseas)
• In household-use processed foods, shipments were firm atop growth in at-home • The prepared mix business in Southeast Asia and China was impacted by weak
dining demand. Shipment growth was significant particularly in the first quarter, when the demand, especially in Southeast Asia, due to the novel coronavirus pandemic.
first state of emergency was declared. The Company launched high-value-added • For our yeast plant under construction in India, a date for the start of operations
products tailored to changing consumer needs, and responded to growth in at-home remains undetermined due to the impact of the novel coronavirus pandemic.
dining demand. • Shipments of EPA-E, a raw material for pharmaceuticals, were strong. However, 2020
• In commercial-use processed foods, shipments fell due to weak restaurant demand. sales for Amarin were below initial forecasts, as prescriptions for VASCEPA® struggled to
• In the yeast and biotechnology business, sales declined mainly on lower shipments of grow due to fewer medical facility visits by U.S. patients in response to the novel
breadmaking ingredients. coronavirus pandemic.
• In the healthcare foods business, shipments of consumer products were firm. • Operating profit was higher year on year atop robust shipments of EPA-E.
• Operating profit for the segment rose year on year, reflecting robust shipments of
household-use processed foods and control of sales expansion costs, coupled with
reductions in various expenses, particularly travel and meeting-related costs.
Prepared Dishes and Other Prepared Foods Segment Others Segment
• Due to growth in the rate of people working from home and fewer opportunities for outings, • In the engineering business, sales were lower, as expected, due to a temporary
demand for prepared dishes declined in urban areas and tourist resorts. Sales, decline in facility construction.
however, were higher year on year due to effects in the first quarter from the new • In the mesh cloth business, performance was hit by weak production in the automotive
consolidation of Tokatsu Foods Co., Ltd., which became a subsidiary in July 2019. industry in the first half of the year.
• Operating profit was lower year on year, as the impact of weak sales outweighed • In the pet food business, the Company carried out production only as an outsourcer.
improved production efficiency and sales growth for seasonal New Year’s dishes in This production was terminated as of March 31, 2021.
step with expanded demand. • While operating profit was lower, primarily due to a temporary decrease in facility
construction, the degree of decline in profit was far better than initially expected.
4
3. Assumptions for Fiscal 2022 Forecasts
• Temporary growth and contraction in the novel coronavirus pandemic are expected to remain present in the fiscal
year ending March 31, 2022. Accordingly, the business environment for all Group companies will continue to be
impacted.
• In each business, the Company is aiming to achieve actual growth in sales and profits through measures that place
highest priority on realizing a rebound in sales and swift return to a growth trajectory by adapting to changes in the
business environment.
Assumptions for Fiscal 2022 Forecasts by Segment
Flour Milling Segment (Japan) Flour Milling Segment (Overseas)
• The market environment remains extremely clouded in the current term due to the novel • In the U.S., while price revision measures and other efforts will continue, due mainly
coronavirus pandemic. Nevertheless, we will strengthen sales capabilities with an eye to the plant closure of a major client, profits at this time are expected to be slightly
to spurring a year-on-year rebound in shipments of around 1%, while working toward lower year on year.
a recovery in performance. However, due to the impact of the novel coronavirus ⇒ See p. 16 for details
pandemic on the market environment, and in light of subsequent changes in the market • In Australia, while market uncertainty due to the novel coronavirus pandemic remains
environment, we will pursue measures for achieving a full-scale recovery in strong in the current term, we will enact a range of measures targeting sales,
performance over roughly 2 to 3 years, including the current term. production and cost in order to spur a modicum of recovery.
⇒ See p. 14 for details ⇒ See p. 17 for details
Processed Food Segment (Japan) Processed Food Segment (Overseas)
• Demand for at-home dining will remain fundamentally strong during the current term, as • The prepared mix business in Southeast Asia and China is projected to see a recovery in
well. However, due to the absence of substantial growth in shipments reported in the first demand in China, along with some degree of recovery in Southeast Asia.
quarter of the previous year, we project lower shipments of household-use processed • The schedule for the start of operations at a yeast plant in India remains
foods compared to the previous year. During the current term, we also intend to undetermined due to the impact of the novel coronavirus pandemic locally.
develop and launch high-value-added products tailored to consumers’ changing ⇒ See p. 18 for details
needs. • Shipments in the current term of EPA-E, a raw material for pharmaceuticals, are
⇒ See p. 19 for details projected to decline temporarily, as we carefully monitor uncertainty surrounding
• In commercial-use processed foods, while a modicum of recovery is expected from sales of VASCEPA® by Amarin and growth in Amarin’s product inventory, among
initiatives taken to spur a recovery in shipments, levels for the current term are not other factors.
projected to return to those reported in fiscal 2020 prior to the novel coronavirus ⇒ See p. 21 for details
pandemic. • Operating profit is expected to decline year on year, mainly on a temporary decrease
• Operating profit is expected to decline, largely reflecting lower shipments for in EPA-E shipments.
processed foods overall, coupled with an increase in sales expansion costs and
other expenses successfully controlled in the previous year.
Prepared Dishes and Other Prepared Foods Segment Others Segment
• With rate of working from home as part of countermeasures for the novel coronavirus • In the engineering business, we project some degree of recovery in facility
pandemic expected to remain high, demand for prepared dishes is not expected to construction completion in the current term.
return to fiscal 2020 pre-pandemic levels during the current term particularly in urban • In the mesh cloth business, we anticipate sales growth in chemical products in step with a
areas. Nevertheless, operating profit is anticipated to grow year on year, as we recovery in the automotive industry, and will aim for further growth through more robust
strengthen initiatives designed to improve production efficiency and target profit sales to growth markets.
growth. • In the pet food business, sales will decline year on year due to termination of the
⇒ See p. 20 for details Company’s pet food production on an outsourcing basis.
⇒ See p. 22 for details
5
4. Fiscal 2022 Forecasts
   Net sales are likely to be lower, the result of decreased shipments of household-use processed foods in Japan, the end of
   pet food production by the Group on an outsourced basis, and the significant impact of application of an accounting
   standard regarding revenue recognition. These factors overshadow a modicum of recovery in demand in the flour milling
   and prepared dishes and other prepared foods businesses, a recovery in facility construction completion, and higher prices
   for wheat flour following price revisions for wheat.
   Operating profit is projected to be higher, as a certain level of recovery in performance in the flour milling and prepared
   dishes and other prepared foods businesses offset a temporary reduction in shipments of raw materials for
   pharmaceuticals and the absence of cuts to various expenses enacted last year.

                                                                                        * Figures rounded down to nearest million yen

                                   Fiscal 2022               Fiscal 2021
       (Millions of yen)                                                           YoY difference              YoY change
                                    Forecasts                  Results
         Net sales                        660,000                   679,495                  (19,495)                      (2.9)%
  Overseas sales ratio                       25.0%                     22.9%                 –                         –
    Operating profit                        28,200                    27,197                   +1,002                      +3.7%
     Ordinary profit                        30,000                    29,886                      +113                     +0.4%
  Profit attributable to
   owners of parent
                                            18,100                    19,011                      (911)                    (4.8)%
 * Application of the accounting standard regarding revenue recognition will have an impact on net sales of -¥60.0
   billion. Actual net sales will rise ¥40.5 billion (up 6.0%).

                                                                                                                                        6
5. Shareholder Returns
Trends in Total Dividends and Payout Ratio
   • Set baseline payout ratio to 40% or more
   • For the fiscal year ended March 31, 2021, the dividend per share is scheduled to increase by ¥3, including a dividend commemorating the Company’s
     120th anniversary.
     The dividend for the fiscal year ending March 31, 2022 is scheduled to increase by ¥2, for an actual dividend increase scheduled to occur for 9th
     consecutive term.                                                                                                       64.1%
 (Billions of yen)
       13                                                                                                               57.9%           60.0%
                        Total dividends               Payout ratio
       12
                                                                                                                45.1%
       11                                                41.2%                                        42.7%                     11.6
                                           39.6%                        40.3%          40.6%
       10       36.3%      34.6%
                                                                                                                        11.0            40.0%
                                                                                                                10.1
        9                                                                                               9.5
        8                                                                                8.6
        7                                                                 7.8                                                           20.0%
                                                           7.2
        6
                                             6.3
        5
                  4.9           5.2
        4                                                                                                                               0.0%
               FY2013 FY2014 FY2015 FY2016 FY2017 FY2018 FY2019 FY2020 FY2021 FY2022 (forecasts)
                  ¥20           ¥20          ¥22            ¥24            ¥26           ¥29            ¥32      ¥34     ¥37    ¥39
 Dividend                                                                                                                              (*1)
                                                                                                                                       For the fiscal year ended
 per share                                                                                                                             March 31, 2021, the year-
                                                                                                                                       end dividend per share is
                                                                                                                                       scheduled to increase by
                                      Actual dividend increase scheduled to occur for 9th consecutive term (*1)                        ¥3 (including a dividend of
                                                                                                                                       ¥2 commemorating the
   ¥10.0 billion in                                                                                                                    Company’s 120th
   treasury stock          1.1-for-1 stock split, actual dividend increase for 2nd consecutive term (*2)                               anniversary).
                                                                                                                                       For the fiscal year ending
 purchased in fiscal                                                                                                                   March 31, 2022, the
year ended March 31,     (*2)   1.1-for-1 stock splits conducted on October 1 of 2013 and 2014, respectively.                          dividend per share is
                                Dividend per share payment was not adjusted and subsequently increased.                                scheduled to increase by
        2018
                                                                                                                                       ¥2.

                                                                                                                                                                     7
6. Future Growth Strategies
• The highest priority is to realize a recovery in earnings by adapting to changes in the business
environment caused by the novel coronavirus pandemic. There is no change in the direction of the
Company’s growth strategy in line with its Long-term Vision.
Growth strategy for core and growth driver businesses
1. Core businesses Continue to situate “wheat flour-related ingredients business” and “household-use foods business,” both of which possess overwhelming
competitive strength in Japan, as the Group’s earnings base well into the future.
Wheat flour-related ingredients business (Japan) Household-use foods business (Japan)
• Beginning with wheat flour, where the Group possesses significant management resources, • Even taking factors such as high demand for at-home dining and other market changes
we are working in the Japan market to raise our sales share in a wide range of food due to the novel coronavirus pandemic into account, we will put into motion a strategy
ingredient businesses that include prepared mix and yeast, with the aim of capturing for higher added value built around the concepts of “easy-to-prepare and
stable earnings even in a business environment where a decline in population is convenient,” “authentic” and “healthy,” with environmental sustainability in mind.
anticipated. To do this, we will bring forward synergies from the comprehensive • In frozen foods as well, we will enhance product development driven by the same concepts,
capabilities that exist between businesses, prefaced on a thoroughly customer-oriented with plans to expand business through cost reductions and more robust production and
policy. distribution systems.
• For the domestic flour milling business, which sits at the heart of this broader operation, • Through these initiatives, we will realize profit growth despite social conditions
while earnings capacity has fallen briefly due to market changes triggered by the novel characterized by population decline, low birthrates and societal aging.
coronavirus pandemic, we will reinforce sales capabilities and our capacity to address
market environment changes to spark a recovery in earnings capacity over the next 2 to 3
years, which includes the current term.
2. Growth driver businesses We will prioritize the investment of management resources specifically in our overseas business and the prepared dishes and other
prepared foods business, both of which lead the Group’s growth, have prospects for additional market growth, and take advantage of the
Group’s technological base.
Overseas Business Prepared dishes and other prepared foods business
• In the flour milling business, which accounts for the bulk of overseas business sales, we • Demand for prepared dishes for convenience stores and other sectors has faltered
are developing operations across the Pacific Rim, including in the U.S. and Australia. We temporarily due to the novel coronavirus pandemic. Nevertheless, due to changes in
intend to expand this development area even further. In each area being developed, social structure, including the movement of women into the working world and societal
populations are growing – a point we intend to address in implementing our growth aging, the need for faster meals is expected to rise higher, positioning this as a
strategy. growth market.
• In the Australia flour milling business, the Group’s top priorities are spurring a recovery • Through production automation and promotion of labor saving by leveraging the Group’s
in business performance and establishing a growth base to turn this into a growth technological capabilities and other assets, we plan to switch this business structure
business as quickly as possible. over to one that is much less labor intensive.
• In the U.S. flour milling business, we will deepen collaboration with the Canada flour • We will showcase the Group’s R&D capabilities, one of its strengths, in the
milling business across a range of flour milling sales efforts, working as one to raise our development of distinctive, high-value-added products and frozen prepared dishes.
profile in the North America west coast market. • Through these actions, we will turn to a more sophisticated business model in the
• In the India yeast business, a plant is currently under construction. The schedule for the prepared dishes and other prepared foods business, raising profitability accordingly.
start of operations remains undetermined due to the spread of the novel coronavirus • We will take steps to improve productivity, with an eye to improving profitability.
pandemic. That said, the business environment for the bakery market, the target for this
operation, remains unchanged in light of the novel coronavirus pandemic.
The Nisshin Seifun Group is working to realize sustainable growth by leveraging its strengths to transform risks into business opportunities,
3. Sustainable cyclical growth accurately identifying both opportunities and threats that emerge from non-continuous changes in the environment caused by social issues
and technological innovation.
8II. Overview of the “NNI-120 II” Medium-
term Management Plan
91. Overview of the “NNI-120 II” Medium-term Management Plan
• The previous medium-term management plan, “NNI-120,” expanded business
foundations through new investment in Japan and overseas. From this base, “NNI-120
II” (FY2016-2021) targeted earnings base restructuring, profit growth and more robust
shareholder returns.
FY2015
FY2020 Results FY2021 Results Plan Targets (FY2021)
Results
Starting point Growth rate Growth rate Growth rate
for “NNI-120 II” (annual) (annual) (annual)
Net sales
526.1 712.1 6.2% 679.4 4.4% 750.0 6%
(Billions of yen)
Operating profit
20.4 28.8 7.1% 27.1 4.8% 30.0 7%
(Billions of yen)
EPS (Yen) 53.3 75.4 7.2% 64.0 3.1% 80 8%
ROE 4.6% 5.6% – 4.6% – 6% or more –
• Progress through fiscal 2020 saw steady growth in net sales, operating profit and EPS largely in line with the annual rate of growth
targeted for the final year of the medium-term management plan.
• In fiscal 2021, the plan’s final year, while the impact of the novel coronavirus pandemic sparked firm performance for the processed food
business in Japan, the flour milling (Japan, Australia, etc.) and prepared dishes and other prepared foods businesses struggled.
Furthermore, there was a temporary decline in facility construction completion, as well as the transfer of the pet food business. These and
other factors culminated in missed targets for the year.
• Although the business environment for all Group companies was significantly affected by the novel coronavirus pandemic, we reinforced our
capacity to respond to changes in the market environment (a recognized issue from before the pandemic) and positioned a swift recovery in
sales capabilities and earnings capacity as the highest priority issues to address.
• As we give precedence to gaining the clearest view of the current business environment, we have opted to delay formulation of a new
medium-term management plan at this time.
102. Overview of the “NNI-120 II” Medium-term Management Plan
– Enhance Strategic Investment and the Business Portfolio
• We made strategic investments of roughly ¥90.0 billion primarily in growth driver businesses. These
included the purchase of Allied Pinnacle Pty Ltd. in Australia and construction of a new yeast plant in
India in the overseas business, as well as the new consolidation of Tokatsu Foods Co., Ltd. in the
prepared dishes and other prepared foods business.
• We transferred the pet food business to enhance the business portfolio
Six-year cash flow figures from start of the “NNI-120 II” medium-term management plan
(C/F excl. deposits exceeding 3 months
(Billions of yen)
and operating bonds) Cash flows Cash flow from operating activities
from operating
50 activities ¥240.0 billion
25 Cash flows Total shareholder returns ¥(60.0) billion
0 from investing
activities (Dividends ¥(50.0) billion)
(25) (Purchase of treasury stock
Cash flows
(50) from financing ¥(10.0) billion)
activities
(75) Facility and business investment
(100) ¥(180.0) billion
FY2016 FY2017 FY2018 FY2019 FY2020 FY2021
Estimated investment amount
• Major strategic investments decided during the “NNI-120 II” medium-term management plan (Billions of yen)
Saginaw Plant expansion, Miller Milling Processed New plant (prepared mix), Vietnam Nisshin
Flour milling 6.8 foods
1.7
Company, LLC Technomic Co., Ltd.
Yeast and
biotechnology
New plant, Oriental Yeast India Pvt. Ltd. 15.7
Flour milling Chilliwack Plant expansion, Rogers Foods Ltd. 3.4
Prepared dishes
Purchase of Sriracha Plant, Nisshin-STC and other Consolidation of Tokatsu Foods Co., Ltd. 15.1
Flour milling 1.7 prepared foods
Flour Milling Co., Ltd.
Prepared dishes
Flour milling Purchase of Allied Pinnacle Pty Ltd. 46.8
and other Purchase of Joyous Foods Co., Ltd. 3.2
prepared foods
113. Overview of the “NNI-120 II” Medium-term Management Plan
– Group Growth
• Built mechanisms for showcasing Group-wide capabilities, while strengthening business
competitiveness via a thorough recommitment to customer-oriented policy, coupled with model
change in existing businesses and business portfolio enhancement.
• Steadily enacted model changes to realize the Long-term Vision. The size and configuration of the
Group also changed dramatically.
FY2015 Results (Start of plan) FY2021 Results
Consolidated net
Consolidated net sales
sales
¥526.1 billion ¥679.4 billion
Consolidated Consolidated
operating profit
operating profit
¥20.4 billion
¥27.1 billion
Amortization of goodwill, etc.: ¥1.8 billion Amortization of goodwill, etc.: ¥8.1 billion
Prepared Dishes and
Flour Milling Processed Food Flour Milling Processed Food
Others Segment Other Prepared Foods Others Segment
Segment Segment Segment Segment Segment
Percentage of net Percentage of
sales 45% 47% 8% net sales
42% 32% 21% 5%
Percentage of Percentage of
operating profit 36% 47% 17% operating profit
23% 56% 5% 16%
12III. Individual Group Business Responses
to the Novel Coronavirus Pandemic
and Long-term Vision “NNI ‘Compass
for the Future’” Initiatives
131. Outlook for the Domestic Flour Milling Business and
Performance Recovery Initiatives
• The impact of the novel coronavirus pandemic caused the scale of Japan’s wheat flour market to shrink in fiscal 2021.
The Company also saw shipment volume decline 2.3% year on year. Sales revenue also deteriorated, causing
performance to struggle.
• While the market environment remains shrouded in uncertainty in the current term due to the pandemic, we are taking
steps to boost shipment volume by around 1% year on year and spur performance recovery. However, due to the
impact of the pandemic on the market environment, and in light of subsequent changes in the market environment, we
will pursue measures for achieving a full-scale recovery in performance over roughly 2 to 3 years, including the
current term.
Comparison of Nisshin Seifun Group shipments and overall Operating profit outlook– domestic flour milling business
shipments for the flour milling industry (year on year)
(Billions of yen) Decline in operating profit
Nisshin Seifun Group Flour milling industry 8 mainly from worsening
(Year on year) sales revenue
101% 7
100%
99%
98% 6 Return to FY20 level unlikely
97% despite enactment of
FY2019 FY2020 FY2021 FY2022 various measures in FY22
(forecasts) 5
FY2019 FY2020 FY2021 FY2022
* Shipments for the flour milling industry from the Flour Milling Promotion Association.
FY2021 figures based on Company forecasts (forecasts)
Outlook for sales revenue (shipment volume + sales expansion Major initiatives for performance recovery
costs) (year-on-year change)
(1) More robust sales capabilities through sales structure enhancement
(Billions of yen) • Assign technology sales staff to Sales Division in an effort to further strengthen
1.0 Group-wide capabilities in sales.
0.5 • Conduct further market segmentation, and identify and respond more
0.0 meticulously to growth markets in order to accurately grasp the changing
market and implement alert, agile responses.
(0.5)
(2) Reinforce product-related measures
(1.0)
• Strengthen the backup system for sales expansion by enhancing measures for
(1.5) the creation of demand and the development of new products tailored to high
(2.0) health consciousness as a specific market need.
(2.5) (3) Strengthen cultivation of latent markets
FY2021 FY2022 FY2023 FY2024 • Extend nationwide measures enacted in the Tokyo metropolitan area to
(forecasts) (forecasts) (forecasts) develop latent markets.
142. Overseas Flour Milling Business Growth Strategies (1)
– Outlook for the Overseas Flour Milling Business
• In the U.S. flour milling business, after intense sales competition caused performance to falter in FY2020, a V-shaped
recovery emerged in FY2021. We plan to solidify this performance recovery over the next 1 to 2 years, with sights on
further growth.
• In the Australia flour milling business, benefits are already emerging from measures targeting a host of issues ahead
of a recovery in performance. While the market environment remains unclear due to the novel coronavirus, we will
take steps to spur a performance recovery and build a growth base over 2 to 3 years
• We will take steps to create global synergies, strengthening global ties centered on our headquarters in Tokyo
Overseas Flour Milling Business - Operating Profit (Before Amortization of Goodwill, etc.)
Aiming for
(Billions of yen) Some degree performance
10 of recovery
Entered recovery and
expected in
Profit before amortization of goodwill, etc. Australia
Australia
further
market growth
business
8 Struggling
Acquired Australia
1 plant in business
Thailand
6
U.S. sales competition
Acquired 8.4
and higher costs
4 U.S.
4 Entered New plants 6.4 8.1
Zealand
Entered market
5.0 4.9 Performance
2 U.S. 4.4 4.0 in U.S.
market 3.5
2.4 business is
recovering
1.1
0
FY2013 FY2014 FY2015 FY2016 FY2017 FY2018 FY2019 FY2020 FY2021 FY2022 ~
(forecasts)
152. Overseas Flour Milling Business Growth Strategies (2)
– U.S. Flour Milling Business
Performance recovery and outlook for the U.S. flour milling business (Miller Milling Company, LLC)
About the FY2021 Recovery in Business Performance U.S. flour milling business plant locations (5 plants) and competitive
environment by area
Continued sales price revisions
• Steadily implemented sales margin improvements based on in-depth, Pacific Mountain North Central Eastern
cumulative sales activities and relationships of trust with clients
Production efficiency improvement
• New Prague Plant in Minnesota closed in December 2019, leading to California area
more efficient production structure. Concentration of management
resources in growth regions. 3 plants
• 7 Competitors South Central
• Production engineers from Japan are sent to sites abroad to • 2nd ranked Virginia area
strengthen sharing of Japanese production expertise. production capacity Texas area
1 plant
This is raising the quality of manufacturing operations, leading to share in state 1 plant • 6 Competitors
• Population growth • 6 Competitors
improved productivity. rate 0.5% • 2nd ranked
• Top ranked
production capacity
Cost reductions for raw materials realized production capacity share in the state
• Raw material costs successfully reduced in 1Q of FY2021 share in state • Population growth
• Population growth rate 0.3%
rate 1.5%
• From the U.S. Census Bureau
Realized V-shaped recovery in performance • Production capacity share based on the Company’s estimates from GRAIN & MILLING ANNUAL 2021
Business outlook for FY2022 U.S. Flour Milling Business Operating Profit (YoY Change)
(1) Ongoing sales price revisions and productivity improvements • Slump in sales • V-shaped recovery • While FY2022 will see the
margins due to in business continuation of price revisions
• Continue efforts to improve sales margins and productivity intense sales performance from and other measures, the impact
(Billions of competition various measures of plant closure by a major
(2) Impact of plant closure by major client yen) • Rise in certain costs taken client is expected to result in a
• A major client shuttered one of its plants at the end of March 2021 2
temporary but slight dip in
earnings
1
• While the closure of a plant by a major client is expected at this 0
time to cause a slight year-on-year decrease in earnings in the
current term, we will work toward a recovery in shipments in the (1)
U.S. business overall to make the decrease temporary (2)
• Solidify the recovery in performance over 1 to 2 years, including FY2020 FY2021 FY2022 (forecasts)
the current term * Includes decline in amortization of goodwill, etc. accompanying impairment of ¥0.4 billion in
FY2020 and FY2021, respectively
162. Overseas Flour Milling Business Growth Strategies (3)
– Performance Recovery Initiatives for the Australia Flour Milling Business
• Measures to spur a recovery in performance in the Australia flour milling business are the Group’s highest priority
• While the sales environment remains obscured due to the pandemic, we continue in the current term to enact various
sales-, production- and cost-side measures to spark some degree of recovery in performance
• Initiatives over 2 to 3 years, including the current term, to promote recovery in business performance and establish a
growth base
Projected
Performance contribution to
Recovery Measures
Specifics earnings growth
in current term
Sales expansion in Australia
• Completion of reinforcement of backup system to promote sales expansion by bolstering product development
personnel
• Strengthen proposals to existing prepared mix and bakery-related ingredient customers, and expand sales to
(1) Sales-side new customers
Export expansion Approx. 40%
initiatives
• Leverage the Group’s sales channels and other assets to increase exports to New Zealand, Southeast Asia
and other markets
* While the competitive environment in Australia has not changed drastically compared to before the novel coronavirus, a portion of shipments
of prepared mix to a major client was lost in the fourth quarter of the previous year; this is likely to have a modest impact on the speed of
performance recovery this term
Productivity improvement measures enacted in the previous term
(2) Production- • Review of personnel, consolidation of low productivity lines, establishment of new organization to reduce
side waste loss, etc. Approx. 40%
initiatives New productivity improvement measures scheduled for the current term
• Promotion of production line automation, higher productivity through lower personnel costs, etc.
Distribution and storage cost reductions
(3) Cost-
• Realize additional benefits via distribution improvement project
reduction
Procurement cost reduction Approx. 20%
measures
• Lower procurement costs for auxiliary materials, etc.
(Billions of yen) Aiming to recover roughly
50% of the reported Australia
Australia flour 2 reduction in earnings in
1 FY2021 flour milling Approx. 60% Prepared mix
milling business 0 business
Bakery-related ingredients
– Operating profit (1)
– Net sales Approx. 40% Wheat flour
(year-on-year change) (2)
(3) FY2021 FY2022 (forecasts) composition 0% 50%
173. Overseas Processed Food Business Growth Strategies
– India Yeast Business
• Aim for business expansion by supplying high-quality products to the local market
• While preparations for launch of the India yeast business are moving forward, the scheduled start of
operations at the new plant remains undetermined at this time due to spread of the novel coronavirus
pandemic locally.
Status of preparations for launch of the India yeast India’s bakery market
business
• Due to the effect of the novel coronavirus pandemic, small and
Status of plant construction medium-sized bakeries have seen sales decline, against a
backdrop of labor shortages. Nevertheless, sales remain firm
• Construction of plant buildings and delivery of the bulk of machinery among major bakeries that primarily use fresh yeast. Further
completed growth can be expected going forward
• Presently, the schedule for the start of operations remains undetermined • There is no change in supply capacity for yeast in India, with
due to the impact of the novel coronavirus pandemic supplies of fresh yeast still insufficient; dry yeast is being imported
(Expected to begin within six months following redeployment of personnel
from Japan)
Oriental Yeast India Pvt. Ltd. (subsidiary of Oriental Yeast Co., Ltd.)
Sales
Outstanding technology from
• Sales launch of bread improvers, others India market growth potential
Japan
• Striving to develop routes ahead of yeast sales through sale of bread
improvers, cake gelatin and cake mixes High growth anticipated for yeast Supply cost-competitive, high-quality
business in India’s enormous bread products
• Launch of online technology sales together with product line introductions market
Personnel-related Comprehensive environmental
Prime location
countermeasures
• Implement a sequence of broad-based training. Aim for smooth business
launch Build plant in outskirts of Pune, a Zero Liquid Discharge System for
location rich in molasses (key plant
ingredient) and water resources
Aim for profitability one year from start of operations Oriental Yeast India Pvt. Ltd. [Overview of new plant]
(sales office)
Location:
New plant under construction India Maharashtra, India
Production capacity:
100 t/day (fresh yeast basis)
Investment:
New yeast plant
Approx. ¥15.7 billion
184. Processed Food Business Growth Strategies
Taking market changes into account, promote a strategy for higher added value built around the
concepts of “Easy-to-prepare and convenient,” “authentic” and “healthy” in household-use processed
foods, with environmental sustainability in mind.
Market trends in Japan related to processed food (FY2021) New products to meet rising at-home dining demand
• Restaurant demand is declining while demand for at-home dining is up, • With cooking at home on the rise, launched in the spring new and
largely due to orders to refrain from unnecessary outings revamped products under the “Smart Dining at Home” theme of making
220%
cooking fun, including 36 room-temperature and 13 frozen food products,
SRI price: Household-use wheat flour*1 based on the concepts of “easy-to-prepare and convenient,” “Restaurant
SRI price: Pasta*1 dining at home” and “Parent and child homemade cooking”
180%
SRI price: Frozen pasta (individual serving)*1 Pursuit of simplicity Bolster menu variation
140% Restaurant sales year on year*2
100%
60%
Apr. May Jun. Jul. Aug. Sep. Oct. Nov. Dec. Jan. Feb. Mar.
*1 Source:Intage SRI; SRI price is a year-on-year comparison of the overall market price each month/four
weeks
*2 Source:Japan Food Service Association – JF Restaurant Industry Market Trend Research
Ma-Ma Hayayude Spaghetti FineFast Measures for frozen food business expansion
• Fast-cooking Hayayude Spaghetti continues to consistently perform briskly • Strive for business expansion by continuing development of value-added
• Release of a new high-protein type product products centered on “easy-to-prepare and convenient,” “authentic” and
“healthy,” cost reductions, and strengthening production and distribution
systems.
Hayayude Series Sales
(Billions of Source: Intage SRI Measures Details
yen)
Approx. 10-fold • Hold both sides of the market through value-added product
growth in 9 years since Bolster frozen pasta measures and cost reductions for regular products, in a bid to
4 2011 revamp maximize sales and earnings.
3
Strengthen lineup of • Launch new sales of pho, well-known from Vietnamese cuisine,
2 non-pasta products and other products
1 Strengthen
• Strengthen production sites to build a robust supply system
0 production and
• Boost distribution efficiency through a review of delivery routes
New (high-protein type) '11 '12 '13 '14 '15 '16 '17 '18 '19 '20 distribution systems
195. Prepared Dishes and Other Prepared Foods Business Growth
Strategies
– Becoming a Comprehensive Producer of Prepared Dishes and Other Prepared Foods
• While earnings fell by ¥0.5 billion year on year in FY2021 due to the impact of the novel coronavirus pandemic,
stronger initiatives targeting productivity improvements, various cost reductions and other areas secured earnings
growth in the second half of the year
• There is no change in direction in our growth strategy – plans for FY2022 call for achieving a recovery in business
performance as soon as possible through a rebound in sales and promoting greater production system efficiency
Prepared dishes and other prepared foods business Promote practical realization of automation technology at prepared
– Operating profit (year-on-year change) dish plants
(Billions of yen)
Earnings growth through productivity Aim for recovery in In pursuit of an ideal
Decline in demand for
improvements (workforce rightsizing and business performance model for future
reallocation, etc.), costs improvements, by building a lean
prepared dishes in including various cost reductions, and management structure prepared dish plants, we
1.5 urban areas and tourist higher sales of seasonal New Year’s made strides in
resorts following dishes (third quarter)
1.0 declaration of a state of examining ways to put
emergency automation technology
0.5
into practice
0.0
Triple productivity through
(0.5) adoption of automated Aim to establish
machinery technology in phases
(1.0) over roughly 3 to 5 years,
and smoothly roll out
(1.5)
automation technologies
FY2021 FY2021 FY2021 FY2022 Example of automation adoption: “Self-measuring rice serving machine”
1st Half 2nd Half Full Year Full Year (forecasts) Automatically measures and serves up rice based on tray shape
Initiatives for recovery in business performance and further profit growth
Toward a more efficient production system Toward further profit growth
(1) Review production sites for each product, switch out and replace (1) Develop and cultivate premium priced and high-added-value products
product categories between plants to meet demand for filling meals and health conscious eating
⇒ Boost production line operating efficiency at each plant (2) Strengthen product development built on improved deliciousness and
(2) Promote reduced labor requirements and greater efficiency through longer shelf life
ongoing investments in automation ⇒ Improve profitability through lower production and sales loss
⇒ Boost production line productivity (3) Expand sales of frozen prepared dishes
(3) Review number of manufacturing SKUs (4) Reinforce e-commerce sales of seasonal New Year’s dishes
⇒ Reduce switchover time for production lines
206. Demand Trends for Raw Material for Pharmaceuticals “EPA-
E” from Nisshin Pharma
• VASCEPA® from Amarin Corporation plc (“Amarin”) saw sluggish growth in prescriptions, as fewer
patients in the U.S. visited medical facilities due to the novel coronavirus pandemic
• In the current term, EPA-E shipments are likely to decline briefly, as we carefully monitor uncertainty
surrounding sales of VASCEPA® and growth in Amarin’s product inventory, among other factors
• Over the medium term, Amarin sales are projected to increase as the novel coronavirus contracts and
sales approval in Europe and other markets is granted
Amarin Recent Topics Amarin Net Sales
• Growth in prescriptions for VASCEPA® were sluggish, as fewer patients (US$ mn)
visited medical facilities due to the novel coronavirus pandemic Year-on-year growth of 43% in 2020
700
Outlook for 2021 undisclosed at this time 614
• Following the start of sales of generic versions in the U.S. (Nov. 2020), 600
Amarin sued generic drug manufacturer and insurers for patent infringement 500 430
of its additional indications, with the outcome of litigation still pending
400
• Due mainly to uncertainty stemming from the novel coronavirus, Amarin did 300
not disclose sales projections for 2021 229 Undisclosed
200
181
• As of March 31, 2021, Amarin’s product inventory had increased, which is 82 130
expected to affect our EPA-E shipments in the current term 100 54
0
• Sales approval granted in Europe as of March 31, 2021
2014 2015 2016 2017 2018 2019 2020 2021 (forecasts)
Regarding Business Development by Amarin in the European Business Opportunities and Risk Recognition
Market
Opportunities
• Development in Europe is under the drug name VAZKEPA, with sales starting
in Germany. Sales expected to begin in Germany by September 2021 • Demand growth in the U.S. (Effect of additional indication)
• Amarin will handle sales in the European market. Sales efforts in Germany • New development in other countries/regions (Europe, China)
will start with a 150-person structure • Increase in number of patients suffering from cardiovascular disease
• In Europe, sales approval must be granted by each country; procedures to worldwide
seek approval in countries outside of Germany are currently underway
Risks
• After sales approval is granted, Amarin will receive exclusive rights to sell in
Europe for 10 years • Fewer patient visits to medical facilities due to the novel coronavirus
• Estimates suggest that the number of patients in the European market, at 44 • Increase in sale of generic medication
million, is greater than that of the U.S. Accordingly, demand for raw materials • Intensifying competition in the EPA-E pharmaceutical raw material
for pharmaceuticals is expected to expand market from new entrants
217. Others Segment Status
• The engineering business saw a decline in completion of projects in FY2021, reflecting a temporary decrease in
facility construction. However, facility construction completion is likely to rebound to some degree in the current term.
• In the mesh cloth business, while sales of chemical products and others to automotive component manufacturers fell
in FY2021 due to the effect of the novel coronavirus pandemic, we are aiming for further business growth this term by
bolstering sales to growth markets
• For the pet food business, we transferred the business on March 31, 2020, continuing to produce pet food as an
outsourcer since that time. However, this outsourced production was terminated on March 31, 2021. This business is
now completely concluded.
Others Segment Net Sales, Operating Profit Engineering business
• Receive orders for various production plants, including for food, cosmetics,
(Billions of yen) (Billions of yen) metal and electronic materials, leveraging user-oriented plant design and
5.0 70 world-class powder and granular material technology as strengths
• The effect of the novel coronavirus pandemic on plant demand over the
medium term differs depending on the client industry. However, taken as a
whole, the impact on the engineering business’ target market is not
4.5 expected to be significant.
60
(Net sales: Right axis)
Mesh cloth business
4.0 • Sales of chemical products and others for automotive component
50 manufacturers are expected to recover in the current term
• Promote the development, production and sale of high-performance
3.5 products for growth markets, specifically related to 5G communications,
electrode printing for solar panels, environmental components and
40 hygiene-related products.
• Pursue business expansion by strengthening the planning and
3.0 development of infection-fighting products and materials using proprietary
“Cufitec®” anti-viral technology
30
2.5 Pet food business
(Operating profit: Left axis) • Due to conclusion of the business, lower revenue this term since no sales
will occur
2.0 20 • Employees from the production and management divisions of the pet food
FY2016 FY2017 FY2018 FY2019 FY2020 FY2021 FY2022 business will be reassigned to other operating companies. This is
(forecasts) projected to lead to a temporary increase in personnel costs at other
operating companies
228. Initiatives for Sustainability (1)
• The Nisshin Seifun Group has identified five high-priority issues to address in the effort to realize
both sustainable social development and long-term improvement in corporate value.
• The aim is to generate social value for cyclical growth through business by viewing social issues as
new business opportunities.
Process for identifying priority issues
The process below was used to select roughly 60 key issues, culminating in identification of five focus areas.
STEP1 STEP2 STEP3 STEP4
Examine issues based on international Organize the issues by analyzing Assess stakeholder interest Assess the potential impact on our
norms and surveys of SRI evaluation their value chains business
organizations
Five Priorities Fields contributing to SDGs
Provide safe and healthy food and responsible consumer information
• Maintenance of food product safety
• Responsible communication with consumers
• Contribution to healthy diets
Enable secure and sustainable raw material procurement
• Promotion of responsible procurement policies, etc.
Efficiently handle product and packaging waste
• Reduction of food product waste
• Reduction in use of fossil fuel-derived plastics for product packaging, etc.
Prepare for climate change and water resource issues
• Improvements in energy efficiency, reductions in CO2 emissions, development of energy-saving
technologies, phased abolishment of HFC-based refrigerants
• Respond to water-related risks; reduction in water usage, etc.
Provide work environments that are healthy and fulfilling
• Promotion of working style reforms
• Diversity promotion, appropriate worktime management, prohibition of harassment
• Prevention of corruption and bribery, etc.
238. Initiatives for Sustainability (2)
• We are promoting specific initiatives targeting high-priority issues. Regarding “Efficiently handle
product and packaging waste,” “Prepare for climate change and water resource issues” and others in
particular, we will formulate long-term objectives during the current term to accelerate the roll out of
initiatives.
• Ahead of support for TCFD recommendations, we are currently analyzing the impact of climate
change on the Group and our response.
Provide safe and healthy food and responsible consumer communication
• Initiatives for the stable supply of safe and reliable products, the Group’s mission, are positioned first and foremost
• Extensively ensure quality from the consumer’s perspective. Confirm presence of this mechanism through quality assurance audit
• Obtain and maintain international standard for “food management system” certification (ISO22000, FSSC22000)
Enable secure and sustainable raw material procurement
• Promote stable procurement of wheat and sustainable procurement of raw ingredients and materials
• Based on a responsible procurement policy, and working together with suppliers, conduct responsible procurement activities guided by fair and ethical
transactions
Efficiently handle product and packaging waste
• Achieved zero emissions for food waste from Company sites in FY2014 and maintained status since
• In the current term, establish targets for food waste, including in the supply chain, taking steps to achieve further reductions while working in cooperation
with suppliers
• Move to develop refillable products and adopt plant-derived materials in order to reduce the environmental burden posed by packaging waste.
Furthermore, set targets during this term to reduce the usage of fossil fuel-derived plastics in product packaging
Prepare for climate change and water resource issues
• As a response to climate change, during the current term review medium-term objectives for 2030 and formulate long-term objectives of achieving carbon
neutrality in 2050
• In the current term, formulate long-term targets in response to water resource issues and promote reduction in water usage
Provide work environments that are healthy and fulfilling
• Promote diversity. In particular, position the advancement of women in the workplace as part of management strategy and as a key pillar for the Group.
Establish targets for the percentage of women in management, taking steps to accelerate the appointment of female employees to higher-level positions
• In 2021, obtained certification by the White 500 list of good corporations displaying health and productivity management. We are currently promoting
health-supportive management, with the aim of being viewed as a healthy and worthwhile place to work by employees
24(Ref.) The Wheat Market
25The Wheat Market (1)
[Grain Market Trends] Chicago Futures Market (US$/Bu)
- 17.00
Rise in market prices in step with active
Amid favorable wheat inventories purchase of grain by China and tax hike
worldwide, a 4th consecutive year of on wheat exports by Russia - 16.00
record-breaking harvests for wheat
production in 2016. Corn and soybean - 15.00
Sharp growth in corn and soybean markets
harvests also broke records after a two-
driven by large contracts from China
year lull
Concern over worsening US spring wheat - 14.00
crop conditions
Concern over worsening US
winter wheat crop conditions; US - 13.00
Soybeans spring wheat planting delayed
Abundant harvest of
2019 corn and
soybeans - 12.00
US-China Trade Friction
Favorable global wheat
inventories continue
- 11.00
- 10.00
- 9.00
- 8.00
Wheat Concern over
spring wheat crop Concern for crop conditions due to
Concerns of worsening crop conditions
due to rainfall during spring wheat - 7.00
conditions in US dry weather along Black Sea harvest in the United States and arid
coastal areas and parts of Australia conditions in Australia
Corn - 6.00
- 5.00
- 4.00
- 3.00
1 2 3 4 5 6 7 8 9 10 11 12 1 2 3 4 5 6 7 8 9 10 11 12 1 2 3 4 5 6 7 8 9 10 11 12 1 2 3 4 5 6 7 8 9 10 11 12 1 2 3 4 5 6 7 8 9 10 11 12 1 2 3 4
2016年
2016 2017年
2017 2018年
2018 2019年
2019 2020年
2020 2021年
2021
Note: The background colors of the graph denote period for calculation of wheat sales price by Japan’s Ministry of Agriculture, Forestry and Fisheries
26The Wheat Market (2)
[Apr. 2021: Wheat price revisions]
(Period for price revision calculation: 2nd week of Sept. 2020 to 1st week of March 2021)
Market prices for wheat (Chicago) rose on several factors. Most prominent among these was the enormous
purchase by China of wheat from the U.S. and Canada, two major wheat producers, and a tax hike on wheat
exports by Russia, coupled with concerns over the impact on wheat growth of a cold snap that struck the
central United States in mid-February. While the currency market saw a somewhat higher yen, the import
price of wheat rose primarily atop higher maritime freight costs.
April 1, 2021 – Japanese government’s price for five classes of imported wheat rose
by an average of 5.5%
June 19, 2021 – Nisshin Flour Milling Inc. to raise prices for commercial-use wheat
flour
[Factors Driving Future Wheat Market Changes]
Price-increasing Factors Price-decreasing Factors
• Enormous purchase of North American wheat and • Favorable harvest outlook for 2021 North America
other grains, reflecting growth in grain demand winter wheat
from China • Possible abolishment of export tax hike and other
• Concerns of worsening harvest conditions for export control mechanisms by Russia
2021 North America spring wheat in line with
trending drier conditions
27Fiscal 2021
Results Briefing
Results, Forecasts
May 19, 2021
Nisshin Seifun Group Inc.Contents
1. Fiscal 2021 Results
2. Analysis of Segment Results
3. Non-operating Income (Expenses) /
Extraordinary Income (Losses) (Results)
4. Statements of Cash Flows (Results)
5. Fiscal 2022 Forecasts
11. Results for Fiscal Year Ended March 31, 2021 (1)
* Figures rounded down to nearest million yen
Fiscal 2020 Fiscal 2021
(Millions of yen) YoY YoY Forecasts Forecasts
Results Results
difference change difference change
Net sales 712,180 679,495 (32,685) (4.6)% (20,504) (2.9)%
[Overseas sales] [166,188] [155,626] [(10,562)] [(6.4)%] [(2,173)] [(1.4)%]
Flour Milling 306,745 285,798 (20,947) (6.8)% (7,201) (2.5)%
Processed Food 217,959 214,710 (3,249) (1.5)% (1,289) (0.6)%
Prepared Dishes and
129,967 142,747 +12,779 +9.8% (3,252) (2.2)%
Other Prepared Foods
Others 57,507 36,240 (21,267) (37.0)% (8,759) (19.5)%
Operating profit 28,852 27,197 (1,655) (5.7)% +1,197 +4.6%
[Overseas operating profit] [3,878] [2,959] [(918)] [(23.7)%] [(140)] [(4.5)%]
Flour Milling 9,326 6,317 (3,008) (32.3)% +317 +5.3%
Processed Food 12,895 15,350 +2,455 +19.0% (149) (1.0)%
Prepared Dishes and
1,736 1,278 (457) (26.4)% +678 +113.1%
Other Prepared Foods
Others 4,698 4,240 (458) (9.8)% +440 +11.6%
Adjustments* 194 9 (185) – (90) –
Ordinary profit 31,434 29,886 (1,547) (4.9)% +2,886 +10.7%
Profit attributable to owners of
22,407 19,011 (3,395) (15.2)% +2,011 +11.8%
parent
(Ref.) * Intersegment transaction eliminations
Operating profit before
37,241 35,394 (1,846) (5.0)% +1,194 +3.5%
amortization of goodwill, etc.
ROE 5.6% 4.6% (1.0)% – +0.3% –
21. Results for Fiscal Year Ended March 31, 2021 (2)
Net sales decreased due to several factors.
Net sales Operating profit
These included a decline in sales in the flour
(Billions of yen) (Billions of yen) milling business, largely reflecting lower wheat
flour prices due to price revisions for wheat and
28.8
800
712.1
30
26.9 27.1 decreased demand caused by the pandemic,
679.4 coupled with a temporary decrease in facility
565.3 construction completion and effects from the
600
transfer of the pet food business. These factors
20
outweighed beneficial effects from the new
400 consolidation of Tokatsu Foods Co., Ltd. in the
first quarter.
10 Operating profit was lower for the year despite a
200 recovery in performance in the U.S. flour milling
business, robust shipments in Japan of
household-use processed foods and raw
0 0 materials for pharmaceuticals, along with a
FY2019 FY2020 FY2021 FY2019 FY2020 FY2021 reduction in various expenses. This decline
mainly reflected reduced profit in the flour milling
Profit attributable to owners of business (Japan, Australia, etc.) from lower
Ordinary profit demand and other issues caused by the
parent
pandemic, coupled with a decline in sales in the
(Billions of yen) (Billions of yen)
prepared dishes and other prepared foods
40 25 business, and a temporary decrease in facility
22.2 22.4
construction completion.
32.0 31.4 19.0 On the other hand, business forecasts were met
29.8 20
30 thanks to improved production efficiency in the
prepared dishes and other prepared foods
15 business and beneficial effects from cost
20 reductions across all businesses.
10
Net sales: YoY changes (4.6)%
10
5 Operating profit: YoY changes (5.7)%
Ordinary profit: YoY changes (4.9)%
0 0 Profit attributable to owners of parent:
FY2019 FY2020 FY2021 FY2019 FY2020 FY2021 YoY changes (15.2)%
* Figures rounded down to nearest 100 million yen
3You can also read