Film thickness frequency distribution of different vehicles determines sunscreen efficacy
←
→
Page content transcription
If your browser does not render page correctly, please read the page content below
Film thickness frequency distribution
                 of different vehicles determines
                 sunscreen efficacy

                 Myriam Sohn
                 Adeline Hêche
                 Bernd Herzog
                 Georgios Imanidis

Downloaded From: https://www.spiedigitallibrary.org/journals/Journal-of-Biomedical-Optics on 02 Jun 2021
Terms of Use: https://www.spiedigitallibrary.org/terms-of-use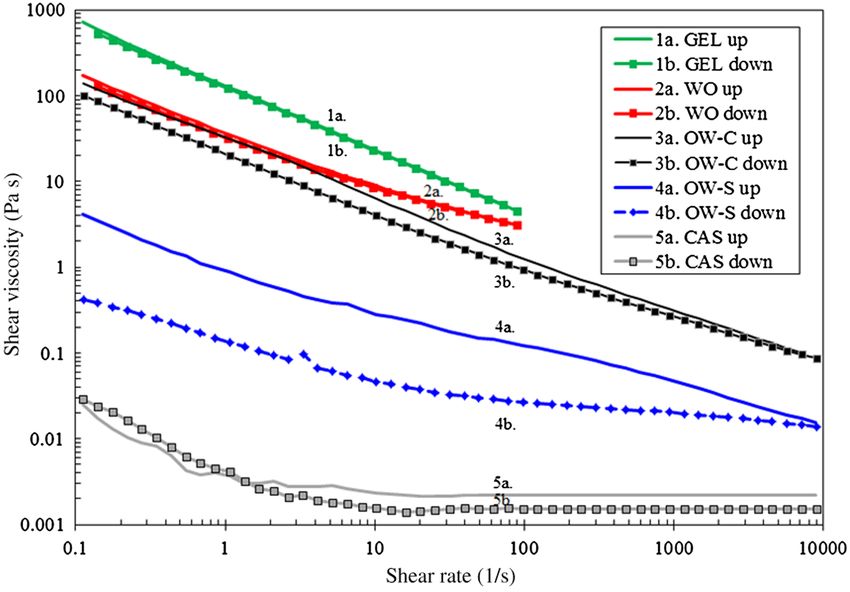
Journal of Biomedical Optics 19(11), 115005 (November 2014)

                Film thickness frequency distribution of different
                vehicles determines sunscreen efficacy
                Myriam Sohn,a,b Adeline Hêche,b Bernd Herzog,c and Georgios Imanidisa,b,*
                a
                  University of Applied Sciences and Arts Northwestern Switzerland, School of Life Sciences, Institute of Pharmaceutical Technology,
                Gründenstrasse 40, 4132 Muttenz/Basel, Switzerland
                b
                  University of Basel, Department of Pharmaceutical Sciences, Klingelbergstrasse 50, 4056 Basel, Switzerland
                c
                  BASF GmbH, Köchlinstrasse 1, 79639 Grenzach-Whylen, Germany

                              Abstract. Sun protection factor (SPF) frequently differs between sunscreens containing the same composition
                              of ultraviolet (UV) filters that primarily define sunscreen efficacy. We tested the hypothesis that the thickness
                              frequency distribution of the sunscreen film is also responsible for and can explain the divergence in the mea-
                              sured SPF. For this, we developed a method to measure film thickness from the difference of topography before
                              and after application of 2 mg∕cm2 of sunscreen on pig ear epidermal membrane. The influence of five vehicle
                              formulations and of application pressure and spreading time on mean thickness (S mean ), S mean to median ratio,
                              and SPF in vitro was investigated. The vehicle had a significant impact, low vehicle viscosity resulting in a
                              smaller S mean , larger S mean to median ratio, and lower SPF in vitro than high viscosity; continuous oil phase
                              produced the largest S mean and SPF values. A long spreading time reduced S mean and SPF and increased
                              application pressure reduced SPF. There was a positive correlation between S mean and SPF in vitro, underlining
                              the relevance of film thickness for interpreting UV protection differences of formulations with the same filter com-
                              position. This work demonstrated a strong influence of vehicle and application conditions on sunscreen efficacy
                              arising from differences in film thickness distribution. © 2014 Society of Photo-Optical Instrumentation Engineers (SPIE) [DOI: 10
                              .1117/1.JBO.19.11.115005]

                              Keywords: sun protection factor in vitro; film thickness; film homogeneity; pig ear skin; vehicle; sunscreen application.
                              Paper 140476R received Jul. 23, 2014; revised manuscript received Sep. 22, 2014; accepted for publication Sep. 22, 2014; published
                              online Nov. 18, 2014.

                1     Introduction                                                                 condition can never be reached under in vivo condition of appli-
                Topically applied sunscreens constitute a suitable and com-                        cation due to the skin surface topography. Skin relief shows
                monly employed measure to protect skin from sun damages.1,2                        ridges and furrows that preclude the formation of an even sun-
                Efficacy of sunscreens in terms of sun protection factor (SPF),                    screen film.18 In addition, manual application makes it practi-
                ultraviolet A (UVA) protection, photostability, and balanced                       cally impossible to achieve a uniform film. This irregularity
                                                                                                   of the film thickness is probably a cause of the reported exper-
                absorbance depends primarily on the intrinsic absorbance and
                                                                                                   imental variability of SPF and was suggested to be responsible
                photostability properties of ultraviolet (UV) filters contained
                                                                                                   for the divergence of orders of magnitude between predictions
                in the product in conjunction with the used concentration.3,4
                                                                                                   based on UV transmission of dilute transparent filter solutions
                The ideal sunscreen achieves balanced protection by equally
                                                                                                   and clinical study results.19
                attenuating ultraviolet B (UVB) and UVA radiations, similar
                                                                                                       The aim of the present work was to understand the relation-
                to the protection afforded by clothing and shade.5,6
                                                                                                   ship between film thickness frequency distribution and efficacy
                Therefore, an appropriate UV filter system should combine
                                                                                                   of sunscreens. To this end, we developed a method for determin-
                UVB and UVA filters to achieve an optimized UV shield.7
                                                                                                   ing the precise thickness distribution of the applied sunscreen
                Reasonably, the amount of product applied also affects protec-
                                                                                                   film based on topographical measurements with high spatial res-
                tion.8–12 However, SPF frequently differs between sunscreens
                                                                                                   olution. We used the epidermal membrane of pig ear skin as a
                with different vehicle formulations containing the same filter
                                                                                                   biological substrate for in vitro sunscreen application as we
                composition,3,13 yet the cause of this difference has
                                                                                                   recently showed that using this substrate for SPF in vitro testing
                not been investigated. Also, in vitro interlaboratory trials
                                                                                                   provided better prediction of SPF in vivo than conventionally
                with the same sunscreen have produced variable results14 and
                                                                                                   used synthetic substrates. Substrate-to-product affinity rather
                the application procedure was further found to influence the
                                                                                                   than topography was discussed to be responsible for this better
                measured SPF.15,16 In addition to the absorbing property of
                                                                                                   prediction of SPF in vivo.20 The skin of pig ear has also been
                the UV filters and the amount of applied product, the homo-
                                                                                                   used for in vitro assessment of UV-induced damages on DNA,21
                geneity of distribution of the sunscreen was found to play an
                                                                                                   UV filter penetration,22,23 and sunscreen photostability tests.24
                important role with respect to SPF in vivo.17 The ideal situation
                                                                                                   Using the developed film assessment method we investigated
                for optimal performance is to achieve a film with uniform thick-
                                                                                                   the sunscreen film residue in terms of thickness and homo-
                ness, resembling the perfectly homogeneous distribution of a
                                                                                                   geneity of distribution for five sunscreen vehicles and different
                solution of UV filters in an optical cell. Understandably, this
                                                                                                   application conditions. In parallel, we measured SPF in vitro on
                                                                                                   the same preparations to determine UV protection efficacy. The

                *Address all correspondence to: Georgios Imanidis, E-mail: georgios
                 .imanidis@fhnw.ch                                                                 0091-3286/2014/$25.00 © 2014 SPIE

                Journal of Biomedical Optics                                               115005-1                                     November 2014   •   Vol. 19(11)

Downloaded From: https://www.spiedigitallibrary.org/journals/Journal-of-Biomedical-Optics on 02 Jun 2021
Terms of Use: https://www.spiedigitallibrary.org/terms-of-use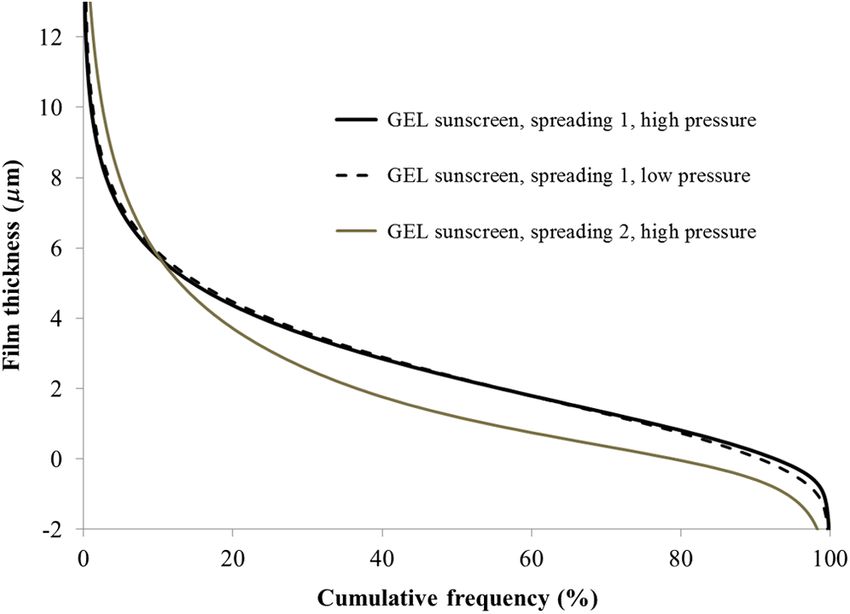
Sohn et al.: Film thickness frequency distribution of different vehicles determines sunscreen efficacy

                impact of vehicles with the same UV filter combination and of                      90 s. The epidermal membrane was separated from the dermis
                the application conditions on film parameters and SPF in vitro as                  by gentle peeling off, cut to a dimension of 2 × 2 cm2 , laid flat
                well as the correlation between film parameters and SPF in vitro                   on quartz carrier plates, and stored at 4°C in a desiccator over
                was then assessed. Identification of formulation and application                   saturated potassium carbonate solution until use.
                related factors that may impact film characteristics and UV pro-
                tection was a further goal of the present work. This is put forth                  2.3     Characterization of Sunscreen Formulations
                as a fundamental aspect for understanding the mechanism of
                sunscreen efficacy.                                                                We assessed SPF in vitro and the film thickness distribution of
                                                                                                   five different sunscreens. The formulations included an oil-in-
                2     Materials and Methods                                                        water cream (OW-C), an oil-in-water spray (OW-S), a water-
                                                                                                   in-oil emulsion (WO), a gel (GEL), and a clear lipo-alcoholic
                2.1     Chemicals and Equipment                                                    spray (CAS). They contained the same UV filter combination
                                                                                                   and emollient. The filter system was composed of 8 wt. % OCR,
                The following reagents were used: potassium carbonate                              5 wt. % EHS, 2 wt. % BMDBM, 1 wt. % BEMT, and 1 wt. %
                from Sigma-Aldrich, St. Gallen, Switzerland; Tinosorb S abbre-                     PBSA. Based on this UV filter composition, an SPF in silico of
                viated BEMT (INCI, bis-ethylhexyloxyphenol methoxyphenyl                           25 was calculated with the BASF sunscreen simulator.25 The
                triazine), Uvinul N539T abbreviated OCR (INCI, octocrylene),                       detailed composition of the sunscreens and their respective
                Salcare SC 91, Cetiol AB, Lanette O, Dehymuls LE, Edeta BD,                        SPF in vivo values are given in Table 1. SPF in vivo values were
                all from BASF SE, Ludwigshafen, Germany; Eusolex 232                               measured in accordance with ISO24444:2010 guidelines.26
                abbreviated PBSA (INCI, phenylbenzimidazol sulfonic acid)                              The sunscreens showed different rheological characteristics
                from Merck, Darmstadt, Germany; Parsol 1789 abbreviated                            (Fig. 1). GEL had the highest shear viscosity followed by OW-C
                BMDBM (INCI, butyl methoxydibenzoylmethane), Amphisol                              and WO, whereas OW-S and CAS were much less viscous.
                K from DSM, Kaiseraugst, Switzerland; Neo Heliopan OS                              Viscosity of all sunscreens decreased with increasing shear
                abbreviated EHS (INCI, ethylhexyl salicylate) from Symrise,                        rate whereas hysteresis depended on the formulation.
                Holzminden, Germany; Arlacel 165 from Croda, East York-
                shire, England; Keltrol RD from CP Kelco, Atlanta, Georgia;
                                                                                                   2.4     Application of Sunscreen
                Carbopol Ultrez 10, Carbopol Ultrez 21 from Lubrizol,
                Brussels, Belgium; Tegin OV from Evonik Industries, Essen,                         We applied 2.0 mg∕cm2 of sunscreen nominally corresponding
                Germany; Paracera M from Paramelt, Heerhugowaard, The                              to a film thickness of 20 μm. The sunscreen was applied in form of
                Netherlands; beeswax white from Koster Keunen, Bladel,                             20 to 30 small drops evenly distributed over the skin surface and
                The Netherlands; glycerin from Sigma-Aldrich; tris amino ultra-                    manually spread with the fingertip using a presaturated finger
                pure from Angus, Buffalo Grove, Illinois; Phenonip from                            coat. Two spreading procedures were employed. In the first,
                Clariant, Muttenz, Switzerland.                                                    the sunscreen was spread on the specimen with light circular
                    Quartz plates with a size of 4.2 × 4.2 cm2 were obtained                       movements followed by left-to-right linear strokes from top to
                from Hellma Analytics, Zumikon, Switzerland.                                       bottom starting at each side of the specimen (designated spread-
                    The following equipment was used: electric shaver (Favorita                    ing 1); in the second, the complete linear stroke step was repeated
                II GT104, Aesculap, Germany), epilator (Silk-épil7 Xpressive                       four times (designated spreading 2). Spreading procedure 2
                Pro, Braun, Germany); water purification device (Arium 61215,                      resulted in a longer application time. Furthermore, the pressure
                Sartorius, Goettingen, Germany); precision balances (XS105                         used to distribute the product was varied for spreading 1 between
                Dual range and XA3001S, Mettler-Toledo, Columbus, Ohio);                           low and high, corresponding to a force of 100  14 and
                surface metrology instrument (Altisurf 500, Altimet, Thonon-                       281  35 g, respectively. These values represent extremes
                les-Bains, France); UV transmittance analyzer (Labsphere UV-                       used in the authors’ laboratory with this substrate preparation.
                2000S, Labsphere Inc., North Sutton, New Hampshire).                               The two pressure and spreading conditions were used solely
                    The following software packages were used: BalanceLink                         with the gel formulation (GEL). All other sunscreen formulations
                (Mettler Toledo, Columbus, Ohio) with balance XA3001S for                          were applied with high pressure and spreading procedure 1.
                the recording of pressure during spreading of sunscreen; Phenix
                and Altimap (Altimet, France) for topographical measurement                        2.5     Measurement of the SPF In Vitro Using
                and evaluation, respectively; UV-2000 (Labsphere Inc.) for UV                              Spectral Transmission of Ultraviolet Radiation
                transmittance measurement; Statgraphics centurion XVI soft-
                ware (Statpoint Technologies, Inc., Warrenton, Virginia) for                       Measurement of SPF in vitro is based on diffuse UV transmis-
                statistical evaluation.                                                            sion spectroscopy according to the approach proposed by
                                                                                                   Sayre et al.,27
                2.2     Preparation of Skin Substrate                                                             P400 nm
                                                                                                                         nm Ser ðλÞ:Ss ðλÞ
                                                                                                   SPFin vitro ¼ P400290
                                                                                                                      nm
                                                                                                                                            ;                       (1)
                We used the epidermal membrane of pig ears as a biological                                        290 nm Ser ðλÞSs ðλÞ:TðλÞ
                substrate for sunscreen application as described before.20
                Ears of freshly slaughtered pigs were obtained from the local                      where Ser ðλÞ is the erythema action spectrum26 as a function of
                slaughterhouse (Basel, Switzerland) not more than a few hours                      wavelength λ, Ss ðλÞ is the spectral irradiance of the UV source at
                postmortem. The study did not require the approval of the ethics                   wavelength λ,28 and TðλÞ is the measured transmittance of the
                committee of animal research as the ears were taken from pigs                      light through a sunscreen film applied on a suitable UV trans-
                not specifically slaughtered for the purpose of this study. The                    parent substrate at wavelength λ.
                epidermal membrane was isolated using a heat separation pro-                          For SPF determination, the spectral UV transmittance was
                cedure. The full skin was immersed in a water-bath at 60°C for                     registered from 290 to 400 nm in 1-nm increment steps through

                Journal of Biomedical Optics                                               115005-2                                     November 2014    •   Vol. 19(11)

Downloaded From: https://www.spiedigitallibrary.org/journals/Journal-of-Biomedical-Optics on 02 Jun 2021
Terms of Use: https://www.spiedigitallibrary.org/terms-of-use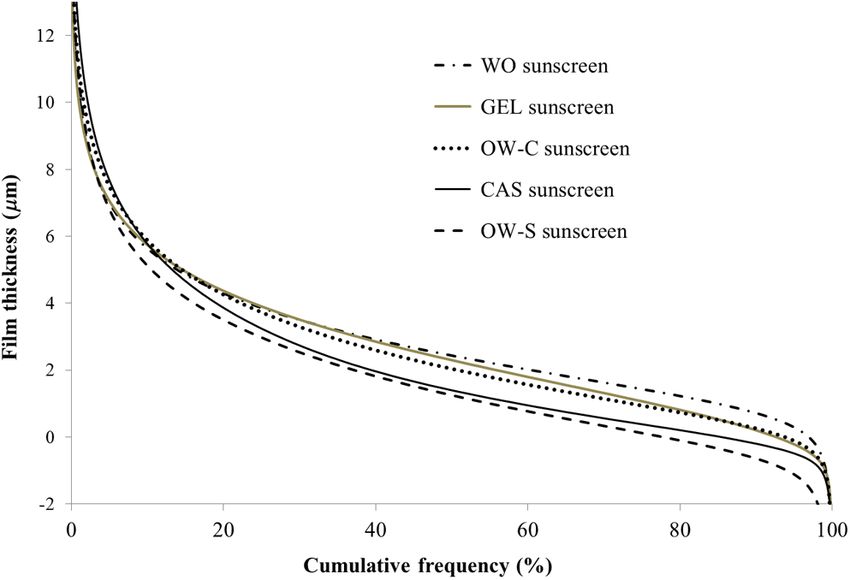
Sohn et al.: Film thickness frequency distribution of different vehicles determines sunscreen efficacy

                                         Table 1 Composition (wt. %) and sun protection factor (SPF) in vivo of investigated sunscreens.

                                                                             Oil-in-water        Oil-in-water                    Water-in-oil      Clear lipo-alcoholic
                Sunscreen designation                                      cream (OW-C)         spray (OW-S)        GEL         emulsion (WO)         spray (CAS)
                a
                 SPF in v ivo  SD                                            38.8  8              24  5        19.4  5        19.5  3.1            17.8  2.2

                Ingredient type              Trade name                                                         Composition (wt. %)

                Emulsifier system            Arlacel 165                         1.5                   —              —               —                        —

                                             Amphisol K                          1.5                  2.5             —               —                        —

                                             Dehymuls LE                          —                    —              —               1.0                      —

                                             Tegin OV                             —                    —              —               2.0                      —

                Thickener system             Lanette O                           0.5                   —              —               0.5                      —

                                             Keltrol RD                          0.15                  —            0.15              —                        —

                                             Salcare SC 91                       1.8                   —             1.8              —                        —

                                             Carbopol Ultrez 10                   —                    —             0.2              —                        —

                                             Carbopol Ultrez 21                   —                    —            0.15              —                        —

                                             Paracera M                           —                    —              —               0.5                      —

                                             Beeswax                              —                    —              —               1.0                      —

                Emollient                    Cetiol AB                           5.0                  5.0            5.0              5.0                      5.0

                Filter system                Mixture of UV filters               17.0                 17.0          17.0              17.0                 17.0

                Neutralizing agent           Tris Amino Ultra Pure                qs                   qs            qs               qs                       —

                                             Neutrol TE                           —                    —              —               —                        qs

                Additional ingredients       Glycerin                            3.0                  3.0            3.0              3.0                      —

                                             Edeta BD                            0.2                  0.2            0.2              0.2                      —

                                             Phenonip                            1.0                  1.0            1.0              1.0                      —

                                             Water                            qs 100%              qs 100%        qs 100%          qs 100%                     —

                                             Ethanol                              —                    —              —               —                  qs 100%
                a
                 SPF in vivo and standard deviation evaluated in accordance with ISO24444:2010 guidelines with n ¼ 5.

                skin substrate preparations before and after application of a                      probe based on the white light chromatic aberration principle
                sunscreen using Labsphere UV-2000S. The UV transmittance                           (Altisurf 500 instrumentation). The instrumentation allowed
                of four positions per 2 × 2 cm2 skin substrate was measured to                     noncontact surface topography measurement and analysis. The
                virtually cover the complete surface area of the preparation.                      employed optical sensor yielded an axial resolution (z) of 5 nm
                    The blank transmittance spectrum was recorded at first for                     and a lateral resolution (x–y) of 1.1 μm. The motorized x–y
                each single position before sunscreen application followed by                      stage permitted scanning of samples in the millimeter range.
                topographical measurement of the bare skin (see Sec. 2.6).                         Skin preparations on quartz plates were fixed on the stage
                Subsequently, sunscreen was applied and topographical meas-                        using a custom made holder.
                urement was performed again. After completion of topographi-                           Surface topography of bare skin and skin covered with sun-
                cal measurement which lasted ∼4 h, UV transmission through                         screen was measured in order to assess the sunscreen film. Skin
                the sunscreen-covered skin substrate was measured. Stability of                    preparations were removed from the desiccator and allowed to
                SPF in vitro values over 4 h was checked and confirmed for all                     equilibrate for 12 h next to the device at room conditions before
                sunscreens (data not shown).                                                       starting topographical measurements. Repeated measurements on
                                                                                                   bare skin using the “loop” option of the operating software revealed
                2.6     Assessment of the Sunscreen Film                                           that this equilibration was necessary to allow stabilization of the
                                                                                                   surface position along the z axis (data not shown). After measuring
                The layer of sunscreen applied on the pig skin substrate was                       the surface topography of bare skin, sunscreen was applied, equili-
                investigated using topographical measurements with an optical                      brated for 15 min, and the same area was scanned again.

                Journal of Biomedical Optics                                               115005-3                                        November 2014   •   Vol. 19(11)

Downloaded From: https://www.spiedigitallibrary.org/journals/Journal-of-Biomedical-Optics on 02 Jun 2021
Terms of Use: https://www.spiedigitallibrary.org/terms-of-use
Sohn et al.: Film thickness frequency distribution of different vehicles determines sunscreen efficacy
Fig. 1 Rheological behavior of sunscreens measured with AR-G2 rheometer (TA instrument, New
Castle, Delaware), CP 4 deg ∕40 mm, gap 100 μm, T ¼ 23°C.
Figure 2 illustrates the area of topographical and UV trans- about 18 × 8 mm2 . Topography was recorded in lines each
mittance measurements. extending over the quartz and the skin part of the rectangle
Topographical measurements were performed on two rectan- with an increment step of 10 μm. The rectangular areas were
gular areas (∼23 × 8 mm2 ) per specimen (Fig. 2). A part of the scanned with lines in 10-μm intervals resulting in 1,840,000 sin-
rectangular area (about 5 × 8 mm2 on left hand side) corre- gle-measurement points per rectangle.
sponded to quartz without skin and served as a reference. The raw data of the topographical measurements were
The skin area (right hand side of the rectangle) measured redressed by a line-by-line leveling correction of each rectangu-
lar surface to the same x-y plane using the quartz part of each
measured line (left side of rectangle, Fig. 2). This redressing
procedure was carried out with the data of bare skin and skin
covered with sunscreen and was essential in order to correct
for variation due to positioning and due to environmental factors
changing in the course of the experiment. Each rectangular sur-
face area was divided into two zones of 8 × 8 mm2 coinciding
with the four positions (circles) of UV transmittance measure-
ments (Fig. 2). The film thickness of the applied sunscreen
was obtained as the difference of the redressed skin topography
data with and without sunscreen computed for each single-meas-
urement point. The result was expressed as a distribution of
frequencies of film thickness over the measured surface area nor-
malized to 100% and is referred to as thickness distribution curve.
A threshold of 0.5% of area under the curve was applied to
remove extreme values at both ends of the film thickness distri-
bution. To validate this measurement and calculation method, a
surface area of bare skin was measured twice and the film thick-
ness was computed. The result was found to be centered around
0 μm (n ¼ 8), confirming the validity of the method for meas-
urement of the sunscreen film thickness distribution on skin.
Data extracted from the distribution curve and serving to
characterize the applied sunscreen film are given in Table 2.
Smean is the frequency-weighted average thickness. The Smean
to median ratio of the thickness distribution is a measure of
Fig. 2 Illustration of areas for topographical and UV transmittance skewness of distribution and is used as an expression of film
measurements; the big square corresponds to the carrier quartz homogeneity; the smaller this ratio the greater the homogeneity
plate, the dotted small square to the skin surface area with a dimen-
of the film. The Abbott–Firestone curve is commonly used in
sion of 2 × 2 cm2 , the four circles correspond to the areas of UV trans-
mittance measurements [sun protection factor (SPF)] with a diameter surface metrology29 and is employed here to depict the exper-
of 1 cm and the two rectangles to the two areas of topographical imentally determined thickness distribution, indicating thick-
measurements. ness and uniformity of the applied product layer.
Journal of Biomedical Optics 115005-4 November 2014 • Vol. 19(11)
Downloaded From: https://www.spiedigitallibrary.org/journals/Journal-of-Biomedical-Optics on 02 Jun 2021
Terms of Use: https://www.spiedigitallibrary.org/terms-of-useSohn et al.: Film thickness frequency distribution of different vehicles determines sunscreen efficacy
Table 2 Data extracted from the thickness distribution curve of
applied product.
Parameter Meaning
S mean (μm) Average of film thickness over
the measured area
S mean to median ratio Indicator of film homogeneity
Abbott–Firestone curve Cumulative frequency of occurrence
of film thickness
2.7 Statistical Analysis
Statistical analysis was performed using Statgraphics centurion
XVI software (Statpoint Technologies, Inc., Warrenton, Fig. 4 Example of distribution of film thickness frequency and Abbott–
Firestone curve of OW-C sunscreen.
Virginia). The impact of formulation vehicle on SPF in vitro
and on film parameters was assessed with a Kruskal–Wallis non-
parametric test, and the impact of application conditions was large as 10 to 13 μm was recorded. A small percentage of
assessed with a Mann–Whitney U test, both with a statistical the area under the thickness distribution curve lay below a
significance at 5% confidence level. In case Kruskal–Wallis film thickness of 0 μm, which was likely due to experimental
test revealed a statistically significant difference among error. This was included in the calculation of the Smean value.
sunscreens for an investigated parameter, a multiple pairwise
comparison test using Bonferroni approach was performed to
identify which sunscreens significantly differed from which 3.2 Impact of Vehicle on Film Parameter Values
other. Correlations between film parameters and SPF in vitro and SPF In Vitro
values within each formulation were assessed using Spearman’s
rank correlation coefficient test. Figure 5 gives the average of the Abbott–Firestone curves of all
measurements with each investigated sunscreen using high pres-
3 Results sure and spreading 1 conditions of application.
The Abbott–Firestone profiles differed considerably between
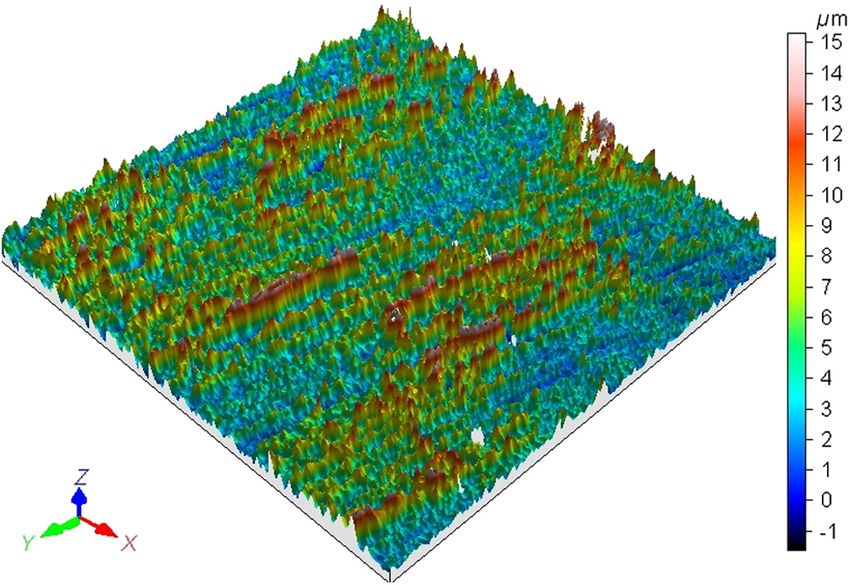
3.1 Film Assessment the sunscreens (Fig. 5). Film thickness was different for the
different vehicles and decreased roughly in the order WO >
The film thickness distribution of sunscreen, extracted from the
GEL > OW-C > CAS > OW-S. For WO for example, a film
topographical measurements, is visualized three-dimensionally
thickness of 2.41 μm corresponds to 50% of the cumulative
for qualitative assessment in Fig. 3 and is quantitatively dis-
thickness frequency meaning that 50% of the measured surface
played as a distribution curve of thickness frequency. From
the distribution curve, the Abbott–Firestone curve (cumulative area of the sample exhibited a film thickness greater than
frequency) was deduced (Fig. 4). 2.41 μm. As a comparison, 50% of the measured area of
Thickness distribution was always positively skewed, the OW-S exhibited a thickness greater than merely 1.20 μm.
degree of skewness varying between the different sunscreens. Moreover, the shape of the curve differed between the used
In the example of Fig. 4, the most frequently occurring film vehicles, the WO, for example, showed a more flat-shaped pro-
thickness was in the range of 2 to 4 μm while a thickness as file compared to CAS (Fig. 5).
Fig. 3 Example of three-dimensional visualization of film thickness Fig. 5 Abbott–Firestone profiles of investigated sunscreens applied
distribution of oil-in-water cream (OW-C) sunscreen. with high pressure and spreading 1.
Journal of Biomedical Optics 115005-5 November 2014 • Vol. 19(11)
Downloaded From: https://www.spiedigitallibrary.org/journals/Journal-of-Biomedical-Optics on 02 Jun 2021
Terms of Use: https://www.spiedigitallibrary.org/terms-of-useSohn et al.: Film thickness frequency distribution of different vehicles determines sunscreen efficacy
Table 3 Medians of SPF in vitro, S mean , and S mean to median ratio of Table 4 Impact of vehicle on SPF in vitro, S mean , and S mean to
thickness distribution with interquartile range Q1 to Q3 (in brackets) median ratio of thickness distribution.
for investigated sunscreens with high pressure and spreading 1.
Statistically significant
S mean to median Parameter differencea
Sunscreen SPF in vitro S mean (μm) ratio
SPF in vitro Yes (p < 0.05)
OW-C (n ¼ 27) 33 (30 to 48) 2.3 (2.0 to 2.7) 1.30 (1.25 to 1.44)
S mean Yes (p < 0.05)
OW-S (n ¼ 20) 16 (13 to 26) 1.6 (1.2 to 2.0) 1.41 (1.30 to 1.96)
S mean to median ratio Yes (p < 0.05)
GEL (n ¼ 28) 28 (20 to 34) 2.6 (2.4 to 3.1) 1.19 (1.16 to 1.23) a
Between the different formulations on SPF in vitro, S mean , and S mean
WO (n ¼ 24) 72 (55 to 85) 2.9 (2.6 to 3.2) 1.19 (1.17 to 1.21) to median ratio of thickness distribution at 5% confidence level
(Kruskal—Wallis).
CAS (n ¼ 20) 14 (7 to 20) 2.2 (1.7 to 2.6) 1.71 (1.44 to 1.99)
distribution function to describe film irregularity.30 The esti-
mated value lies within the range of the experimental values
These differences between the vehicles are reflected by the of all vehicles, yet the in silico calculation cannot predict the
calculated film thickness distribution parameters Smean and Smean effect of formulation on SPF. In Fig. 6, the Smean of the formu-
to median ratio. Table 3 gives the values of the median and inter- lations is also visualized.
quartile range for the film parameters of all individual measure- The impact of the vehicle on SPF in vitro and film parameters
ments of each investigated sunscreen. Also, SPF in vitro values was evaluated with a Kruskal–Wallis test (Table 4).
of these sunscreens are given in Table 3. This statistical test revealed a significant effect of the vehicle
SPF in vitro varied markedly between the investigated sun- on all tested parameters. To identify which sunscreens signifi-
screen formulations attaining values from 14 for CAS to 72 for cantly differed from each other with respect to the studied
WO. SPF in vitro values are compared to the SPF in vivo in parameters, a multiple pairwise comparison test based on the
Fig. 6. SPF in vitro values generally approached SPF in vivo Bonferroni approach was employed. The results are given in
and, considering the declared variation range, a satisfactory Tables 5–7.
agreement between SPF in vitro and in vivo for spreading 1 This multiple comparison test resulted in a group classifica-
and a high pressure condition is found. WO sunscreen was tion of the investigated sunscreens. Formulations of one group
an exception, with surprisingly low and high SPF in vivo and differ statistically from those of another group while formula-
SPF in vitro, respectively. In silico estimation of SPF gave a tions that belong to the same group do not differ significantly
value of 25 (Fig. 6). This computational approach takes into from each other with respect to the considered parameter. When
account the absorbance spectrum of each UV filter, their photo- the same formulation is contained in two different groups it does
stability and mutual stabilization or de-stabilization, and their not differ significantly from the formulations of either group.
distribution in the phases of the vehicle and uses the Gamma The number of groups was different for the tested parameters;
Fig. 6 SPF in vivo (white columns) with standard deviation (bars), medians of SPF in vitro (gray columns)
with interquartile values (bars) for OW-C (n ¼ 27), OW-S (n ¼ 20), GEL (n ¼ 28), WO (n ¼ 24), CAS
(n ¼ 20), SPF in silico (black horizontal line), and medians of S mean values (squares) of the same
sunscreens applied with high pressure and spreading 1.
Journal of Biomedical Optics 115005-6 November 2014 • Vol. 19(11)
Downloaded From: https://www.spiedigitallibrary.org/journals/Journal-of-Biomedical-Optics on 02 Jun 2021
Terms of Use: https://www.spiedigitallibrary.org/terms-of-useSohn et al.: Film thickness frequency distribution of different vehicles determines sunscreen efficacy
Table 5 Multiple pairwise comparison test using Bonferroni approach
for SPF in vitro.
Group classificationa WO OW-C GEL CAS OW-S
Group 1 X
Group 2 X X
Group 3 X X X
a
Sunscreens that were nonsignificantly different from each other with
respect to SPF in vitro were assigned to the same group.
Table 6 Multiple pairwise comparison test using Bonferroni approach
for S mean .
Fig. 7 Abbott–Firestone profiles of GEL sunscreen applied with two
Group classificationa WO GEL OW-C CAS OW-S pressure (high and low) and spreading (1 and 2) conditions.
Group 1 X X
3.3 Impact of Pressure and Spreading Procedure
Group 2 X X on Film Parameter Values and SPF In Vitro
Group 3 X X In addition to the vehicle, the impact of the application condi-
tions, i.e., spreading procedure and pressure on film parameters
Group 4 X X
and SPF in vitro, was studied using the GEL sunscreen. In total,
a
Sunscreens that were nonsignificantly different from each other with three conditions of application were investigated, spreading 1
respect to S mean were assigned to the same group. with high pressure, spreading 1 with low pressure, and spread-
ing 2 with high pressure.
Figure 7 shows the average of the Abbott–Firestone curves of
Table 7 Multiple pairwise comparison test using Bonferroni approach the GEL sunscreen for each application condition, and Table 8
for S mean to median ratio. gives the median and interquartile range values of SPF in vitro
and the film parameters for the investigated conditions.
It is evident from Fig. 7 that the shape of the Abbott–
Group classificationa WO GEL OW-C CAS OW-S
Firestone curve of GEL sunscreen is different between spread-
Group 1 X X X ing 2 and spreading 1, while no difference was found between
low and high pressure using spreading 1. The differences of the
Group 2 X X Abbott–Firestone curves are reflected in the Smean and Smean to
a median ratio.
Sunscreens that were nonsignificantly different from each other with
respect to S mean to median ratio were assigned to the same group. SPF in vitro data measured for each condition of application
were compared to the SPF in vivo for GEL sunscreen (Fig. 8).
two, three, and four groups were found for Smean to median ratio, From this evaluation, spreading 2 with high pressure seems to
SPF in vitro, and Smean , respectively. A small number of groups give a better approximation of the SPF in vivo. However, as this
mean less difference between the sunscreens. condition could not be practically applied to all types of formu-
WO yielded a significantly higher SPF in vitro than all other lation, spreading 1 with high pressure was used as an alternative
sunscreens, a greater Smean than OW-C, CAS, and OW-S and a in the investigation of the different vehicles (Sec. 3.2).
smaller Smean to median ratio than CAS and OW-S. OW-C gave The impact of spreading (procedure 1 versus 2) and pressure
a higher SPF in vitro and a smaller Smean to median ratio than (low versus high) on SPF in vitro and film parameters were
CAS and OW-S. The GEL and OW-C formulations did not sig- evaluated using the Mann–Whitney U test (Table 9).
nificantly differ from each other with respect to any of the cri- Spreading 2 showed a significantly smaller film thickness
teria. Also, CAS and OW-S did not differ from each other. OW- (Smean ) and a larger Smean to median ratio compared to spreading
C yielded a greater SPF in vitro, a greater Smean and a smaller 1 (Tables 8 and 9). Both spreading and pressure had a significant
Smean to median ratio than OW-S, which was interesting since effect on SPF in vitro. For spreading 2 compared to spreading 1
these two sunscreens varied only in their content of thickeners, and high compared to low pressure a reduction of SPF in vitro
hence their viscosity characteristic. was found. Film parameters were not significantly influenced by
Finally, the correlation of the SPF in vitro with both film pressure.
parameters for the individual measurements within each sun-
screen was evaluated using a Spearman rank correlation test.
A significant positive correlation between SPF in vitro and 4 Discussion
Smean was found for every sunscreen formulation (p < 0.05). This work tests the hypothesis that the film thickness distribu-
A negative correlation was found between SPF in vitro and tion can be used to explain the variation of SPF between sun-
Smean to median ratio for WO; OW-S, and CAS (p < 0.05), screen vehicles and application conditions. For this purpose, the
whereas no correlation was found for OW-C and GEL. accurate measurement of film thickness was necessary.
Journal of Biomedical Optics 115005-7 November 2014 • Vol. 19(11)
Downloaded From: https://www.spiedigitallibrary.org/journals/Journal-of-Biomedical-Optics on 02 Jun 2021
Terms of Use: https://www.spiedigitallibrary.org/terms-of-useSohn et al.: Film thickness frequency distribution of different vehicles determines sunscreen efficacy
Table 8 Medians of SPF in vitro, S mean , and S mean to median ratio with interquartile range Q1 to Q3 (in brackets) for investigated conditions of
application of the GEL sunscreen.
Application of GEL sunscreen SPF in vitro S mean (μm) S mean to median ratio
Spreading 1, high pressure, n ¼ 28 28 (20 to 34) 2.6 (2.4 to 3.1) 1.19 (1.16 to 1.23)
Spreading 1, low pressure, n ¼ 24 39 (30 to 54) 2.7 (2.4 to 3.1) 1.19 (1.17 to 1.21)
Spreading 2, high pressure, n ¼ 24 20 (15 to 25) 1.9 (1.5 to 2.3) 1.57 (1.50 to 1.91)
Fig. 8 SPF in vivo (white columns) with standard deviation (bars), medians of SPF in vitro (gray columns)
with interquartile values (bars), and medians of S mean values (squares) of the GEL sunscreen for different
application conditions.
Many techniques for assessing the film distribution of an Sunscreen distribution was evaluated in vivo using an appropri-
applied sunscreen have been used providing merely qualitative ate illumination source optionally combined with photogra-
or some quantitative information about its distribution. For phy31–33 or multiphoton tomography;34 for in vivo and on
qualitative assessment, fluorescence resulting either from a tape strips evaluation the use of laser scanning microscopy17
UV filter or from an added fluorescent marker was used to visu- was also reported. Alternatively, for sunscreens containing tita-
alize the homogeneity of distribution of the applied product. nium dioxide as a UV filter, light microscopy on cross sections
of skin biopsies3 was used that gave a rough estimation of the
thickness layer based on the visualization of titanium dioxide
Table 9 Impact of application conditions on SPF in vitro, S mean , and particles; optical coherent tomography35 was also used on intact
S mean to median ratio of thickness distribution of GEL sunscreen.
skin that detected the distribution of titanium dioxide particles
within the sunscreen layer. For quantitative assessment, the use
Application Statistically significant of in vivo fluorescence spectroscopy gave indirect information
condition Parameter differencea about the film thickness by converting the fluorescence intensity
into an equivalent thickness of an applied product.16,36 When
Spreading SPF in vitro Yes (p < 0.05)
(1 versus 2)
sunscreens are not intrinsically fluorescent, this technique
S mean Yes (p < 0.05) requires the addition of a fluorescent agent which, however,
often produced inconclusive results because of immiscibility
S mean to median ratio Yes (p < 0.05) or interference issues.37 An alternative approach reported the
use of an in vivo skin swabbing technique in conjunction
Pressure SPF in vitro Yes (p < 0.05)
(low versus high) with sunscreen quantification by UV spectroscopy to evaluate
S mean No (p > 0.05) the thickness of the film.38 None of above mentioned methods,
however, provided a full characterization of the sunscreen film
Smean to median ratio No (p > 0.05) in terms of thickness and homogeneity of distribution.
a
Between tested application condition (either spreading or pressure) In our work, we started from an approach based on topo-
and SPF in vitro, Smean, Smean to median ratio at 5% confidence graphical measurements. This method was used before on
level (Mann–Whitney U test). skin replicates and provided a semiquantitative assessment of
Journal of Biomedical Optics 115005-8 November 2014 • Vol. 19(11)
Downloaded From: https://www.spiedigitallibrary.org/journals/Journal-of-Biomedical-Optics on 02 Jun 2021
Terms of Use: https://www.spiedigitallibrary.org/terms-of-useSohn et al.: Film thickness frequency distribution of different vehicles determines sunscreen efficacy
film thickness.39 In contrast to that work, we used a biological The formulation of the vehicles had a significant effect on
substrate for the application of sunscreen to reproduce as closely SPF in vitro (Table 5). It appears that large and small Smean val-
as possible the product-to-substrate adherence relevant for the in ues among vehicles corresponded, respectively, to high and low
vivo situation. In addition, by developing a reference-corrected SPF in vitro. Therefore, the differences in SPF between vehicles
measurement protocol and quantitative data evaluation the com- may be discussed in relation to the film parameter Smean. For
plete thickness distribution could be determined. Topographical this, we consider that a smaller Smean is connected to a greater
evaluation was combined with measurement of SPF in vitro both occurrence of small film thicknesses and that light transmit-
of which were performed in the same position and nearly the tance, which is inversely proportional to SPF, increases expo-
same surface area making it possible to reveal existing nentially with decreasing film thickness. OW-S and CAS for
correlations. instance, exhibited the smallest Smean values and yielded also
The composition of the five studied vehicles principally dif- the lowest SPF. These two sunscreens which lacked thickeners
fered in the thickener and emulsifier system, the UV filter com- and had the lowest viscosity compared to the rest may leave
bination remaining the same. The formulation of the vehicles larger areas of ridges virtually uncovered while accumulating
had a significant effect on Smean and Smean to median ratio in the furrows thus leading to a low SPF. Therefore, the presence
(Tables 6 and 7). Of the two sunscreens, OW-C and OW-S, of thickeners in the formulation seems to be a prevailing pre-
which mainly differed in their thickener system, OW-S showed requisite for UV efficacy. Further, WO exhibited both the largest
a significantly smaller Smean and greater Smean to median ratio Smean value and the highest SPF. This is consistent with minimal
than OW-C. The thickeners Lanette O, Keltrol RD, and surface area with very small film thickness that would be vir-
Salcare SC 91 contained in OW-C but not in OW-S corre- tually unprotected. Furthermore and in contrast to the other
sponded to a relative weight difference of only 10% in the sunscreens, the UV filters of WO are distributed in the continu-
remaining film on the skin surface of OW-S versus OW-C, ous phase which does not evaporate, forming a uniform protect-
but they appear to be responsible for the significant difference ing film with the help of the thickeners. An increase of about
of film thickness and homogeneity between the two sunscreens. 45% of SPF in vitro was found for the WO sunscreen compared
This indicates that thickeners which enable the formation of a to OW-C, which is in line with data previously reported on
firm film upon spreading also lead to a thicker and more homo- sunscreens with smaller SPF values.3 CAS and OW-S as well
geneous film. OW-S and CAS did not differ in their Smean and as OW-C and GEL did not differ with respect to any of the tested
Smean to median ratio both yielding a smaller Smean and larger criteria and can be considered as very similar in terms of film
Smean to median ratio than the other vehicles. This also forming ability and SPF efficacy. Taken together, the SPF varia-
seems to be related to the absence of thickeners in both formu- tion observed between sunscreens containing the same filter
lations. The emulsifier, that was present in the OW-S emulsion, composition is proposed to arise from the difference in their
but not in CAS which was a mono-phase, seems to play a minor film thickness distribution.
role for the Smean and the Smean to median ratio. The same obser- Within every sunscreen, Smean positively correlated with SPF
vation is true for OW-C and GEL sunscreens that did not sta- in vitro. Further, Smean to median ratio showed a negative cor-
tistically differ in Smean and Smean to median ratio, with both relation with SPF in vitro for three of the five sunscreens. This
containing thickeners but only OW-C containing emulsifiers. demonstrates the significant connection between the film forma-
WO had a statistically larger Smean than OW-C, OW-S, and tion and sun protection efficacy and supports the observation
CAS which might be related to its continuous oil phase; yet discussed above about the differences between sunscreens.
it did not show a significant difference to GEL. With respect The present data addressing film formation and thickness distri-
to Smean to median ratio, the low viscosity vehicles CAS and bution go beyond the previous studies, which showed that film
OW-S showed a higher positively skewed thickness distribution, thickness resulting from a different application amount of sun-
hence a greater nonhomogeneity of film than the high viscosity screen strongly impacts SPF efficacy.8,10
vehicles WO, OW-C, and GEL. It should be pointed out that In addition to the vehicle formulation, this work demon-
Smean differences between the vehicles were not due to strated using the GEL that application conditions can signifi-
differences in mass loss during application. cantly impact sunscreen performance. We found that a longer
Fig. 9 Connections between influencing factors, film distribution, and SPF efficacy.
Journal of Biomedical Optics 115005-9 November 2014 • Vol. 19(11)
Downloaded From: https://www.spiedigitallibrary.org/journals/Journal-of-Biomedical-Optics on 02 Jun 2021
Terms of Use: https://www.spiedigitallibrary.org/terms-of-useSohn et al.: Film thickness frequency distribution of different vehicles determines sunscreen efficacy
spreading time resulted in a larger Smean to median ratio, a 6. C. Welsh and B. Diffey, “The protection against solar actinic radiation
smaller Smean and smaller SPF in vitro values (Table 8) further afforded by common clothing fabrics,” Clin. Exp. Dermatol. 6(6),
577–581 (1981).
corroborating the correlation between film characteristics and
7. U. Osterwalder, B. Herzog, and S. Q. Wang, “Advance in sunscreens
sunscreen efficacy; also, an increase of pressure by 180 g to prevent skin cancer,” Expert Rev. Dermatol. 6(5), 479–491
resulted in a significant decrease in SPF values. Interestingly, (2011).
this effect of prolonged and high pressure application was analo- 8. R. Stokes and B. Diffey, “How well are sunscreen users protected?,”
gous to that elicited by low viscosity formulations, which might Photodermatol. Photoimmunol. Photomed. 13(5–6), 186–188 (1997).
be related to a thinning of the GEL under these application con- 9. W. Liu et al., “Sunburn protection as a function of sunscreen application
ditions. The effect of application conditions on the performance thickness differs between high and low SPFs,” Photodermatol.
Photoimmunol. Photomed. 28(3), 120–126 (2012).
of the other vehicles still needs to be investigated. Some authors 10. S. Brown and B. L. Diffey, “The effect of applied thickness on sun-
reported that even a change in pressure of 50 g led to a different screen protection - in vivo and in vitro studies,” Photochem.
SPF in vitro when using synthetic plates as a substrate.40 Former Photobiol. 44(4), 509–513 (1986).
studies reported that a more rubbed application led to a smaller 11. A. Faurschou and H. C. Wulf, “The relation between sun protection
SPF in vivo15 and a crude compared to a careful application to a factor and amount of suncreen applied in vivo,” Brit. J. Dermatol.
smaller cream thickness.36 Finally, more recently, the effect of 156(4), 716–719 (2007).
12. S. Schalka, V. M. Silva dos Reis, and L. C. Cuce, “The influence of
careful versus crude spreading of sunscreen on the magnitude of
the amount of sunscreen applied and its sun protection factor (SPF):
erythema occurrence was simulated, and underlined the “impor- evaluation of two sunscreens including the same ingredients at different
tance of homogeneity of spreading on the level of delivered concentrations,” Photodermatol. Photoimmunol. Photomed. 25(4),
protection.41” 175–180 (2009).
Figure 9 summarizes the connection between the influencing 13. E. Chatelain, B. Gabard, and C. Surber, “Skin penetration and sun pro-
factors, i.e., application condition and vehicle, the film distribu- tection factor of five UV filters: effect of the vehicle,” Skin Pharmacol.
tion and the measured SPF in vitro of sunscreens. Appl. Skin Physiol. 16(1), 28–35 (2003).
14. M. Rohr et al., “In vitro sun protection factor: still a challenge with no
final answer,” Skin Pharmacol. Physiol. 23(4), 201–212 (2010).
5 Conclusion 15. R. M. Sayre, J. Powell, and L. A. Rheins, “Product application tech-
nique alters the sun protection factor,” Photodermatol. Photoimmunol.
The type and the viscosity of sunscreen vehicles and application Photomed. 8(5), 222–224 (1991).
conditions play a role for the film thickness parameters that 16. L. E. Rhodes and B. L. Diffey, “Quantitative assessment of sunscreen
finally influenced the SPF efficacy. High application pressure, application technique by in vivo fluorescence spectroscopy,” J. Soc.
long spreading time, low viscosity of formulation, and/or Cosmet. Chem. 47(2), 109–115 (1996).
absence of thickeners were shown to unfavorably impact UV 17. J. Lademann et al., “Influence of nonhomogeneous distribution of topi-
cally applied UV filters on sun protection factors,” J. Biomed. Opt. 9(6),
protection. As the application condition can, in principle, be 1358–1362 (2004).
fixed, the impact of a vehicle on the formed film can now be 18. V. Gebauer et al., “Influence of skin aging effects on the skin surface
investigated during the product development step. Sunscreen profile and the correlated distribution of topically applied sunscreens,”
composition might be optimized accordingly to achieve a J. Biophotonics 5(3), 274–282 (2012).
large film thickness with a uniform distribution with minimiza- 19. J. Oneill, “Effect of film irregularities on sunscreen efficacy,” J. Pharm.
tion of the small thickness fraction of the film being crucial for Sci. 73(7), 888–891 (1984).
20. M. Sohn et al., “Porcine ear skin as a biological substrate for in vitro
ultimate sunscreen performance. Development of a method to
testing of sunscreen performance,” Skin Pharmacol. Physiol. 28(1),
quantify the film thickness distribution of sunscreen on skin 31–41 (2015).
was shown to be essential for understanding the mechanism 21. A. Brozyna and B. W. Chwirot, “Porcine skin as a model system
influencing UV efficacy. for studies of ultraviolet A effects in human skin,” J. Toxicol. Env.
Heal A 69(12), 1155–1165 (2006).
22. H.-J. Weigmann et al., “Comparison of human and porcine skin
Acknowledgments for characterization of sunscreens,” J. Biomed. Opt. 14(2), 024027
We would like to thank the GEBERT RÜF STIFTUNG for fund- (2009).
ing this study, Uli Osterwalder and Björn Klotz from BASF SE 23. V. K. Gupta, J. L. Zatz, and M. Rerek, “Percutaneous absorption of
sunscreens through micro-Yucatan pig skin in vitro,” Pharmaceut.
for their valuable input, and the company Altimet especially Res. 16(10), 1602–1607 (1999).
Patrice Belin and Denis Georges for the significant technical 24. A. C. Pescia et al., “On the assessment of photostability of sunscreens
support in the development of the film assessment method. exposed to UVA irradiation: from glass plates to pig/human skin, which
is best?,” Int. J. Pharm. 427(2), 217–223 (2012).
25. BASF., “BASF sunscreen simulator,” https://www.sunscreensimulator
References .basf.com/ (17 October 2014).
26. “ISO 24444:2010—Cosmetics—Sun protection test methods - In vivo
1. J. K. Robinson and A. W. Rademaker, “Sun protection by families at the
determination of the sun protection factor (SPF),” http://www.iso.org/
beach,” Arch. Pediat. Adol. Med. 152(5), 466–470 (1998).
iso/catalogue_detail.htm?csnumber=46523 (17 October 2014).
2. B. L. Diffey and Z. Norridge, “Reported sun exposure, attitudes to sun
protection and perceptions of skin cancer risk: a survey of visitors 27. R. M. Sayre et al., “Comparison of in vivo and in vitro testing of
to Cancer Research UK’s SunSmart campaign website,” Brit. J. sunscreening formulas,” Photochem. Photobiol. 29(3), 559–566 (1979).
Dermatol. 160(6), 1292–1298 (2009). 28. “ISO 24443:2012 - Determination of sunscreen UVA photoprotection in
3. J. Schulz et al., “Distribution of sunscreens on skin,” Adv. Drug. vitro” http://www.iso.org/iso/catalogue_detail?csnumber=46522 (17
Deliver. Rev. 54(Suppl. 1), 157–163 (2002). October 2014).
4. B. Herzog and K. Sommer, “Investigations on photostability of UV- 29. E. Abbott and F. Firestone, “Specifying surface quality: a method based
absorbers for cosmetic sunscreens,” in Proceedings XXIth IFSCC on accurate measurement and comparison,” Mech. Eng. 55, 569–572
International Congress, Berlin (2000). (1933).
5. B. Berne and T. Fischer, “Protective effects of various types of 30. B. Herzog and U. Osterwalder, “In silico determination of topical sun
clothes against UV-radiation,” Acta Derm.-Venereol. 60(5), 459–460 protection,” in Cosmetic Sciences Technology, pp. 62–70, T4
(1980). International, Boxmoor, Hertfordshire (2011).
Journal of Biomedical Optics 115005-10 November 2014 • Vol. 19(11)
Downloaded From: https://www.spiedigitallibrary.org/journals/Journal-of-Biomedical-Optics on 02 Jun 2021
Terms of Use: https://www.spiedigitallibrary.org/terms-of-useSohn et al.: Film thickness frequency distribution of different vehicles determines sunscreen efficacy
31. P. W. Grencis and R. Stokes, “An evaluation of photographic methods to 38. U. Bauer, D. S. O’Brien, and M. G. Kimlin, “A new method to quantify
demonstrate the uniformity of sunscreen applied to the skin,” J. Audiov the application thickness of sunscreen on skin,” Photochem. Photobiol.
Media Med. 22(4), 171–177 (1999). 86(6), 1397–1403 (2010).
32. H. Loesch and D. L. Kaplan, “Pitfalls in sunscreen application,” Arch. 39. A. Teichmann et al., “Investigation of the homogeneity of the distribu-
Dermatol. 130(5), 665–666 (1994). tion of sunscreen formulations on the human skin: characterization and
33. J. Lademann et al., “Sunscreen application at the beach,” J. Cosmet. comparison of two different methods,” J. Biomed. Opt. 11(6), 064005
Dermatol. 3(2), 62–68 (2004). (2006).
34. T. Vergou et al., “Methods for the evaluation of the protective efficacy 40. S. Miksa, D. Lutz, and C. Guy, “Influence of pressure during spreading
of sunscreen products,” Skin Pharmacol. Physiol. 26(1), 30–35 (2013). on UV transmission results,” Cosmet. Toiletries 128(11), 822–829
35. J. Lademann et al., “Application of optical coherent tomography for skin (2013).
diagnostics,” Laser Phys. 15(2), 288–294 (2005). 41. M. Pissavini and B. Diffey, “The likelihood of sunburn in sunscreen
36. L. E. Rhodes and B. L. Diffey, “Fluorescence spectroscopy: a rapid, users is disproportionate to the SPF,” Photodermato Photoimmunol.
noninvasive method for measurement of skin surface thickness of Photomed. 29(3), 111–115 (2013).
topical agents,” Brit. J. Dermatol. 136(1), 12–17 (1997).
37. R. P. Stokes and B. L. Diffey, “The feasibility of using fluorescence Biographies of the authors are not available.
spectroscopy as a rapid, noninvasive method for evaluating sunscreen
performance,” J. Photoch. Photobio. B 50(2–3), 137–143 (1999).
Journal of Biomedical Optics 115005-11 November 2014 • Vol. 19(11)
Downloaded From: https://www.spiedigitallibrary.org/journals/Journal-of-Biomedical-Optics on 02 Jun 2021
Terms of Use: https://www.spiedigitallibrary.org/terms-of-useYou can also read