FEBRUARY 2022

Unparalleled leverage in emerging gold and copper bull markets.
←
→
Page content transcription
If your browser does not render page correctly, please read the page content below
FEBRUARY 2022 Unparalleled leverage in emerging gold and copper bull markets.
FORWARD LOOKING STATEMENTS

All reserve and resource estimates reported by the Company were calculated in accordance with the Canadian National Instrument 43-101 and the Canadian Institute
of Mining and Metallurgy Classification system. These standards differ significantly from the requirements of the U.S. Securities and Exchange Commission. Mineral
resources which are not mineral reserves do not have demonstrated economic viability.
Statements relating to the estimated or expected future production and operating results and costs and financial condition of Seabridge, planned work at the
Company’s projects and the expected results of such work are forward-looking statements within the meaning of the United States Private Securities Litigation Reform
Act of 1995. Forward-looking statements are statements that are not historical facts and are generally, but not always, identified by words such as the following:
expects, plans, anticipates, believes, intends, estimates, projects, assumes, potential and similar expressions. Forward-looking statements also include reference to
events or conditions that will, would, may, could or should occur. Information concerning exploration results and mineral reserve and resource estimates may also be
deemed to be forward-looking statements, as it constitutes a prediction of what might be found to be present when and if a project is actually developed. These
forward-looking statements are necessarily based upon a number of estimates and assumptions that, while considered reasonable at the time they are made, are
inherently subject to a variety of risks and uncertainties which could cause actual events or results to differ materially from those reflected in the forward-looking
statements, including, without limitation: uncertainties related to raising sufficient financing to fund the planned work in a timely manner and on acceptable terms;
changes in planned work resulting from logistical, technical or other factors; the possibility that results of work will not fulfill projections/expectations and realize the
perceived potential of the Company’s projects; uncertainties involved in the interpretation of drilling results and other tests and the estimation of gold reserves and
resources; risk of accidents, equipment breakdowns and labour disputes or other unanticipated difficulties or interruptions; the possibility of environmental issues at
the Company’s projects; the possibility of cost overruns or unanticipated expenses in work programs; the need to obtain permits and comply with environmental laws
and regulations and other government requirements; fluctuations in the price of gold and other risks and uncertainties, including those described in the Company’s
Annual Information Form filed with SEDAR in Canada (available at www.sedar.com) for the year ended December 31, 2020 and in the Company’s Annual Report Form
40-F filed with the U.S. Securities and Exchange Commission on EDGAR (available at www.sec.gov/edgar.shtml).
Forward-looking statements are based on the beliefs, estimates and opinions of the Company’s management or its independent professional consultants on the date
the statements are made.

TSX: SEA | NYSE: SA                                                                                                                                               seabridgegold.com | 2022   2
THE CASE FOR GOLD

▶ Debt is expanding much faster than the economy, strangling
    growth
▶ To stimulate growth, Central Banks have monetized debt to keep
    yields down and fund deficit spending. There is no growth
    without it
▶ Money supply has therefore been growing at unprecedented
    rates
▶ The newly printed money is flowing into the real economy unlike
    the monetization of 2008-2014, causing inflation
▶ Central Banks can’t tighten to attack inflation because the
    economy is too weak
▶ Rising deficits, rising inflation and slowing growth=a dollar
    collapse and record gold prices

 TSX: SEA | NYSE: SA                                                seabridgegold.com | 2022   3
THE CASE FOR SEABRIDGE
    UNPARALLELED LEVERAGE IN EMERGING                             KSM: WORLD’S LARGEST UNDEVELOPED                                LARGE PORTFOLIO OF EXPLORATION
      GOLD AND COPPER BULL MARKETS                                      GOLD/COPPER PROJECT                                         PROJECTS IN NORTH AMERICA

▶   Seabridge is ranked among the world’s top ten            ▶   Environmental approvals in hand in a low-risk             ▶   Iskut (BC): exploring for potential copper-gold porphyry
    companies in gold reserves                                   jurisdiction                                                  similar to Deep Kerr
▶   Over 2 oz of gold resources per share, top amongst the   ▶   P&P reserves: 38.8M oz Au and 10.2B lbs Cu                ▶   Snowstorm (Nevada): massive property at intersection
    world’s leading companies                                                                                                  of three major Nevada gold belts
                                                             ▶   2016 PFS demonstrates 53-year mine plan with all-in
▶   Over 600 pounds of copper resources per share, more          costs of gold production of $673 per ounce                ▶   3 Aces (Yukon): potential for multiple district-scale,
    than the world’s largest copper companies                                                                                  high-grade orogenic gold deposits
                                                             ▶   2016 PFS mine plan excludes 79M oz Au and 33B lbs CU
▶   Two PFS-stage projects (KSM & Courageous Lake) with          added since 2013 with grades better than reserve          ▶   Control of over 1,200 km2 of largely unexplored
    a combined 45M oz of gold plus 10 billion pounds of          grade                                                         properties in highly prospective districts
    copper and tremendous torque to higher gold and
    copper prices                                            ▶   Updated PFS in progress to incorporate newly acquired
                                                                 East Mitchell deposit (formerly Snowfield)
                                                                 RECORD OF ADDING VALUE WITH MINIMAL                                PROVEN LEADERSHIP TEAM AND
           MANY NEAR-TERM CATALYSTS                                         SHARE DILUTION                                               COMPELLING VALUE

▶   KSM: top candidate for a potential JV with a major on    ▶   Added 43M oz Au and 29.5B lbs Cu of inferred              ▶   Assembled a premier exploration & development team
    attractive terms                                             resources at KSM since discovering Deep Kerr in 2013          that has discovered over 100 million ounces of gold at
▶   Iskut: 2022 drill program to further test for large                                                                        KSM and advanced the project through engineering and
                                                             ▶   Built a large project pipeline following three low-cost       EA approvals
    gold/copper porphyry system found in 2020                    acquisitions (Iskut, Snowstorm, 3 Aces) since 2017
▶   Snowstorm: ongoing drill program (5,700 m) to test                                                                     ▶   Trading at an EV/reserve multiple of only US$27/oz of
                                                             ▶   Since 2003, total gold resources per share has                gold and an EV/resource multiple of only US$8/oz
    structures with similar geology as nearby world-class
                                                                 increased by 228%
    Turquoise Ridge Complex
▶   3 Aces: preparing for 2022 drill program

TSX: SEA | NYSE: SA                                                                                                                                       seabridgegold.com | 2022        4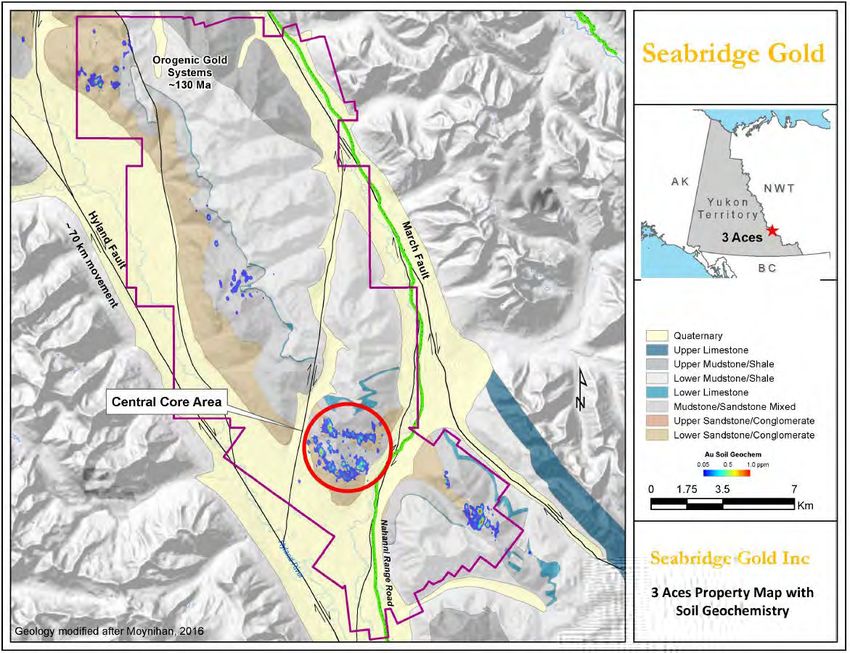
CAPITAL MARKETS PROFILE                                                                                                                              CAPITAL STRUCTURE
                                                                                                                                                         Tickers                          TSX:SEA | NYSE:SA
         SHARE PRICE AND VOLUME (LAST 12 MONTHS)
                                                                                                                                                         Indices                          GDXJ, S&P/TSX Composite,
                   C$30                                                                                                2.0                                                                Global Mining and Global Gold
                                                                                                                       1.8
                   C$25
                                                                                                                       1.6                               Share Price (January 31, 2021)   C$20.39 (US$16.05)

                                                                                                                             Trading Volume (millions)
                   C$20
                                                                                                                       1.4                               52-Week Trading Range            C$18.85 – C$26.21
Share Price (C$)

                                                                                                                       1.2
                                                                                                                                                         Basic Shares Outstanding         79.0M
                   C$15                                                                                                1.0
                                                                                                                       0.8                               FD Shares Outstanding            80.3M1
                   C$10
                                                                                                                       0.6
                                                                                                                                                         Market Capitalization            C$1.6B
                                                                                                                       0.4
                    C$5
                                                                                                                       0.2                               Cash and Short-Term Deposits     >C$50M2
                       -                                                                                             -                                   Marketable Securities            C$3M3
                       Feb-21                    May-21                     Jul-21         Oct-21              Jan-22
                                                                                                                                                         Debt                             Nil
                                                   TSX Volume                NYSE Volume     Price

           TOP SHAREHOLDERS                                                                                                                              RESEARCH COVERAGE
                   Management, Board & Insiders                                                      >30%                                                Company                          Research Analyst
                   Van Eck Associates                                                                4.80%                                               B Riley                          Lucas Pipes
                   Sprott Asset Management                                                           4.10%
                                                                                                                                                         Cantor Fitzgerald                Mike Kozak
                   Kopernik Global Investors                                                         3.70%
                                                                                                                                                         Gold Stock Analyst               John Doody
                   Paulson & Co.                                                                     2.70%
                   Russell Investment Management                                                     2.00%                                               Red Cloud                        David Talbot
                   Jupiter Asset Management                                                          1.50%                                               Roth Capital                     Joe Reagor
                   Fidelity Management & Research                                                    1.00%                                               Singular                         Jim Marrone
     1.            Includes ~1,177,134 options, warrants, and RSUs
     2.            Balance of cash and short-term deposits is as of January 31, 2022
     3.            Marketable securities include common shares of several mining companies that were received as consideration
                   for optioned mineral properties, other short-term investments and ~7.84% of Paramount Gold Nevada Corp.
            TSX: SEA | NYSE: SA                                                                                                                                                                 seabridgegold.com | 2022   5
LARGE NORTH AMERICAN PORTFOLIO OF PREMIER GOLD PROJECTS

       ISKUT PROJECT (100%)
       British Columbia, Canada                                                       COURAGEOUS LAKE (100%)
                                                                                      Northwest Territories, Canada
   ▶     294 km2 property located in northern British
         Columbia, ~110 km northwest of Stewart, BC                              ▶      One of Canada largest undeveloped projects
   ▶     Only 20 km by air from the KSM Project                                         by gold reserves (6.5M oz Au at 2.2 g/t Au)
   ▶     Includes the former high-grade Johnny                                   ▶      2012 PFS demonstrates economic project
         Mountain gold mine and the Bronson Slope                                       with exceptional leverage to higher gold
         Cu-Au deposit                                                                  prices
   ▶     Johnny Mountain produced 90.5K oz Au,
         19.8K oz Ag and 2.2M lbs Cu at 11.3 g/t Au,                                 3 ACES (100%)
         2.5 g/t Ag and 0.40% Cu                                                     Yukon Territory, Canada

                                                                                 ▶      314 km2 property with year-round access
       KSM (100%)                                                                ▶      District-scale, orogenic gold zones
       British Columbia, Canada
                                                                                 ▶      300 holes with 37% intersecting +5 g/t Au

  ▶     World’s largest undeveloped project by gold and
        copper resources                                                              SNOWSTORM PROJECT (100%)
  ▶     Received B.C. Environmental Assessment                                        Nevada, USA
        certificate in July 2014 and federal environmental
        approval in December 2014                                                ▶      103 km2 property located at intersection of
  ▶     2016 PFS captures 38.8M ozs Au and 10.2B lbs Cu                                 three major Nevada gold belts
        in proven and probable reserves                      10% NPI in Grassy   ▶      Contiguous and on strike with several large
                                                             Mountain (Oregon)          gold mines (Getchell/Turquoise Ridge, Twin
  ▶     Recent acquisition of East Mitchell (formerly
                                                                                        Creeks and Midas)
        Snowfield) deposit expected to increase reserves
        and enhance project economics

TSX: SEA | NYSE: SA                                                                                 seabridgegold.com | 2022          6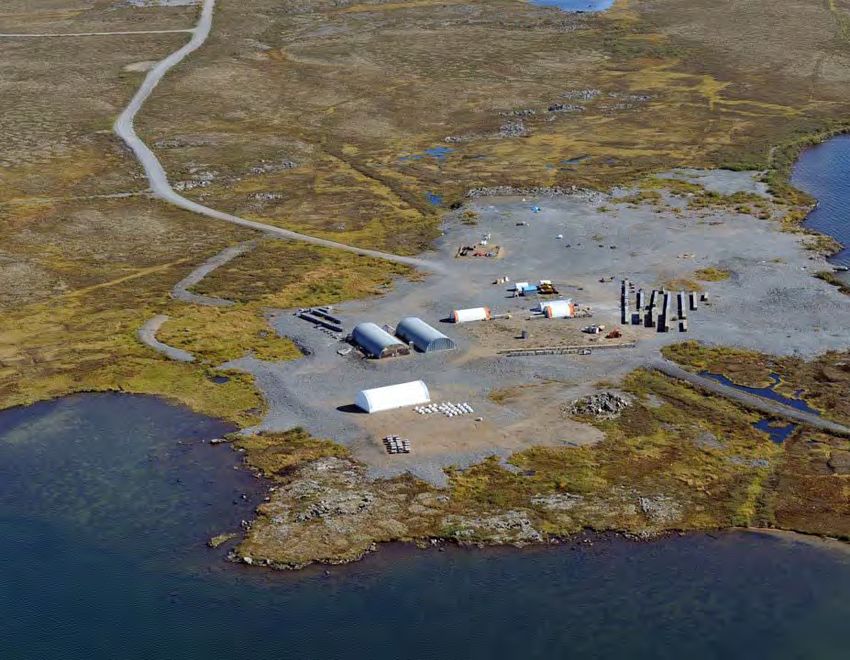
SHARE DILUTION MATTERS
▶ Our objective is to grow ounces in the ground faster than shares outstanding

                                         160                                                                                                                                                                                    160

                                         140
                                                      From 2003 to 2020, total gold resources have grown by                                             915%                                                                    140
                                                      during a period when shares outstanding increased by only 167%

                                                                                                                                                                                                                                      Shares Outstanding (Millions)
                                         120                                                                                                                                                                                    120
             Ounces of Gold (Millions)

                                         100                                                                                                                                                                                    100

                                         80                                                                                                                                                                                     80

                                         60                                                                                                                                                                                     60

                                         40                                                                                                                                                                                     40

                                         20                                                                                                                                                                                     20

                                           -                                                                                                                                                                                    -
                                               2003     2004      2005       2006       2007   2008       2009         2010        2011         2012     2013   2014     2015      2016      2017   2018      2019      2020

                                                      Proven & Probable Gold Reserves                   Measured & Indicated Gold Resources                        Inferred Gold Resources                 Shares Outstanding

Source: Company data
Note: For a breakdown of Seabridge’s mineral reserves and resources by project, tonnes and grade, please visit http://seabridgegold.net/resources.php

TSX: SEA | NYSE: SA                                                                                                                                                                                           seabridgegold.com | 2022                                7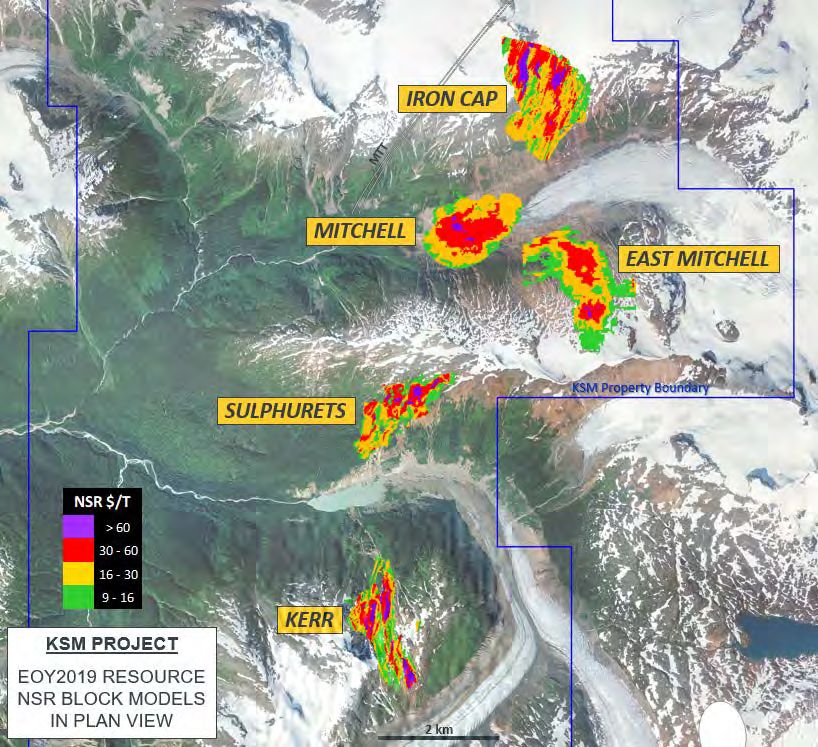
SUPERIOR LEVERAGE TO GOLD
▶ Seabridge ranks 1st in gold reserves/share among North American ▶ Seabridge ranks 1st in gold resources/share among North American listed
listed gold companies gold companies
GOLD RESERVES (OUNCES) PER COMMON SHARE GOLD RESERVES (OUNCES) PER COMMON SHARE
Proven & Probable Measured & Indicated Inferred
0.70 2.40
0.58 2.03
0.60
2.00
0.50
1.60
0.40
1.20
0.30
0.80
0.20
0.40
0.10
- -
Anglogold
Kinross
Alamos
Agnico-Eagle
N. Dynasty
Newcrest
K. Lake
Goldfields
New Gold
Anglogold
Seabridge
Alamos
Kinross
Barrick
NovaGold
Polymetal
Pretium
Yamana
Harmony
Newmont
Agnico-Eagle
Newcrest
Goldfields
Buenaventura
New Gold
Seabridge
Kirkland Lake
Polymetal
NovaGold
Barrick
Pretium
Yamana
Harmony
Newmont
Source: Company data. Data as of January 31, 2022
Note: Companies shown include North America’s largest gold companies and selected gold project development companies
TSX: SEA | NYSE: SA seabridgegold.com | 2022 8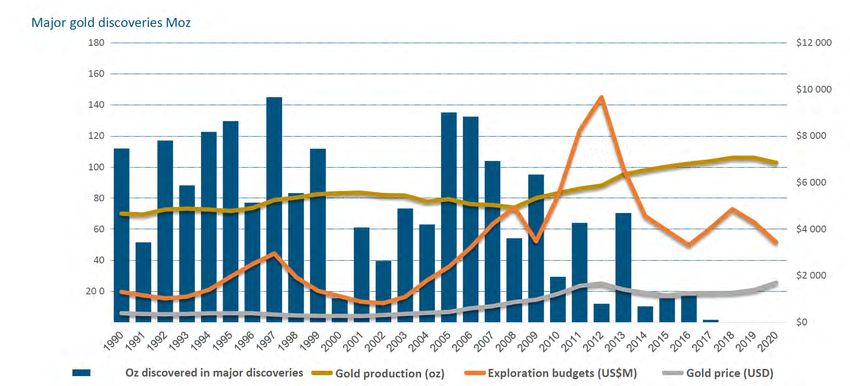
IN A RISING GOLD MARKET, SEABRIDGE IS A STOCK TO OWN
                                                                        Si nce October 1999

                                                   13,900%             Seabri dge              7,4 52%
                                                                       NovaGold                 1,762%
                                                                       Newcrest                  501%
                                                                       Gold                     494%
                                                   11,900%             Agnico Eagle              396%
                                                                       Gold Fields               309%
                                                                       Newmont                   235%
                                                                       HUI                       210%
    Relative Performance (Since October 1, 1999)

                                                                       Barrick                    18%
                                                   9,900%
                                                                       Kinross                   (21%)
                                                                       Harmony                   (33%)
                                                                       AngloGold                 (35%)
                                                                       Yamana                    (45%)
                                                   7,900%

                                                   5,900%

                                                   3,900%

                                                    1,900%

                                                    (100%)
                                                         1999   2000   2001      2002   2003    2004     2005   2006   2007   2008   2009   2010   2011   2012   2013   2014   2015   2016   2017   2018   2019   2020    2021
Source: Company data. As of January 31, 2022

TSX: SEA | NYSE: SA                                                                                                                                                                                                      seabridgegold.com | 2022   9
SUPERIOR LEVERAGE TO COPPER
▶ Seabridge ranks 1st in copper reserves/share among major listed                                                                       ▶ Seabridge ranks 1stin copper resources/share among major listed
  copper/gold companies                                                                                                                   copper/gold companies

COPPER RESERVES (POUNDS) PER COMMON SHARE                                                                                                COPPER RESERVES (POUNDS) PER COMMON SHARE
150                                                                                                                                                              Proven & Probable           Measured & Indicated                          Inferred
                                                                                                                                          750

        129                                                                                                                                         647

100                                                                                                                                       500

 50                                                                                                                                       250

   -                                                                                                                                          -
                                                                        Ivanhoe
                                                      BHP

                                                            Rio Tinto
                               First Quantum

                                                                                            Lundin

                                                                                                               Glencore
        Seabridge

                                               Teck
                    Freeport

                                                                                                     Barrick
                                                                                  Newmont

                                                                                                                                                                                              Ivanhoe
                                                                                                                                                                           Rio Tinto

                                                                                                                                                                                       BHP

                                                                                                                                                                                                        First Quantum

                                                                                                                                                                                                                                  Lundin

                                                                                                                                                                                                                                              Glencore
                                                                                                                                                     Seabridge

                                                                                                                                                                    Teck

                                                                                                                                                                                                                                                         Barrick
                                                                                                                                                                                                                        Newmont
                                                                                                                          Source: Company data. Data as of January 31, 2022
                                                                                                                          Note: In addition to Seabridge, companies shown include North America’s largest copper and gold/copper producing companies

 TSX: SEA | NYSE: SA                                                                                                                                                                                                        seabridgegold.com | 2022               10
ARE WE IN A COPPER SUPER-CYCLE? ▶ Copper reached an all-time high (nominal) of US$10,725/tonne in May 2021 ▶ Driven by declining inventories, weakening U.S. dollar and strong demand during the pandemic recovery ▶ Long-term demand growth to be driven by its use as a key metal in the global transition to a green economy. “Copper is the new oil” – Goldman Sachs Research Source: US Federal Reserve, Roskill TSX: SEA | NYSE: SA seabridgegold.com | 2022 11
LOW POLITICAL RISK
▶ Canada remains a premier, low-risk jurisdiction for mining investment       Argentina                          Chile                           Peru
  compared to other countries with large scale gold/copper projects       • Open pit mining and use     • Increased royalty             • Illegal strikes and local
                                                                            of cyanide banned in          structure and challenging       opposition delays for
                                                                            certain areas                 power/water supply              approved projects (Conga,
                                                                                                          issues                          Santa Anna, Tintaya)
                                                                          • 100% tax on export
                                                                            earnings for some           • Local opposition delays       • Rising concerns regarding
                                                                            resource projects             for approved projects (El       administration and
                                                                                                          Morro, Pascua-Lama)             enforcement of existing
                                                                          • Near bottom in global
                                                                                                                                          regulations1
                                                                            rankings for investment
                                                                            attractiveness and policy
                                                                            perception1

                                                                                Ecuador                     Indonesia                        Mongolia
                                                                          • High royalty and tax        • Creeping expropriation        • Increasing government
                                                                            environment                   through imposed local and       tax, royalty and ownership
                                      CANADA                              • Uncertainty regarding
                                                                                                          government ownership
                                                                                                          (Batu Hijau, Grasberg,
                                                                                                                                          demands
                                                                            government                                                  • 100% tax on export
                                                                                                          Tujuh Bukit)
                                                                            administration,                                               earnings for some
▶ Stable regulatory and tax regime                                          environmental regulations   • Lack of transparency in         resource projects
                                                                            and legal system              the government mining
▶ Established, reliable procedures for obtaining permits including                                        department1
                                                                          • Consistently near the
  deadlines for government agencies                                         bottom in global policy
                                                                            perception rankings1
▶ Consistently ranked near the top in Fraser Institute’s annual global
  rankings for investment attractiveness & policy perception1

 1. Source: Fraser Institute Annual Survey of Mining Companies for 2019

 TSX: SEA | NYSE: SA                                                                                                                seabridgegold.com | 2022     12
KSM PROJECT British Columbia, Canada
KSM:
A RARE, WORLD-CLASS PROJECT IN A TOP MINING JURISDICTION

▶ World’s largest undeveloped gold/copper project by gold and copper
  resources
▶ Located in mining-friendly British Columbia near existing and past
  producers
        ▶    Adjacent to established infrastructure

        ▶    Access to regional workforce and supplies

        ▶    Established procedures for obtaining permits

ENVIRONMENTAL AND SOCIAL APPROVALS
▶ B.C. Environmental Assessment certificate issued July 2014
▶ Federal Environmental approval received December 2014
▶ Established social license with local communities
        ▶    Signed Impact Benefit Agreements with Nisg̱a’a and Tahltan Nations

        ▶    Letters of support received from Terrace, Smithers and the Gitxsan
             Nation

        ▶    Non opposition agreement with Gitanyow Nation

TSX: SEA | NYSE: SA                                                               seabridgegold.com | 2022   14
SIGNIFICANT REGIONAL & LOCAL INFRASTRUCTURE N
37
▶ Northwest Transmission Line completed in 2014
▶ ~31.5 km between powerline to KSM process plant
▶ Paved Highway 37 allows efficient transport to and from port and mine – in
use to support Brucejack and Red Chris
▶ Two nearby ports at Stewart B.C. BRITISH COLUMBIA
Bob Quinn Airstrip
▶ Two nearby regional airports and a local airstrip
▶ Recent federal and provincial government additional funding to complete Forrest Kerr Hydroelectric
bringing fiber-optic communications to the Tahltan Territory
KSM
ALASKA Northwest
37A Transmission Line
Port of Stewart
Seabridge Asset 37
Airport
16
Airstrip
Highway Sm ithers Reginal Airport
Railway
Hydroelectric Asset CN Rail
Transmission Lines Northwest Reginal Airport
Fiber Optic Cable Port of Prince Rupert
Ports / Port Towns
0 50 100 Kitimat
kilometers
TSX: SEA | NYSE: SA seabridgegold.com | 2022 15MULTI-GENERATIONAL DISTRICT POTENTIAL
▶ Mine plans focused on highest grade and most economic portions of deposits
▶ Current mine plans capture less than 1/4 of total mineral resources and does
not include the East Mitchell (formerly Snowfield) deposit
NI 43-101 COMPLIANT RESERVES & RESOURCES
Zo ne C atego ry To nnage Grade C o ntained
M tonnes g/t Au % Cu g/t Ag ppm Mo M oz Au M lbs Cu M oz Ag M lbs Mo
Mitchell P&P 1,394 0.61 0.17 3.1 53 27.5 5,092 140 164
M&I 1,795 0.59 0.17 3.1 58 34.3 6,639 179 230
Inferred 478 0.42 0.12 3.2 52 6.4 1,230 49 55
Iron Cap P&P 224 0.49 0.20 3.6 12 3.5 983 26 6
M&I 423 0.41 0.22 4.6 41 5.6 2,051 63 38
Inferred 1,899 0.45 0.30 2.6 30 27.5 12,556 159 126
Kerr P&P 276 0.22 0.43 1.0 3 2.0 2,586 9 2
M&I 374 0.22 0.41 1.1 5 2.7 3,405 14 4
Inferred 1,999 0.31 0.40 1.8 23 19.8 17,720 114 103
Sulphurets P&P 304 0.59 0.22 0.8 52 5.8 1,495 8 35
M&I 446 0.55 0.21 1.0 53 7.9 2,064 14 52
Inferred 223 0.31 0.41 1.3 31 3.2 639 9 15
East Mitchell M&I 1,370 0.59 0.10 1.7 n.a. 25.9 2,980 76 n.a.
Inferred 833 0.34 0.06 1.9 n.a. 9.0 1,100 51 n.a.
Note: blue lines indicate KSM property boundaries following announced transaction to acquire 100% of the
A ll P &P 2, 198 0. 55 0. 21 2. 6 43 38 . 8 10, 155 18 3 207 Snowfield deposit now renamed East Mitchell property
M&I 4, 408 0. 54 0. 18 2. 4 48 76. 4 17, 139 346 324
I nferred 5, 432 0. 38 0. 28 2. 2 29 65. 9 33, 245 38 2 299
9.8B tonnes following East Mitchell (Snowfield) acquisition
Note: M&I resources are inclusive of reserves
TSX: SEA | NYSE: SA seabridgegold.com | 2022 162016 PREFEASIBILITY STUDY
Unit Years 1-7 LOM (53 Years)
▶ Combined open pit/underground block caving operation Total Tonnes to Mill M tonnes 323 2,199
▶ Over initial 33 years, majority of ore sourced from open pit mines Annual Tonnes to Mill M tonnes 46.1 41.5
Average Grade
▶ 130K tpd operation over years 2 to 35, ramping down to 95K tpd Gold g/t 0.82 0.55
for next 10 years and 60K tpd for remaining life Copper % 0.24 0.21
▶ Conventional flotation and gold extraction mill producing clean Silver g/t 2.8 2.6
gold-silver-copper concentrate Molybdenum ppm 48 43
Average Annual Production
▶ Designed to align with regulatory approvals for project Gold 000 oz 933 540
construction and operation included in federal and provincial Copper M lbs 205 156
Environmental Assessments Silver M oz 2.6 2.2
Molybdenum M lbs 1.6 1.2
▶ In 2020, independent consultants conducted an extensive data
Unit Base Recent Spot
verification exercise on the 2016 PFS
Metal Prices
▶ Determined that there are no material changes in the Gold US$/oz $1,230 $1,850
outcomes of the 2016 PFS Copper US$/lb $2.75 $4.50
Silver US$/oz $17.75 $27.50
Molybdenum US$/lb $8.49 10.00
US$:C$ Exchange Rate 0.80 0.82
Cash Op Costs (net of by-products) US$/oz Au $277 -$219
2016 PFS excludes the delineated All-In Total Costs (net of by-products) US$/oz Au $673 $160
Initial Capital Costs US$B $5.0 $5.1
inferred mineral resources at Deep Kerr After Tax Cash Flow US$B $10.0 $30.9
and Iron Cap Lower Zone After-Tax NPV5%
After-Tax IRR
US$B
%
$1.5
8.0
$8.1
17.4
Payback Period years 6.8 3.4
TSX: SEA | NYSE: SA seabridgegold.com | 2022 17DEEP KERR AND LOWER IRON CAP: KERR NI 43-101 CONTAINED RESOURCES
GAME CHANGING DEPOSITS
Contained Gold (M oz) Contained Copper (B lbs)
25 25
▶ Since discovering Deep Kerr in 2013, Seabridge has added ~43M oz Au
and 29.5B lbs Cu of inferred resources 20
720% 20
547%
▶ Deep Kerr and Iron Cap’s grades and size compare favorably with some of increase increase
15 15
the world’s largest and most profitable operating copper-gold mines
▶ 2016 PEA demonstrated significant economic improvements from Deep 10 10
Kerr higher-grade resources
5 5
▶ Recent studies further enhance economics with additions from Iron Cap
and engineering improvements 0 0
2012 2020 2012 2020
Contained Gold (M oz) Contained Copper (B lbs)
DEEP KERR AND IRON CAP INFERRED RESOURCES 35 16
286% 390%
30 14
Zone Tonnage Grade Contained
12
25
M tonnes g/t Au % Cu M oz Au M lbs Cu increase
10
increase
20
Deep Kerr 1,921 0.31 0.41 19.1 17,359 8
15
Iron Cap 1,899 0.45 0.30 27.5 12,556 6
10
4
Total 3,820 0.38 0.36 46.6 29,915 5 2
0 0
2012 2020 2012 2020
Measured & Indicated Inferred
TSX: SEA | NYSE: SA seabridgegold.com | 2022 18EAST MITCHELL (FORMERLY SNOWFIELD) British Columbia, Canada
EAST MITCHELL (SNOWFIELD) ACQUISITION
                                                                                        Map showing the close proximity of the East Mitchell
▶ On December 17, 2020, Seabridge completed the acquisition of 100% of the              deposit to the Mitchell deposit at KSM
  East Mitchell (formerly Snowfield) Property from Pretivm Resources (“PVG”)
▶ East Mitchell deposit hosts a large gold resource immediately adjacent to
  KSM’s Mitchell deposit                                                                                                IRON CAP
▶ Upfront payment to PVG of US$100M in cash plus a 1.5% NSR on East Mitchell
  ore
       ▶    Seabridge retains ROFR on this NSR royalty
                                                                                                                 MITCHELL
▶ Transaction was financed through a concurrent US$115M bought deal public
                                                                                                                                                SNOWFIELD
  offering of common shares
▶ Future conditional cash payment of US$20M to PVG within 6 months
  following the earlier of (i) commencement of commercial production from
  East Mitchell, or (ii) completion of a bankable feasibility study which includes
                                                                                                           SULPHURETS
  East Mitchell reserves
       ▶    US$15M of this conditional payment can be credited against future royalty
            payments on the 1.5% NSR
▶ Work has commenced on an updated PFS to incorporate East Mitchell into the             NSR $/T
  KSM mine plan                                                                             > 75
                                                                                           50 - 75
                                                                                           25 - 50
                                                                                           16 - 25
                                                                                                              KERR
                                                                                           KSM PROJECT

                      Accretive, low cost per ounce acquisition with                       EOY2019 NSR
                                                                                         BLOCK MODELS IN
                                     substantial synergies with KSM                         PLAN VIEW

TSX: SEA | NYSE: SA                                                                                                                seabridgegold.com | 2022   20
EAST MITCHELL: EAST MITCHELL DEPOSIT NI 43-101 PIT CONSTRAINED RESOURCE ESTIMATE
ACQUIRING A WORLD-SCALE GOLD DEPOSIT
Zone Cut-off Tonnage Grade Contained
RIGHT NEXT DOOR TO KSM
g/t AuEq millions g/t Au g/t Ag % Cu M oz Au M oz Ag B lbs Cu
M&I 0.30 1,370.1 0.59 1.72 0.10 25.92 75.78 2.98
▶ 17% accretive in gold ounces per share
Inferred 0.30 833.2 0.34 1.90 0.06 9.03 50.96 1.10
▶ Low acquisition cost of only US$3/oz Au
▶ Expected to integrate well with KSM M&I 1.50 104.5 1.32 2.11 0.16 4.43 7.10 0.36
Inferred 1.50 7.1 1.21 5.72 0.29 275 1.31 0.05
▶ Expected to materially increase KSM’s existing reserves
Source: NI 43-101 “Technical Report and Updated Resource Estimate on the East Mitchell Property” prepared by P&E
▶ East Mitchell’s forecast strip ratio is below 1:1 Mining Consultants Inc., February 2011
▶ Metallurgical test work confirms East Mitchell deposit can be blended
successfully with Mitchell ore LARGEST GOLD DEPOSITS IN TIER 1 MINING JURISDICTIONS1
▶ Current KSM environmental approvals includes haul roads through the 120.0 M&I Inferred
East Mitchell deposit Property
Gold Resources (M oz)
100.0
▶ Expected to enhance KSM’s NPV, IRR and initial capital payback Seabridge will own 3 of the 15 largest gold
80.0
period beyond 2020 PEA estimates projects in Tier 1 mining jurisdictions
60.0
▶ Enables new development opportunities that could substantially
improve project economics 40.0
▶ Likely brings higher grade gold into initial phase of mining, extending 20.0
the years that KSM produces over 1M oz of gold 0.0
▶
Livengood
Kalgoorlie
Canadian Malartic
Snowfield
Courageous Lake
Donlin
Cadia East
Boddington
Blackwater
Potentially postpones capital-intensive development of Iron Cap and
New Prosperity
KSM
Nevada Gold Mines
Hycroft
Cote
Porcupine
Deep Kerr block caves until much later in the 40+ year mine life
▶ Further de-risks KSM Project
Source: company reports. Tier 1 mining jurisdictions includes Canada, U.S., Australia, Scandinavia and Ireland
TSX: SEA | NYSE: SA seabridgegold.com | 2022 21COURAGEOUS LAKE Northwest Territories, Canada
COURAGEOUS LAKE PROJECT (100% INTEREST)
▶ 503 km2 property located south of Courageous Lake approximately 240 km northeast of
  Yellowknife in the Northwest Territories
        ▶     Lies on a historic mining district that includes two past producing gold mines
▶ Project located on winter ice road within 100 km of the Diavik and Ekati open pit diamond mines
        ▶     Demonstrates feasibility of year-round open pit bulk tonnage operations
▶ 52 km long land position covering 85% of the Matthews Lake Greenstone Belt
▶ FAT is one Canada’s largest undeveloped gold deposits by reserves
▶ Walsh Lake is ~10 km south of the FAT deposit and demonstrates potential for discovery of new
  higher-grade deposits

                    NI 43-101 COMPLIANT RESERVE AND RESOURCE ESTIMATES
          Deposit              Cut-off Grade                    Category                  Tonnage            Grade         Contained
                                    g/t Au                                                M tonnes           g/t Au          M oz Au
            FAT1                      N/A                     P&P reserves                   91.0             2.20             6.50
                                      0.83                   M&I resources                  107.3             2.31             7.97
                                      0.83                Inferred resources                 53.6             2.27             3.91
        Walsh Lake                    0.60                Inferred resources                  4.6             3.24             0.48

Note: M&I resources are inclusive of reserves
1. Resource estimate for the FAT deposit is from a NI 43-101 compliant technical report prepared by Tetra Tech Wardrop dated September 5, 2012. A total of 589 holes (169,000 m) have been drilled on the FAT deposit by Seabridge, Placer Dome
   and Noranda. M&I and inferred resource estimates are undiluted. P&P reserves were estimated using a series of Lerchs-Grossman pit shell optimizations using a NSR cut-off of C$20.50/tonne estimated from a gold price of US$1,244/oz, strip ratio
   of 12.5:1 and assumes 5% dilution and 5% mine loss
2. Resource estimate for the Walsh Lake deposit was presented in a new release dated March 11, 2014 and completed under NI 43-101 standards by Resources Modelling Inc. Walsh Lake resource model is based on 53 diamond core holes (totaling
   17,450 m). Resource estimate is constrained within a conceptual pit limit based on a gold price of US$1,300/oz, recovery of 90% and pit slope of 50 degrees
 TSX: SEA | NYSE: SA                                                                                                                                                                                          seabridgegold.com | 2022              23
2012 PFS DEMONSTRATES PROFITABLE MINE
WITH EXCEPTIONAL LEVERAGE HIGHLIGHTS OF THE 2012 PFS
Unit Base Recent Spot Change
▶ 2012 PFS for the Courageous Lake deposit is based on a single open- Gold Price US$/oz $1,384 $1,850
pit mining operation with on-site processing Exchange Rate US$:C$ 0.98 0.82
Mine Life years 15 15
▶ Project economics improve considerably when applying a more
LOM Ore M tonnes 91.1 91.1
current gold price (US$1,800/oz) and exchange rate LOM Average Grade g/t Au 2.20 2.20
(US$0.78:C$1.00) Throughput Rate tpd 17,500 17,500
▶ Numerous opportunities to enhance project economics LOM Average Strip Ratio waste:ore 12.5:1 12.5:1
Recovery Rate % 89.4 89.4
▶ Access to lower-cost hydro-electric generated power, which also reduces
Average Annual
diesel inventory and storage costs 000 oz Au 385 385
Production
▶ PFS assumes project access by winter road, which would be available 3 Cash Costs
months per year. Year-round road access could substantially reduce Years 1-5 US$/oz Au $674 $579 -14%
OPEX, CAPEX and working capital requirements LOM US$/oz Au $780 $668 -14%
All-in Costs US$/oz Au $1,123 $953 -15%
▶ Recently completed internal studies confirm the potential for a smaller,
less capital intensive and more economic robust starter project.
Initial Capex US$M $1,522 $1,273 -16%
Pre-Tax Cash Flow US$M $1,507 $5,170 +243%
▶ Evaluating best path forward to unlock value for shareholders Pre-Tax NPV5% US$M $303 $2,564 +746%
including potential sale or joint venture Pre-Tax IRR % 7.3 24.2 +232%
Payback Period years 11.2 3.3 -71%
TSX: SEA | NYSE: SA seabridgegold.com | 2022 24ISKUT PROJECT British Columbia, Canada
ISKUT PROJECT (100% INTEREST)
▶ 294 km2 property located in northern British Columbia, ~110 km
  northwest of Stewart, BC
▶ Only 20 km by air from the KSM Project
▶ Includes the former high-grade Johnny Mountain gold mine and the
  Bronson Slope Cu-Au deposit
       ▶     Johnny Mountain produced 90.5K oz Au, 19.8K oz Ag and 2.2M lbs Cu at 11.3
             g/t Au, 2.5 g/t Ag and 0.40% Cu
▶ Since acquiring in June 2016, three years of exploration has identified a
  large intrusive system likely responsible for the Quartz Rise lithocap
       ▶     Geophysical footprint extend to depth of at least 800 m
       ▶     Previous exploration focused only on high-grade epithermal zones

     BRONSON SLOPE PIT CONSTRAINED NI 43-101 RESOURCE ESTIMATE

 Category       Tonnage           Grade                       Contained                     Pit constrained resource estimate prepared by Burgoyne Geological Inc. on behalf of Skyline Gold Corporation in a NI 43-101
                                                                                            compliant technical report dated May 7, 2012. This resource estimate assumes the following:
                M tonnes     g/t Au    % Cu     g/t Ag   M oz Au       M lbs Cu   M oz Ag   • Strip ratio of 0.77:1
                                                                                            • LOM average recoveries of 85% for gold, 86% for copper and 64% for silver
    M&I           186.9      0.360     0.122    2.192      2.163       502.66      13.20    • Metal prices of US$700/oz for gold, US$2.00/lb for copper and US$15.00/oz for silver and exchange rate of
                                                                                                US$0.85:C$1.00
  Inferred         4.9       0.321     0.074    2.187       8.1         0.05       0.35     Note: Seabridge has not reported a resource for the Bronson Slope deposit. Seabridge expects to be able to report an
                                                                                            independent NI 43-101 compliant resource estimate for this deposit when it has completed its own review of the data and
                                                                                            undertaken appropriate confirmatory work

 TSX: SEA | NYSE: SA                                                                                                                                                        seabridgegold.com | 2022              26
EXPLORING FOR GOLD-COPPER PORPHYRY SIMILAR TO DEEP KERR AT ISKUT
▶ In 2020 completed a 9,000 m drill program to test the large intrusion system ▶ 2020 drilling encountered 32 meters at 0.62% copper and 158 meters at 0.16
identified in the 2019 program g/T gold and 0.16% copper in zones believed to be outer portions of gold-
▶ followed rigorous procedures to minimize risks of COVID-19 copper porphyry
▶ Drilled across 750 m of strike and 800 m of vertical projection on coincident ▶ Follow-up drill program planned for 2022
magnetic and IP anomalies below and west of the well-developed lithocap ▶ Undertaking environmental work to ensure compliance and remediation
▶ Similar magnetic and resistivity anomalies that led to the discovery of the programs to mitigate impact of historical mining activity
Deep Kerr zone ▶ Ongoing engagement with the Tahltan First Nation and B.C. regulatory
▶ 2020 drill program provided further evidence for a large gold-copper officials
porphyry system which may lie below drilling completed to date
TSX: SEA | NYSE: SA seabridgegold.com | 2022 27SNOWSTORM PROJECT Nevada, USA
SNOWSTORM PROJECT (100% INTEREST)

▶ 102.8 km2 property located in the northern Snowstorm Mountains in
  Humbold and Elko counties, Nevada
       ▶    Located in an established gold mining region with access to key regional
            infrastructure
▶ Sits on the intersection of three major Nevada gold belts where over 300M
  oz of gold has been discovered
       ▶    Getchell, Carlin and the Northern Nevada Rift Zone
▶ Contiguous and on strike with several large producing gold mines
       ▶    6 km north of Nevada Gold Mine’s (Barrick and Newmont JV) Twin Creeks mine
            and 15 km northwest of the Turquoise Ridge mine (combined 19.8M oz Au of
            resources and 25.8M oz of production through end of 2019)
▶ Geologic, geochem and geophysical data documents hydrothermal
  alteration zones and structural settings consistent with large Nevada gold
  deposits
       ▶    During 2019 drill program, Seabridge encountered the same Ordovician
            carbonate stratigraphy that is characteristic of Getchell-style deposits
       ▶    2020 drill program confirmed the presence of gold in the system
                                                                                         Large, early-stage property with potential for a
       ▶    2021 drill program ongoing to be completed in Q1 2022
                                                                                                       major gold discovery

 TSX: SEA | NYSE: SA                                                                                                     seabridgegold.com | 2022   29
ALL THE RIGHT INGREDIENTS FOR A MAJOR DISCOVERY AT SNOWSTORM
Pictures of the Twin Creeks mine
▶ Best place to look for new deposits is in close proximity to existing mines
▶ 2021 program focuses on Twin Creeks and Turquoise Ridge type targets
▶ Challenging exploration (targets are deep under cover) with major discovery potential
(patience is required)
▶ Seabridge’s exploration team is well suited to explore this exciting project
▶ Worked at Placer Dome during the initial drilling at Turquoise Hill
Picture of the Turquoise Ridge Complex
TSX: SEA | NYSE: SA seabridgegold.com | 2022 303 ACES PROJECT Yukon Territory, Canada
3 ACES PROJECT (100% INTEREST)
▶ In May 2020, Seabridge acquired 100% of the 3 Aces Project in the Yukon
  from Golden Predator Mining
       ▶    Upfront payment of 300K shares and a 0.5% NSR royalty
       ▶    Conditional future cash payments of C$1.0M on discovery of 2.5M oz Au, plus a
            further C$1.25M on finding an additional 2.5M oz Au

▶ 314 km2 property located in southwestern Yukon Territory with year-round
  access
       ▶    Accessible by road through Yukon Highway 10
       ▶    Includes 25-person exploration camp

▶ District-scale, orogenic gold project with many sizable, near surface, high-
  grade gold zones identified
▶ High-grade gold showings over entire 35 km strike length of property
▶ Exploration permits in hand and excellent working relationship with First
  Nations
▶ Geophysics and surface mapping/sampling program completed in 2021
▶ Drill program planned for 2022
                                                                                            Rare combination of high-grades plus
                                                                                                       district-scale

 TSX: SEA | NYSE: SA                                                                                                  seabridgegold.com | 2022   32
Hole ID DH Type From (m) To (m) Intercept (m) Gold (g/t)
Spades High-Grade Zone
3A16-032 RC 16.76 27.43 10.67 32.86
POTENTIAL HIGH-GRADE, BULK-MINEABLE 3A16-042 RC 17.53 24.38 6.85 25.61
GOLD DEPOSIT AT 3 ACES
3A16-044 RC 17.53 35.05 17.52 3.65
3A17-100 RC 19.05 25.91 6.86 20.15
3A17-124 RC 6.10 10.67 4.57 58.75
3A17-132 DD 20.00 33.30 13.30 6.69
3A17-127 RC 12.95 19.05 6.10 22.30
▶ Geological setting similar to some of the world’s largest and 3A17-133 DD 23.80 40.00 16.80 20.50
and DD 57.50 65.00 7.50 13.92
richest gold deposits 3A17-138 DD 7.50 15.50 8.00 50.40
3A17-157 DD 19.00 23.20 4.20 20.04
▶ Located on the eastern margin of the Selwyn Basin (host to several
3A17-208 RC 0.76 5.33 4.57 81.35
enormous base metal deposits 3A17-209 RC 2.29 23.62 21.33 18.33
3A17-211 RC 1.52 9.91 8.39 14.05
▶ Polyphase fold and fault systems overprint the stratigraphy, creating 3A17-218 RC 5.33 18.29 12.96 14.19
ideal traps for gold-bearing fluids in quartz veins 3A17-220 RC 1.52 15.24 13.72 43.02
3A17-224 RC 1.52 11.43 9.91 21.81
▶ 300 holes drilled in the Central Core Area, with 37% intersecting 3A17-238 RC 0.76 9.91 9.15 41.03
Hearts Zone
+5 g/t Au and 27% with +8 g/t Au
3A16-048 RC 96.01 104.49 8.38 6.39
▶ Halo of lower grade zones exists outside of high-grade gold zones 3A16-054 RC 38.86 58.67 19.81 4.76
3A16-055 RC 51.05 60.20 9.15 9.37
▶ Bulk sampling programs recovered 86% to 95% of gold in gravity 3A16-082 DD 42.67 60.96 18.29 16.75
3A16-084 DD 103.98 115.82 11.84 1.72
circuit 3A16-085 RC 86.87 96.01 9.14 8.65
3A17-203 RC 10.67 30.48 19.81 3.32
▶ Currently planning an aggressive drill program for 2022 Other occurrences
3A17-143 DD 12.70 32.00 19.30 16.15
3A17-144 RC 5.33 52.58 47.25 1.11
3A17-147 DD 13.00 15.50 2.50 15.51
and DD 18.50 22.00 3.50 21.44
3A17-275 RC 40.39 48.77 8.38 5.24
3A18-335 DD 16.20 33.06 16.86 1.35
3A17-175 RC 32.00 33.53 1.53 36.33
TSX: SEA | NYSE: SA seabridgegold.com | 2022 33WHY INVEST IN SEABRIDGE
UNPARALLELED LEVERAGE IN EMERGING GOLD AND COPPER BULL MARKETS
OWNERSHIP OF THE LARGEST UNDEVELOPED GOLD/COPPER PROJECT IN THE WORLD
UPSIDE FROM LARGE NORTH AMERICAN EXPLORATION PROJECT PORTFOLIO
ADDITION OF SNOWFIELD EXPECTED TO SIGNIFICANTLY IMPROVE KSM ECONOMICS
KSM JV AGREEMENT WITH MAJOR MINING COMPANY EXPECTED TO UNLOCK VALUE
EXCELLENT RECORD OF CREATING SHAREHOLDER VALUE WITH MINIMAL SHARE DILUTION
seabridgegold.com | 2022 34EXPLORATION IS NOT REPLACING GOLD PRODUCED Source: S&P Global Market Intelligence & Barrick Gold corporate presentation TSX: SEA | NYSE: SA seabridgegold.com | 2022 35
GOLD MINERS PRESERVING CAPITAL AS RESERVES FALL
Gold vs. Miners' CAPEX
$2,000 Top 50 Miners by Market Cap in the Canadian & US Stock Exchanges $25,000
$1,800
$1,600 $20,000
Aggregate Annual CAPEX ($US Millions)
$1,400
Gold Price ($ / Ounce)
$1,200 $15,000
$1,000
$800 $10,000
$600
$400 $5,000
$200
- -
1996
1997
1998
1999
2000
2001
2002
2003
2004
2005
2006
2007
2008
2009
2010
2011
2012
2013
2014
2015
2016
2017
2018
2019
2020
Gold Price Aggregate CAPEX
Source: Bloomberg.
TSX: SEA | NYSE: SA seabridgegold.com | 2022 36LESS CAPEX SPENDING = MORE CASH FLOW
Gold vs. Miners' Free Cash Flow Yield
5% Median Trailing 12-Month Free Cash Flow to Enterprise Value
-
Gold Price ($ / Ounce)
(5%)
(10%)
(15%)
(20%)
1995
1996
1997
1998
1999
2000
2001
2002
2003
2004
2005
2006
2007
2008
2009
2010
2011
2012
2013
2014
2015
2016
2017
2018
2019
2020
Source: Bloomberg.
TSX: SEA | NYSE: SA seabridgegold.com | 2022 37PROVEN MANAGEMENT TEAM
Rudi Fronk • Over 35 years of experience in the gold industry, primarily as a senior officer and director of publicly
traded companies
Bruce Scott • Has practiced law in the areas of corporate finance and securities, corporate and mining since 1993
and has been counsel to Seabridge since 1999
CHAIRMAN AND CEO VP, GENERAL COUNSEL Partner at DuMoulin Black LLP from 1998 to 2011 and prior to that worked in a full-service
• In 1999, co-founded Seabridge and has acted as CEO since that time •
AND CORPORATE Vancouver-based law firm that is part of Borden Ladner Gervais LLP
• Bachelor of Science in Mining Engineering and a Master of Science in Mineral Economics from Columbia
SECRETARY
University • LL.B. from University of Toronto and B.A. (hons) in Economics from Western University
Jay Layman • COO at Seabridge since February 2011
Mike Skurski • Over 30 years of mining experience in various technical, operational and leadership roles from
early-stage studies through to mine reclamation
• Responsible for designing and managing technical programs to advance the KSM and Courageous Lake
PRESIDENT AND COO VP, TECHNICAL SERVICES Previously with Newmont Mining
projects through PFS studies •
• Former VP Solutions and Innovations at Newmont Mining Corporation
• Bachelors Degrees in Mechanical Engineering and Finance from Washington State University and an MBA
from Eastern Washington University
Chris Reynolds • Over 30 years of mining industry and public accounting experience. Previously served as VP, Finance and
CFO of Norsemont Mining Inc. and held various finance and accounting positions at SouthernEra Diamonds
Elizabeth Miller •
•
20 years of experience as a Biologist and Environmental Specialist in BC and Canada’s north
Responsible for the environmental, social, regulatory programs and indigenous affairs
VP, FINANCE AND CFO Inc., Southern Platinum Corp., TVX Gold Inc., Inmet Mining Corporation and PricewaterhouseCoopers VP, ENVIRONMENT AND
• CPA and holds a Bachelor of Arts degree in Economics at McGill University SOCIAL RESPONSIBILITY
Bill Threlkeld • Over 35 years of exploration experience, including 19 years at Seabridge where he has designed and
executed exploration programs that have defined more than 45 million ounces of M&I gold resource Ryan Hoel • More than 20 years of experience in large-scale project management, development, and operations
with companies including Rio Tino, Lundin Mining, New Gold, Arizona Mining, and South32
SENIOR VP, Previously served as VP and Exploration Manager at Placer Dome and led the discovery and delineation of
VP, PROJECTS
• • Bachelor of Science in Mining Engineering from the South Dakota School of Mines and Technology,
EXPLORATION the Las Cristinas (Venezuela, 9.7M oz Au) Cerro Crucitas (Costs Rica, 2.3M oz Au) and Mulatos (Mexico, an MBA from Westminster Gore School of Business, and is a registered Professional Engineer
2.0M oz Au) deposits
• MSc in Economic Geology from the University of Western Ontario and BSc in Geology from Colorado State
University
Peter Williams • Over 37 years of experience in mine engineering, design, strategic analysis and start-ups
Julie Rachynski • 25 years of experience in human resources in the resource industry at site and at corporate levels,
including mining, pulp and paper, wood products, and timberlands
• Responsible for managing the engineering of Seabridge’s two main projects (KSM and Courageous Lake)
SENIOR VP, TECHNICAL VP, HUMAN RESOURCES • Bachelor of Business Administration with Human Resource Major from Simon Fraser University -
SERVICES • Formerly a group executive of Mine Engineering at Newmont Mining Corporation
registered Human Resources Professional in British Columbia and the Yukon
Brent Murphy • Over 30 years of experience, responsible for developing and managing Seabridge's environmental
programs and community engagement strategies
Tracey Meintjes • 25 years of experience in mining project development in North America, South America, Europe and
Africa.
SENIOR VP, VP, ENGINEERING Recent practice as a consultant followed a career with Anglo American, Anglo Gold, Rio Tinto and
• Instrumental in leading the technical and social teams that obtained the federal and provincial •
ENVIRONMENTAL environmental assessment approvals for KSM in 2014 following a 7-year review process
STUDIES Teck
AFFAIRS Registered Professional Engineer
• Former Chief Environmental Officer for the EKATI Diamond Mine and the Environmental Manager for •
NovaGold (Alaska) . Exploration geologist who holds a M.Sc. In Geology from Acadia University
TSX: SEA | NYSE: SA seabridgegold.com | 2022 38EXPERIENCED BOARD OF DIRECTORS
Over 35 years of experience in the gold industry, primarily as a senior officer and director of publicly traded companies
Rudi Fronk •
• In 1999, co-founded Seabridge and has acted as CEO since that time
EXECUTIVE CHAIRMAN AND CEO • Bachelor of Science in Mining Engineering and a Master of Science in Mineral Economics from Columbia University
• COO at Seabridge since February 2011
Jay Layman • Responsible for designing and managing technical programs to advance the KSM and Courageous Lake projects through PFS studies
DIRECTOR, PRESIDENT AND COO • Former VP Solutions and Innovations at Newmont Mining Corporation
• Bachelors Degrees in Mechanical Engineering and Finance from Washington State University and an MBA from Eastern Washington University
Over 28 years of experience in mining, geology, geotechnical engineering, mining engineering and project management
Trace Arlaud
•
• Served as Chief Engineer at PT Freeport in Indonesia and held engineering roles at WMC Resources Ltd. and Normandy Ltd. both of Australia
DIRECTOR • Masters of Mining Engineering from the University of Ballarat and an BSc with Honours from La Trobe University
• With over 30 years of experience, Mr. Gonzalez-Urien is one of the most highly regarded exploration geologists in the mining industry
Eliseo Gonzalez-Urien • From 1989 through 2001 Mr. Gonzalez-Urien held various executive positions with Placer Dome Inc. including Senior Vice President of the parent company and President of
DIRECTOR Placer Dome Exploration Inc.
• Degree in Geology from the University of Santiago, Chile, followed by post graduate studies in Geology at the University of California, Berkeley
Accomplished business leader (as investor, director and senior executive) across many industries with an emphasis on mining
Richard Kraus
•
• From 1981-1997, served in various senior roles (CEO, COO and CFO) of Echo Bay Mines (major gold mining company acquired by Kinross in 2003)
DIRECTOR • Currently Executive Chairman of The RMH Group, Inc., a privately owned engineering consulting firm with more than 100 employees
Melanie Miller • Executive with over 20 years of success leading business and supply chain innovation for Fortune 500 organizations
DIRECTOR • Two undergraduate degrees from Miami University of Ohio and has pursued graduate education at both University of Chicago and Harvard
• Process chemist/metallurgist by training with 14 years in industry and 36 years in resource-related environmental consulting
Clement Pelletier • In 1981, founded the Rescan Group, a industry-leading mining/mineral processing engineering & environmental consulting firm
DIRECTOR • Managed large Environmental Impact Studies and permitting for major projects such as the KSM Project, the Jansen Potash Project, Goro Nickel, the Voisey’s Bay Nickel
Project, Escondida, the Ekati Diamond Mine and others
John Sabine • Seasoned lawyer practicing in Toronto with extensive experience in mining, corporate reorganization, securities, financing, and M&A
DIRECTOR • Former director and CEO of Arbor Memorial Services Inc and was non-executive Chair of Anvil Mining Limited and of North American Nickel Inc
Gary Sugar • Well-known former mining investment banker with 32 years at RBC Capital Markets, including 24 years as a Managing Director
DIRECTOR • Holds a BSc in Geology and an MBA, both from the University of Toronto
TSX: SEA | NYSE: SA seabridgegold.com | 2022 39CONTACT US HEADQUARTERS SEABRIDGE OFFICE Toronto, ON Smithers, BC +1 416 367 9292 +1 250 847 4704 +1 416 367 2711 +1 416 367 2711 info@seabridgegold.com ksm_community@seabridgegold.com 106 Front Street East, Suite 400 1330 Main Street Toronto, ON, Canada, M5A 1E1 Smithers, BC, Canada, V0J 2N0
You can also read