Feather mercury increases with feeding at higher trophic levels in two species of migrant raptors, Merlin (Falco columbarius) and Sharp-shinned ...

Page created by Manuel Phillips
 
CONTINUE READING
Feather mercury increases with feeding at higher trophic levels in two species of migrant raptors, Merlin (Falco columbarius) and Sharp-shinned ...
AmericanOrnithology.org

                                                                                                                   Volume 122, 2020, pp. 1–17
                                                                                                                  DOI: 10.1093/condor/duz069

RESEARCH ARTICLE

                                                                                                                                                Downloaded from https://academic.oup.com/condor/advance-article-abstract/doi/10.1093/condor/duz069/5741362 by AOS Member Access user on 26 February 2020
Feather mercury increases with feeding at higher trophic levels in two
species of migrant raptors, Merlin (Falco columbarius) and Sharp-shinned
Hawk (Accipiter striatus)
Edward R. Keyel,1,2* Matthew A. Etterson,3,4 Gerald J. Niemi,1,2,4 David C. Evers,5 Christopher R. DeSorbo,5
Joel C. Hoffman,3 John W. Nichols,3 Yang Li,6 and Frank Nicoletti4
1
  Department of Biology, University of Minnesota Duluth, Duluth, Minnesota, USA
2
  Natural Resources Research Institute, University of Minnesota, Duluth, Minnesota, USA
3
  U.S. Environmental Protection Agency, Mid-Continental Ecology Division, Duluth, Minnesota, USA
4
  Hawk Ridge Bird Observatory, Duluth, Minnesota, USA
5
  Biodiversity Research Institute, Portland, Maine, USA
6
  Department of Mathematics and Statistics, University of Minnesota Duluth, Duluth, Minnesota, USA
*Corresponding author: erkeyel@gmail.com
Submission Date: June 4, 2019; Editorial Acceptance Date: January 1, 2020; Published February 20, 2020

    ABSTRACT
    Mercury (Hg) is a toxic heavy metal that, when methylated to form methylmercury (MeHg), bioaccumulates in exposed
    animals and biomagnifies through food webs. The purpose of this study was to assess Hg concentrations in raptors
    migrating through the upper midwestern USA. From 2009 to 2012, 966 raptors of 11 species were captured at Hawk
    Ridge, Duluth, Minnesota, USA. Breast feathers were sampled to determine the concentration of total Hg. Mean Hg con-
    centrations ranged from 0.11 to 3.46 μg g−1 fresh weight across species and were generally higher in raptors that feed on
    birds in comparison with those that feed on mammals. To evaluate the effect of dietary sources on Hg biomagnification,
    carbon and nitrogen stable isotope ratios were measured in feathers of the 2 species with the highest Hg concentrations,
    Merlin (Falco columbarius) and Sharp-shinned Hawk (Accipiter striatus). Measured δ 13C values were similar in both spe-
    cies and indicated a primarily terrestrial-derived diet, whereas δ 15N values suggested that individual Merlin and Sharp-
    shinned Hawk feeding at higher trophic levels accumulated higher concentrations of Hg. The risk to birds associated with
    measured levels of feather Hg was evaluated by calculating blood-equivalent values using an established algorithm.
    Predicted blood values were then compared to heuristic risk categories synthesized across avian orders. This analysis
    suggested that while some Merlin and Sharp-shinned Hawk were at moderate risk to adverse effects of MeHg, most of
    the sampled birds were at negligible or low risk.
    Keywords: bioaccumulation, biomagnification, falcons, hawks, methylmercury, owls, stable isotopes

    El mercurio de las plumas aumenta con los alimentos de niveles tróficos más altos en dos especies de
    rapaces migratorias, Falco columbarius y Accipiter striatus
    RESUMEN
    El mercurio (Hg) es un metal pesado tóxico que, cuando se metila para formar metilmercurio (MeHg), se acumula en
    los tejidos de los animales expuestos y se bio-magnifica a través de las redes tróficas. El propósito de este estudio fue
    evaluar las concentraciones de Hg en rapaces que migran a través de la parte alta del medio oeste de Estados Unidos. De
    2009 a 2012, capturamos 966 rapaces de 11 especies en Hawk Ridge, Duluth, Minnesota, EEUU. Tomamos muestras de
    plumas del pecho para determinar la concentración de Hg total. Las concentraciones medias de Hg fluctuaron entre 0.11
    y 3.46 μg g−1 de peso fresco para las distintas especies y fueron generalmente más altas en las rapaces que se alimentan
    de aves en comparación con aquellas que se alimentan de mamíferos. Para evaluar el efecto de las fuentes de alimento
    sobre la bio-magnificación de Hg, se midieron los cocientes de isótopos estables de carbón y nitrógeno en las plumas
    de las dos especies con las concentraciones más altas de Hg, Falco columbarius y Accipiter striatus. Los valores medidos
    de δ 13C fueron similares en ambas especies e indicaron una dieta derivada principalmente del medio terrestre, mientras
    que los valores de δ 15N sugirieron que los individuos de F. columbarius y A. striatus que se alimentan a niveles tróficos
    más altos acumularon concentraciones más altas de Hg. El riesgo para las aves asociado con los niveles medidos de Hg
    en las plumas fue evaluado mediante el cálculo de valores equivalentes en sangre usando un algoritmo establecido. Los
    valores predichos en sangre fueron luego comparados con categorías de riesgo heurístico sintetizadas a través de los
    órdenes de aves. Este análisis sugirió que mientras algunos individuos de F. columbarius y A. striatus tuvieron un riesgo
    moderado a los efectos adversos de MeHg, la mayoría de las aves muestreadas tuvieron un riesgo insignificante o bajo.
    Palabras clave: bio-acumulación, bio-magnificación, búhos, halcones, isótopos estables, metilmercurio

Copyright © American Ornithological Society 2020. All rights reserved. For permissions, e-mail: journals.permissions@oup.com.
Feather mercury increases with feeding at higher trophic levels in two species of migrant raptors, Merlin (Falco columbarius) and Sharp-shinned ...
2   Mercury increases with δ15N in two raptor species                                     E. R. Keyel, M. A. Etterson, G. J. Niemi, et al.

INTRODUCTION                                                      Heinz and Hoffman 2004, Ackerman et al. 2007, French
                                                                  et al. 2010). For most birds, however, the primary route
For decades, researchers have used standardized raptor            of MeHg elimination is deposition into feathers (Honda

                                                                                                                                              Downloaded from https://academic.oup.com/condor/advance-article-abstract/doi/10.1093/condor/duz069/5741362 by AOS Member Access user on 26 February 2020
count data to assess population trends of North American          et al. 1986, Braune and Gaskin 1987, Fournier et al. 2002,
raptors. These data have proven useful for identifying popu-      Nichols et al. 2010, Whitney and Cristol 2017a). Feathers
lations in decline (Farmer et al. 2007). A variety of factors     reflect circulating levels of MeHg at the time they were
have been implicated in broad-scale population declines           formed. Specific feathers can represent different, discrete
of raptors, including environmental contaminants such as          periods of exposure throughout an individual’s life history
pesticides (e.g., DDT; Grier 1982, Falk et al. 2006), indus-      because molting patterns are often documented and pre-
trial chemicals (e.g., PCBs and dioxins; Bowerman et al.          dictable (Ramos et al. 2009). Over 95% of Hg in feathers
1995), and pharmaceuticals (e.g., diclofenac; Green et al.        exists as MeHg (Thompson and Furness 1989, Thompson
2004). In such cases, raptors may act as indicator species        et al. 1990, Evers et al. 2005). Measured total Hg in feathers
(Niemi and McDonald 2004) for potential contaminant               may therefore be used as an index of MeHg exposure (Evers
impacts on other species, including humans (Bowerman              et al. 2005, 2011; Rimmer et al. 2005).
et al. 2002).                                                        Stable isotope analysis of carbon and nitrogen in
   Mercury (Hg) is another contaminant of concern for             feathers can be used to evaluate relative trophic position
raptors (Albers et al. 2007). While occurring naturally in        and to trace MeHg sources in the diet (Atwell et al. 1998,
the environment, human activities such as chlor-alkali            Tavares et al. 2009, Lavoie et al. 2013, Carravieri et al. 2014,
production, combustion of fossil fuels, and gold mining           Øverjordet et al. 2015). The isotopic composition of tis-
have increased the availability of Hg to aquatic and terres-      sues reflects the diet during the period of tissue growth
trial wildlife (Wiener et al. 2003, Driscoll et al. 2007, 2013;   and maintenance (Hobson and Clark 1992, Bearhop et al.
Evers et al. 2007). Of special concern is the methylated          2002). Thus, the ratio of 15N:14N in feathers (the δ 15N value)
form of Hg (MeHg), which is formed from inorganic Hg2+            can be used to determine the trophic position relative to a
by sulfate-reducing bacteria (Compeau and Bartha 1985,            baseline and of one individual or species relative to another
Ullrich et al. 2001). In addition to its high toxicity, MeHg      (Thompson and Furness 1995, Bearhop et al. 2002). On
tends to accumulate in tissues over time (i.e. bioaccumu-         average, the trophic discrimination in birds (the increase in
lation; Haney and Lipsey 1973, Scheuhammer et al. 2011).          15
                                                                    N relative to 14N between feathers and diet) is 3.8 ± 0.3‰
Dietary uptake of MeHg is highly efficient and can result         (mean ± SE; Caut et al. 2009). In contrast, δ 13C values of
in increasing MeHg concentrations at successively higher          an organism’s tissues tend to more closely resemble those
trophic levels (i.e. biomagnification; Jaeger et al. 2009).       of their diet (average trophic discrimination of 2.2 ± 0.4‰;
   Biogeochemical conditions present in aquatic ecosys-           Caut et al. 2009). However, the δ 13C value may be useful
tems are generally more conducive to Hg methylation than          to trace dietary sources because δ 13C values vary among
those in terrestrial ecosystems (Compeau and Bartha 1985,         primary producers and ecosystem types (Walker et al.
Ullrich et al. 2001). As a result, much of the research to        2015). In particular, δ 13C values for phytoplankon in lake
date on Hg in birds has been focused on piscivorous birds         food webs are generally lower (less than −30‰) than values
such as the Common Loon (Gavia immer; Meyer et al.                associated with plants in terrestrial food webs (typically
1995, Evers et al. 1998a, 2008; Scheuhammer et al. 1998),         −30‰ to −26‰; Peterson and Fry 1987). The existence of
Bald Eagle (Haliaeetus leucocephalus; Bowerman et al.             a lower δ 13C value in feathers may therefore provide evi-
2002, Rutkiewicz et al. 2011, DeSorbo et al. 2018), and           dence for consumption of food associated with freshwater
Osprey (Pandion haliaetus; Anderson et al. 2008, Rumbold          ecosystems (Hebert et al. 2009), recognizing that littoral
et al. 2017). More limited data exist for species associated      and wetland habitat food webs often have δ 13C values
with terrestrial ecosystems such as the American Kestrel          similar to or more 13C-enriched than terrestrial food webs
(Falco sparverius; Albers et al. 2007, Fallacara et al. 2011),    (Gurney et al. 2017).
Peregrine Falcon (F. peregrinus; Mora et al. 2002, Barnes            The primary purpose of this study was to assess fea-
and Gerstenberger 2015), Sharp-shinned Hawk (Accipiter            ther Hg concentrations in migrant raptors using the
striatus; Wood et al. 1996), Golden Eagle (Aquila                 Central Flyway of North America in autumn. In addition,
chrysaetos; Langner et al. 2015), Red-tailed Hawk (Buteo          stable isotopes were measured in 2 species, Merlin (Falco
jamaicensis; Bourbour et al. 2019), Red-shouldered Hawk           columbarius) and Sharp-shinned Hawk, to compare their
(B. lineatus; Bourbour et al. 2019), and Cooper’s Hawk            relative trophic position and to characterize likely dietary
(Accipiter cooperii; Bourbour et al. 2019).                       sources (aquatic vs. terrestrial food sources). We hypothe-
   Birds eliminate MeHg by several routes including loss          sized that after hatch year (AHY), or adult birds, would have
in urine-feces, elimination through hepatic demethylation         higher feather Hg concentrations than hatch year (HY), or
(Thompson and Furness 1989, Scheuhammer et al. 1998),             first-year birds, because AHY birds have a longer exposure
and deposition into eggs (Becker 1992, Lewis et al. 1993,         history and more limited Hg depuration options compared

The Condor: Ornithological Applications 122:1–17, © 2020 American Ornithological Society
E. R. Keyel, M. A. Etterson, G. J. Niemi, et al.                                   Mercury increases with δ15N in two raptor species   3

to HY birds, which lessen their overall Hg burden through                Mercury Analysis
mass dilution and extensive feather growth during nest-                  One feather per individual was analyzed for total Hg
ling development. We also predicted that birds feeding at                concentration by thermal decomposition spectropho-

                                                                                                                                             Downloaded from https://academic.oup.com/condor/advance-article-abstract/doi/10.1093/condor/duz069/5741362 by AOS Member Access user on 26 February 2020
a higher trophic level (as indicated by higher δ 15N) or con-            tometry (EPA method 7473) using a DMA-80 Direct
suming prey from an aquatic-based food web (as indicated                 Mercury Analyzer (Milestone) at the BRI Toxicology Lab
by lower δ 13C) would have higher concentrations of fea-                 at Biodiversity Research Institute in Portland, Maine, fol-
ther Hg than those feeding at a lower trophic level or con-              lowing methods described by Evers et al. (2005). Feathers
suming prey from a terrestrial-based food web.                           were prepared for analysis using a protocol employed by
                                                                         U.S. Fish and Wildlife Service contract laboratories (e.g.,
METHODS                                                                  Texas A&M University; R. Taylor, personal communica-
                                                                         tion). Only feathers with no visual evidence of external
Study Area                                                               debris were analyzed. Feathers were not washed, as this
All samples were collected between 2009 and 2012 during                  protocol does not recommend washing unless external
fall migration (September through November) from the                     contamination is of concern. Quality control methods
Hawk Ridge Bird Observatory banding station at Duluth,                   including the use of analytical blanks, sample replicates,
Minnesota, USA (46.85°N, −92.03°W), located near the                     and certified reference materials DOLT-4, DORM-3, and
westernmost point of Lake Superior. Situated at ~300 m                   DORM-4, were employed to evaluate analytical precision
above sea level, Hawk Ridge is positioned on basalt rock                 and accuracy. Total Hg concentrations in all feathers were
that extends along the north shore of the lake. This unique              above the method detection limit (0.001 µg g−1). Measured
location concentrates large numbers of birds of prey, and                Hg concentrations in Certified Reference Materials (CRMs,
on average, the banding station bands over 2,600 raptors                 National Research Council, Canada, and Joint Research
each fall (Evans et al. 2012). Limited band recovery data                Centre, European Union) incorporated into each sample
suggest that diurnal raptors migrating past Duluth likely                run averaged 100% (DOLT-4), 103.7% (DORM-3), and
originate from breeding grounds in western Canada and                    97.9% (DORM-4) of published values. Feather Hg concen-
northern Minnesota (Evans et al. 2012).                                  trations are presented in μg g−1 on a fresh weight (fw) basis.
                                                                         Previous work has shown that Hg concentrations can vary
Raptor Sampling                                                          among feathers in different parts of the plumage of indi-
Birds were captured using mist, bow, and dho gaza nets                   vidual birds (Furness et al. 1986, Braune and Gaskin 1987,
(Evans et al. 2012; Table 1). Captured birds were identified,            Peterson et al. 2019). Although we did not sample multiple
aged, and sexed using methods described by Pyle (2008).                  feather tracts, we controlled for variation among feathers
Two to four breast feathers were plucked from each sam-                  within birds and standardized comparisons across birds by
pled bird, inspected for external debris, and placed into                limiting our sampling to only breast feathers.
envelopes. Feathers were chosen because they represent a                    We also analyzed limited duplicates (e.g., a separate
reliable index of Hg exposure during the time of feather                 breast feather from the same individual) to verify consist-
growth (Bearhop et al. 2000, Kenow et al. 2007, Condon                   ency in Hg concentrations among breast feathers within
and Cristol 2009) and because they can be sampled non-                   the same individuals. For duplicates we calculated percent
invasively and easily preserved at room temperature for                  relative difference and Pearson’s correlation coefficient.
long periods.                                                            Because HY birds were known to have grown all feathers

TABLE 1. Number of individuals sampled. All samples are from Hawk Ridge, Duluth, Minnesota, USA, and were collected from 2009 to
2012. Sample sizes are given for individual age and sex classes. Age is either hatch year (HY), after hatch year (AHY), or unknown (U);
sex is either male (M), female (F), or unknown (U).
Common name                       Scientific name           Total        HY         AHY         U         Male         Female           U
Northern Harrier                  Circus hudsonius           30           25          5          0         17           13               0
Sharp-shinned Hawk                Accipiter striatus        392          197        195          0        179          213               0
Cooper’s Hawk                     Accipiter cooperii         11            4          7          0          7            4               0
Northern Goshawk                  Accipiter gentilis        222          196         26          0        152           70               0
Red-shouldered Hawk               Buteo lineatus              1            1          0          0          0            0               1
Broad-winged Hawk                 Buteo platypterus           5            5          0          0          0            0               5
Swainson’s Hawk                   Buteo swainsoni             1            1          0          0          0            0               1
Long-eared Owl                    Asio otus                  88           15         68          5          7            7              74
American Kestrel                  Falco sparverius           71           53          5         13         37           34               0
Merlin                            Falco columbarius         137          117         20          0         77           60               0
Peregrine Falcon                  Falco peregrinus            8            8          0          0          5            3               0

                                                The Condor: Ornithological Applications 122:1–17, © 2020 American Ornithological Society
4   Mercury increases with δ15N in two raptor species                                     E. R. Keyel, M. A. Etterson, G. J. Niemi, et al.

within a recent and well-defined timeframe (i.e. nestling          as the sum of AICc weights (wi) for each model in which the
development), we also analyzed duplicates and calculated           variable occurred (Burnham and Anderson 2002). A list of
the same statistics within HY and AHY age class groups.            all models considered for Merlin and Sharp-shinned Hawk

                                                                                                                                              Downloaded from https://academic.oup.com/condor/advance-article-abstract/doi/10.1093/condor/duz069/5741362 by AOS Member Access user on 26 February 2020
The fw of a feather is nearly equivalent to dry weight (dw;        is provided (Table 2).
R. Taylor, TERL, Texas A&M University; mean % feather                 Correlations between ln(feather Hg) and δ 13C, and be-
moisture  M) was observed only for Merlin and combined age
from the lowest and highest Hg results for each class. Each        and sex categories (an age*sex interaction) were significant
feather sample was cleaned with a 2:1 chloroform:methanol          for 4 species (Table 3). Regardless of the interaction be-
solution (Hobson 1999), placed in a pre-combusted scintil-         tween age and sex, AHY Merlin and Sharp-shinned Hawk
lation vial, and dried at 50°C for at least 24 hr. After drying,   had the highest geometric mean (± geometric standard
the sample was minced and 0.7 μg analyzed with a Costec            deviation) Hg concentrations, 4.56 μg g−1 fw (2.02) and
4010 EA and Thermo Delta Plus XP isotope ratio mass                4.30 μg g−1 fw (1.68), respectively (Figure 1). Similarly, geo-
spectrometer. Stable isotope ratios are reported in standard       metric mean Hg concentrations in HY Merlin and Sharp-
δ notation, wherein Vienna Pee Dee Belemnite and air are           shinned Hawk were higher than those in HY birds of other
standards for δ 13C and δ 15N, respectively. Analytical error,     species, 1.37 μg g−1 fw (1.66) and 1.41 μg g−1 fw (1.53), re-
calculated as the mean standard deviation of replicate ref-        spectively; Figure 1).
erence material, was
E. R. Keyel, M. A. Etterson, G. J. Niemi, et al.                                      Mercury increases with δ15N in two raptor species       5

TABLE 3. Analysis of variance results for natural log-transformed Hg concentrations [ln(Hg)] in feathers by sex, age, and all sex and age
combinations (cohort). All samples were collected from Hawk Ridge, Duluth, Minnesota, USA, from 2009 to 2012. Bold values indicate
statistical significance of P ≤ 0.05. For age and sex, df = 1. For all species, cases in which age or sex were unknown were dropped prior
to ANOVA.

                                                                                                                                                   Downloaded from https://academic.oup.com/condor/advance-article-abstract/doi/10.1093/condor/duz069/5741362 by AOS Member Access user on 26 February 2020
                                            Sex                                Age                                   Cohort
                                 n           F           P          n           F           P          n         df             F          P
Northern Harrier                 30         3.3         0.08        30         7.5        0.01         30        3              2.9     0.05
Sharp-shinned Hawk              392         0.2         0.69       392       542.9        0.00        392        3            181.3     0.00
Northern Goshawk                222         0.1         0.75       222         8.3        0.00        222        3              3.1     0.03
Long-eared Owl                   14         0.0         0.95        83         1.5        0.22         12        2              0.1     0.92
American Kestrel                 71         0.6         0.44        58         5.3        0.02         58        3              2.3     0.09
Merlin                          137         6.8         0.01       137        86.0        0.00        137        3             31.5     0.00

                                                                           age received the highest AICc weight among all variables,
                                                                           followed closely by year (Table 5). Although the sex*age
                                                                           interaction was selected in 2 of the top 3 models, neither
                                                                           the interaction, nor the main effect of sex, was bounded
                                                                           away from zero by the confidence limits. The year effect in
                                                                           the top 2 models, which included Year only as an additive
                                                                           effect, was bounded away from zero and indicated a decline
                                                                           in feather Hg over the 4 years of sampling. Ln(feather Hg)
                                                                           concentrations were higher in Sharp-shinned Hawk caught
                                                                           in 2009 compared to the 2010–2012 sampling years, and
                                                                           this was true for both age classes (Table 6).
                                                                              For Merlin, 4 models were required to account for 99% of
                                                                           model weight, of which the top 3 received almost equal weight
                                                                           (Table 7). Date and age were included in all 4 of the top models.
                                                                           In general, coefficients suggested increasing ln(feather Hg) with
                                                                           age, although presence of an interaction term, such as date, could
                                                                           reverse this relationship (Table 8). Male Merlin tended to have
                                                                           lower ln(feather Hg) concentrations than females and this effect
                                                                           was generally bounded away from zero by the 95% confidence
                                                                           limit. However, year showed little effect on ln(feather Hg) in
                                                                           Merlin, with the 95% confidence limit typically encompassing
                                                                           zero. In general, the top models suggested slightly increasing
                                                                           ln(feather Hg) concentration in Merlin with date as the season
                                                                           progressed (Figure 2). Variable importance values calculated
                                                                           using AICc reinforced these patterns with age and date receiving
                                                                           considerable support, followed by sex, and lastly year (Table 8).
                                                                              There was considerable overlap of δ 13C values determined
                                                                           for Merlin and Sharp-shinned Hawk (Figure 3). Mean δ 13C
FIGURE 1. Geometric mean feather mercury (Hg) concentra-                   values for the 2 species were −21.8‰ (range: −24.1‰ to
tion (ug g−1 fw) by sex for (A) hatch year birds (juvenile) and (B)        −16.2‰) and −22.0‰ (range: −23.6‰ to −20.7‰), respect-
after hatch year (adult) raptors banded at Hawk Ridge, Duluth,             ively. These δ 13C values were consistent across age and sex
Minnesota, USA, 2009–2012. Data are shown for species with a
total sample size (all ages) >20. Sample size is given above each
                                                                           cohorts and suggest that individuals sampled were feeding
bar and error bars represent geometric standard deviation.                 from a terrestrial-based food web. Measured δ 13C values
                                                                           were not significantly correlated with ln(feather Hg) for ei-
                                                                           ther Merlin or Sharp-shinned Hawk.
  The best linear model for ln(feather Hg) concentration                      The mean δ15N value for Merlin (all age classes pooled) was
for Sharp-shinned Hawk, receiving 65% of AICc weight                       7.0‰ (range: 3.6‰ to 13.8‰) while that for Sharp-shinned
(wi), included age and year as additive effects (Table 4).                 Hawk (all age classes pooled) was 6.2‰ (range: 4.0‰ to 9.0‰)
The next-best models, together receiving about 25% of wi,                  (Figure 3). The δ15N values for Merlin were positively correlated
included a sex*age interaction (Table 4). Coefficients and                 with ln(feather Hg) (r = 0.29, P < 0.05) across all pooled age and
95% confidence limits (CL) for these 6 models indicate that                sex classes. For Sharp-shinned Hawk, feather δ15N values were

                                                  The Condor: Ornithological Applications 122:1–17, © 2020 American Ornithological Society
6   Mercury increases with δ15N in two raptor species                                           E. R. Keyel, M. A. Etterson, G. J. Niemi, et al.

TABLE 4. Sample-size adjusted Akaike information criterion scores (ΔAICc), AICc weights (wi), and adjusted R2 values for Sharp-shinned
Hawk banded at Hawk Ridge, Duluth, Minnesota, USA, 2009–2012. All models relate ln(feather Hg) to the factors and covariates listed.
Date is the ordinal day from 1 to 365; year is a factor that takes values 2009, 2010, 2011, and 2012; sex is either male or female; age is ei-
ther hatch year (HY) or after-hatch year (AHY). K is the number of estimated parameters in each model, wi is the relative likelihood of the

                                                                                                                                                    Downloaded from https://academic.oup.com/condor/advance-article-abstract/doi/10.1093/condor/duz069/5741362 by AOS Member Access user on 26 February 2020
model, as measured by Akaike weights. Models with interaction terms always include the associated main effects. N = 392. Minimum
AICc = 520.8. Models presented are the minimal model set accounting for at least 99% of AICc wi.
Model                                   K                 ΔAICc                    wi                   CumWt                      Adjusted R2
Age + Year                              4                  0.0                    0.65                   0.65                          0.59
Year + Sex*Age                          6                  3.2                    0.13                   0.79                          0.59
Date*Year + Sex*Age                     8                  3.3                    0.12                   0.91                          0.59
Date*Age                                5                  5.5                    0.04                   0.95                          0.59
Age + Date                              4                  6.2                    0.03                   0.98                          0.59
Date + Sex*Age                          6                  8.8                    0.01                   0.99                          0.59

also positively correlated with ln(feather Hg) (r = 0.30, P < 0.01).    studies have shown that inter-feather variability in Hg
These correlations were driven primarily by significant correl-         concentration may increase uncertainty in the interpret-
ations between ln(feather Hg) and δ15N in HY birds of both spe-         ation of study results when only a single feather is analyzed
cies. The relationship was not significant for AHY birds alone for      (Cristol et al. 2012, Peterson et al. 2019) as we have done.
either species, though the sample size was small for AHY Merlin         However, a comparison of duplicate feathers in a subset of
(n = 19).                                                               birds showed less variation among feathers in our samples
   We analyzed 40 duplicate breast feathers. Mean (SD)                  than has been reported elsewhere (mean relative differ-
percent relative difference (PRD) across all duplicates was             ence
E. R. Keyel, M. A. Etterson, G. J. Niemi, et al.                                                                                                                                                                                                                                                                        Mercury increases with δ15N in two raptor species   7

                                                                                                                                                                                                                                                                                                             Sex Patterns

                 TABLE 5. Coefficients and 95% confidence limits for Sharp-shinned Hawk linear models of ln(feather Hg) in relation to factors and covariates. Only the 6 best models, ac-
                 counting for over 99% of model weight, are presented. Columns are models and rows are coefficients. Blank cell indicates coefficient did not occur in model. wi are AICc weights.
                                                                                                                                                                                                     Var. Wt

                                                                                                                                                                                                                           0.27
                                                                                                                                                                                                                           0.27
                                                                                                                                                                                                                           0.20
                                                                                                                                                                                                                           0.91
                                                                                                                                                                                                                           0.12
                                                                                                                                                                                                                                                                                                             Mercury concentrations in feathers were significantly higher

                                                                                                                                                                                                                            1
                                                                                                                                                                                                                            1
                                                                                                                                                                                                                                                                                                             in female Merlin than in males. For the other species exam-

                                                                                                                                                                                                                                                                                                                                                                                 Downloaded from https://academic.oup.com/condor/advance-article-abstract/doi/10.1093/condor/duz069/5741362 by AOS Member Access user on 26 February 2020
                                                                                                                                                                                                                                                                                                             ined, there were no significant differences in Hg concentra-

                                                                                                                                                                                                     Date + Sex*Age

                                                                                                                                                                                                                                                                                    −0.12 (−0.31, 0.07)
                                                                                                                                                                                                                                                                                                             tion related to sex, which is consistent with previous findings

                                                                                                                                                                                                                           −0.9 (−1.89, 0.09)

                                                                                                                                                                                                                           0.05 (−0.09, 0.18)
                                                                                                                                                                                                                            1.12 (0.99, 1.25)
                                                                                                                                                                                                                                                                                                             in raptors (Barnes et al. 2019, Bourbour et al. 2019). Reverse

                                                                                                                                                                                                                               0 (0, 0.01)
                                                                                                                                                                                                                                                                                                             sexual dimorphism is greater in accipiters, such as Sharp-

                                                                                                                                                                                                                                                                                           0.01
                                                                                                                                                                                                                                                                                                             shinned Hawk, than other raptor taxa (Snyder and Wiley
                                                                                                                                                                                                                                                                                                             1976). For the Sharp-shinned Hawk, sex was a poor predictor
                                                                                                                                                                                                                                                                                                             of Hg concentration (P = 0.91). Therefore, like age, the rela-
                                                                                                                                                                                                                                                                                                             tionship between sexual size dimorphism and MeHg accu-
                                                                                                                                                                                                                                                                                                             mulation may not be simple. Complicating these patterns
                                                                                                                                                                                                                           −0.78 (−1.69, 0.13)
                                                                                                                                                                                                                            1.07 (0.97, 1.17)

                                                                                                                                                                                                                                                                                                             is the fact that females eliminate MeHg through egg laying,
                                                                                                                                                                                                     Age + Date

                                                                                                                                                                                                                                                 0 (0, 0.01)

                                                                                                                                                                                                                                                                                             0.03            temporarily lowering blood MeHg concentrations (Becker
                                                                                                                                                                                                                                                                                                             1992, Lewis et al. 1993, Heinz and Hoffman 2004, Ackerman
                                                                                                                                                                                                                                                                                                             et al. 2007). Bioenergetic considerations may also play a role
                                                                                                                                                                                                                                                                                                             because MeHg exposure is largely determined by the amount
                                                                                                                                                                                                                                                                                                             of contaminated food consumed. If, on average, the weight-
                                                                                                                                                                                                                                                                                                             normalized consumption rate (g food per day per g body
                                                                                                                                                                                                                           −1.46 (−2.68, −0.2)

                                                                                                                                                                                                                                                                                                             weight) for each sex is approximately the same, differences in
                                                                                                                                                                                                                             2.64 (0.77, 4.5)

                                                                                                                                                                                                                                                 0.01 (0, 0.01)

                                                                                                                                                                                                                                                                                                             size would be offset by comparable differences in the mass of
                                                                                                                                                                                                     Date*Age

                                                                                                                                                                                                                                                                                             0.04

                                                                                                                                                                                                                                                                                                             food consumed, resulting in similar whole-body MeHg con-
                                                                                                                                                                                                                                                                                                             centrations (assuming similar rates of elimination and selec-
                                                                                                                                                                                                                                                                                                             tion of similar prey items by males and females). Conversely,
                                                                                                                                                                                                                                                                                                             if the consumption rate for one of the sexes is higher (e.g., due
                                                                                                                                                                                                                                                                                                             to higher levels of activity or the energetic demands of repro-
                                                                                                                                                                                                     Date*Year + Sex*Age

                                                                                                                                                                                                                                                                                                             duction), then MeHg concentrations achieved in these birds
                                                                                                                                                                                                                           −0.07 (−0.26, 0.12)
                                                                                                                                                                                                                           −1.35 (−7.35, 4.65)
                                                                                                                                                                                                                           −0.25 (−1.06, 0.56)
                                                                                                                                                                                                                           507 (−1120, 2135)

                                                                                                                                                                                                                            0.03 (−0.1, 0.17)
                                                                                                                                                                                                                            1.14 (1.01, 1.27)

                                                                                                                                                                                                                                                                                                             may be higher than those achieved in the other sex, regardless
                                                                                                                                                                                                                                 0 (0, 0)

                                                                                                                                                                                                                                                                                                             of sex-specific differences in size.
                                                                                                                                                                                                                                  0.12

                                                                                                                                                                                                                                                                                                             Food Selection
                                                                                                                                                                                                                                                                                                             Differences in feather Hg concentrations among raptor
                                                                                                                                                                                                                                                                                                             species were expected to reflect differences in the extent to
                                                                                                                                                                                                                                                                                                             which they fed in aquatic vs. terrestrial food webs as well as
                                                                                                                                                                                                                                                             −0.08 (−0.12, −0.03)

                                                                                                                                                                                                                                                                                                             their relative trophic position. More specifically, we exam-
                                                                                                                                                                                                     Year + Sex*Age

                                                                                                                                                                                                                                                                                    −0.04 (−0.23, 0.15)
                                                                                                                                                                                                                           0.06 (−0.07, 0.19)
                                                                                                                                                                                                                            1.17 (1.05, 1.3)
                                                                                                                                                                                                                             157 (66, 247)

                                                                                                                                                                                                                                                                                                             ined whether an aquatic influence in the diet could explain
                                                                                                                                                                                                                                                                                                             elevated Hg concentrations in Sharp-shinned Hawk and
                                                                                                                                                                                                                                                                                           0.13

                                                                                                                                                                                                                                                                                                             Merlin. Assuming a typical δ 13C trophic discrimination
                                                                                                                                                                                                                                                                                                             (+2.2‰) and an effective trophic level of between 3 and 4,
                                                                                                                                                                                                                                                                                                             the observed δ 13C values suggested that both species were
                                                                                                                                                                                                                                                                                                             feeding primarily in terrestrial-based food webs (i.e. a diet
                                                                                                                                                                                                                                                                                                             source of approximately −28‰ to −30‰). If a freshwater
                                                                                                                                                                                                                                                             −0.08 (−0.12, −0.03)

                                                                                                                                                                                                                                                                                                             food web influence had been important, there should
                                                                                                                                                                                                                           1.15 (1.06, 1.25)
                                                                                                                                                                                                     Age + Year
                                                                                                                                                                                                                            160 (70, 249)

                                                                                                                                                                                                                                                                                                             have been lower (i.e. more negative) δ 13C values associ-
                                                                                                                                                                                                                                                                                             0.65

                                                                                                                                                                                                                                                                                                             ated with higher Hg concentrations. In comparison, δ 13C
                                                                                                                                                                                                                                                                                                             values of freshwater-dependent species such as Common
                                                                                                                                                                                                                                                                                                             Loon (blood, −27‰; Burgess and Hobson 2006), Lesser
                                                                                                                                                                                                                                                                                                             Scaup (Aythya affinis; muscle, −26‰; Gurney et al. 2017),
                                                                                                                                                                                                                                                                                                             and Herring Gull (Larus argentatus; eggs, less than −24‰;
                                                                                                                                                                                                                                                                                                             Hebert et al. 2009), are far lower than values determined
                                                                                                                                                                                                                           SexM.AgeAHY
                                                                                                                                                                                                                           Model Weight

                                                                                                                                                                                                                                                                                                             for Sharp-shinned Hawk (−22.0‰) and Merlin (−21.9‰)
                                                                                                                                                                                                                           Date.Year
                                                                                                                                                                                                                           Intercept

                                                                                                                                                                                                                                                                                                             in this study. Beyond diet source, other factors that affect
                                                                                                                                                                                                                           AgeAHY

                                                                                                                                                                                                                                                                                                             tissue–diet discrimination include metabolic activity and
                                                                                                                                                                                                                           SexM
                                                                                                                                                                                                                           Date
                                                                                                                                                                                                                           Year

                                                                                                                                                                                                                                                                                                             tissue type (Bearhop et al. 2002). The δ 13C value calculated

                                                                                                                                                                                                                                                                                    The Condor: Ornithological Applications 122:1–17, © 2020 American Ornithological Society
8   Mercury increases with δ15N in two raptor species                                          E. R. Keyel, M. A. Etterson, G. J. Niemi, et al.

TABLE 6. Sample size (n), mean date, geometric mean feather Hg (μg g−1 fw) and confidence limits on the geomean by year for hatch
year (HY) and after hatch year (AHY) Sharp-shinned Hawk sampled at Hawk Ridge, Duluth, Minnesota, USA.
Year              Age               n              Date                GeoMean Hg                 Lower 95% CL                 Upper 95% CL

                                                                                                                                                   Downloaded from https://academic.oup.com/condor/advance-article-abstract/doi/10.1093/condor/duz069/5741362 by AOS Member Access user on 26 February 2020
2009              HY               35              Oct 2                   1.95                       1.62                          2.35
2010              HY               69              Sep 12                  1.29                       1.20                          1.38
2011              HY               37              Sep 19                  1.37                       1.23                          1.52
2012              HY               56              Sep 17                  1.32                       1.18                          1.48
2009              AHY              26              Oct 4                   5.92                       4.97                          7.05
2010              AHY              13              Sep 30                  2.99                       2.55                          3.52
2011              AHY              81              Sep 24                  4.19                       3.73                          4.70
2012              AHY              75              Oct 2                   4.22                       3.77                          4.73

TABLE 7. Sample-size adjusted Akaike information criterion scores (ΔAICc), AICc weights (wi), and adjusted R2 values for Merlin banded
at Hawk Ridge, Duluth, Minnesota, USA, 2009–2012. Models relate ln(feather Hg) to specified factors and covariates. Date is the ordinal
day from 1 to 365; year is a factor that takes values 2009, 2010, 2011, and 2012; sex is either male or female; age is either hatch year (HY)
or after hatch year (AHY). K is the number of estimated parameters in each model; wi is the relative likelihood of the model, as measured
by Akaike weights. Models with interaction terms always include the associated main effects. n = 137. Minimum AICc = 211.6. Models
presented are the minimal model set accounting for at least 99% of AICc wi.
Model                                    K                  ΔAICc                  wi                  CumWt                      Adjusted R2
Date + Sex*Age                           6                  0.0                   0.32                   0.32                         0.45
Date*Year + Sex*Age                      8                  0.1                   0.31                   0.63                         0.46
Date*Age                                 5                  0.1                   0.30                   0.93                         0.44
Age + Date                               4                  3.5                   0.06                   0.99                         0.42

TABLE 8. Coefficients and 95% confidence limits for Merlin linear models of ln(feather Hg). Only the 4 best models, accounting for
over 99% of model weight, are presented. Columns are models and rows are coefficients. Blank cell indicates coefficient did not occur
in model. Wts are AICc weights.
                    Date + Sex * Age           Date * Year + Sex * Age       Date * Age                   Age + Date                   Var. Wt.
Intercept           −3.09 (−5.1, −1.08)        1227 (−4239, 6692)            −2.14 (−4.29, 0.01)          −3.03 (−5.08, −0.98)         1.00
AgeAHY              0.89 (0.53, 1.26)          0.86 (0.5, 1.23)              −6.99 (−13.65, −0.33)        0.96 (0.66, 1.25)            1.00
SexM                −0.25 (−0.44, −0.06)       −0.26 (−0.44, −0.07)                                                                    0.64
Date                0.01 (0.01, 0.02)          −3.8 (−25.28, 17.68)          0.01 (0, 0.02)               0.01 (0.01, 0.02)            0.99
Year                                           −0.61 (−3.33, 2.11)                                                                     0.31
Date.Year                                      0 (−0.01, 0.01)                                                                         0.31
SexM.AgeAHY         0.04 (−0.45, 0.52)         0.04 (−0.44, 0.52)                                                                      0.63
Model Wt.           0.320                      0.306                         0.304                        0.056

                                                                         in the present study for Sharp-shinned Hawk is somewhat
                                                                         higher than the mean value (−25.6‰) given previously by
                                                                         Hobson (1999). The δ 15N value (7.1‰) reported by Hobson
                                                                         (1999) for this species is similar to that determined in
                                                                         this study.
                                                                            For both Sharp-shinned Hawk and Merlin, AHY birds
                                                                         had higher δ 15N values than HY birds. Moreover, in mul-
                                                                         tiple Sharp-shinned Hawk sex and age classes, higher δ 15N
                                                                         values were significantly correlated with higher Hg con-
                                                                         centrations, supporting the idea that trophic position is
                                                                         an important driver of MeHg exposure. Both species are
                                                                         known to prey extensively on birds. Bourbour et al. (2019)
                                                                         also found that raptors consuming predominantly avian
FIGURE 2. Relationship of ln(Hg) (μg g−1 fw) to date by age class
                                                                         prey had higher concentrations of total Hg than raptors
in Merlin. All feathers were collected at Hawk Ridge, Duluth,            not consuming a high percentage of avian prey. Songbirds
Minnesota, USA, 2009–2012. Feather Hg concentrations did not             that consume a high proportion of spiders or other preda-
vary significantly with date in either hatch year or adult birds.        tory invertebrates may have elevated tissue concentrations

The Condor: Ornithological Applications 122:1–17, © 2020 American Ornithological Society
E. R. Keyel, M. A. Etterson, G. J. Niemi, et al.                                   Mercury increases with δ15N in two raptor species   9

of total Hg (Jackson et al. 2015). Additional studies have               size and age of individuals and migratory departure date.
shown that spiders may contain high concentrations of                    Date was not an important predictor variable in the Sharp-
either total or methyl Hg (Cristol et al. 2008, Gann et al.              shinned Hawk models. Instead, year was more important

                                                                                                                                            Downloaded from https://academic.oup.com/condor/advance-article-abstract/doi/10.1093/condor/duz069/5741362 by AOS Member Access user on 26 February 2020
2015). Therefore, consumption of insectivorous songbirds                 than ordinal day. Sharp-shinned Hawk captured in 2009
may help explain higher Hg concentrations in some in-                    had the highest Hg concentrations, whereas those cap-
dividual Sharp-shinned Hawk and Merlin (Jackson et al.                   tured in 2010 had the lowest Hg concentrations. These
2011, 2015).                                                             patterns are consistent for both age classes. The basis for
                                                                         these observed year-to-year differences in Hg concentra-
Temporal Differences                                                     tions is unclear. It is possible, however, that breeding popu-
In our analyses, date was one of the most important                      lations sampled in different years originated from different
covariates in models of feather Hg concentration in Merlin.              regions of the United States and Canada, and experienced
Bourbour et al. (2019) found a significant relationship be-              different MeHg exposure. Alternatively, annual differences
tween feather Hg and ordinal day in Red-tailed Hawks.                    in Hg concentrations could be related to variation in prey
Previous studies have noted that HY Merlin migrate                       base among years.
earlier than AHY birds (Mueller et al. 2000). Therefore,
date was likely another index to age. This relationship is               Feather Mercury Comparisons in Raptors
also supported by our capture rates, with most HY birds                  On average, feather Hg concentrations determined in this
caught before October 1 and most AHY birds caught after                  study are similar to feather residues reported for other
September 20 (Figure 2). However, this relationship may                  terrestrial raptors and lower than feather Hg concentra-
be complicated by many factors including distance be-                    tions reported for piscivorous raptors (Table 9). Peregrine
tween breeding grounds and Duluth, Minnesota, latitude                   Falcons consume prey associated with both aquatic and
of breeding grounds, and potential relationships between                 terrestrial environments (White et al. 2002) and this may

FIGURE 3. Plot of δ 13C (left) and δ 15N (right) values against ln(Hg) concentrations (μg g−1 fw) for Merlin (top) and Sharp-shinned Hawk
(bottom) sampled at Hawk Ridge, Duluth, Minnesota, USA. Data are identified by age and sex cohort. Open triangle = hatch year male,
closed triangle = hatch year female, open circle = after hatch year male, and closed circle = after hatch year female.

                                                The Condor: Ornithological Applications 122:1–17, © 2020 American Ornithological Society
10                                                                                                                                         Mercury increases with δ15N in two raptor species                                E. R. Keyel, M. A. Etterson, G. J. Niemi, et al.

                                                                                                                                                                                                                       help explain their relatively high feather concentrations re-
TABLE 9. Reported feather Hg concentrations for raptors from previous studies. Osprey = Pandion haliaetus, Sparrowhawk = Accipiter nisus, Bald Eagle = Haliaeetus

                                                                                                                                                                                       primaries and/or axillaries
                                                                                                                                                                                       primaries and/or axillaries
                                                                                                                                                                                                                       ported in previous studies. However, the limited number

                                                                                                                                                                                       body or fallen primary
                                                                                                                                                                                                                       of Peregrine Falcons sampled in this study showed low
                                                                                                                                                                    Feather Type

                                                                                                                                                                                                                                                                                                Downloaded from https://academic.oup.com/condor/advance-article-abstract/doi/10.1093/condor/duz069/5741362 by AOS Member Access user on 26 February 2020
                                                                                                                                                                                                                       feather Hg concentrations, comparable to other terrestrial
                                                                                                                                                                                                                       raptors, although only HY birds were sampled. Accipiters,
                                                                                                                                                                                       secondaries

                                                                                                                                                                                       secondaries
                                                                                                                                                                                       rectrices                       such as Northern Goshawk (Accipiter gentilis) and Sharp-

                                                                                                                                                                                       rectrices
                                                                                                                                                                                                                       shinned Hawk, tend to prey on terrestrial-associated birds
                                                                                                                                                                                       breast

                                                                                                                                                                                       breast
                                                                                                                                                                                       breast

                                                                                                                                                                                       breast
                                                                                                                                                                                       breast
                                                                                                                                                                                       breast
                                                                                                                                                                                       breast
                                                                                                                                                                                       breast

                                                                                                                                                                                       breast
                                                                                                                                                                                       breast
                                                                                                                                                                                       body

                                                                                                                                                                                       body
                                                                                                                                                                                                                       (Squires and Reynolds 1997, Bildstein and Meyer 2000).
                                                                                                                                                                                                                       Our findings for accipiters and buteos were similar to pre-
                                                                                                                                                                                                                       vious results (Table 9).

                                                                                                                                                                                       Southern Nevada
                                                                                                                                                                                       Southern Nevada
                                                                                                                                                                    Article Location
                                                                                                                                                                                       South Florida
                                                                                                                                                                                       South Florida

                                                                                                                                                                                                                       Comparisons of Adverse Effect Concentrations
                                                                                                                                                                                       Great Lakes
                                                                                                                                                                                       Great Lakes

                                                                                                                                                                                                                       The potential for adverse effects of MeHg on avian wild-
                                                                                                                                                                                       California

                                                                                                                                                                                       California
                                                                                                                                                                                       California

                                                                                                                                                                                       California
                                                                                                                                                                                       California
                                                                                                                                                                                       California
                                                                                                                                                                                       California

                                                                                                                                                                                       California
                                                                                                                                                                                       California
                                                                                                                                                                                                                       life has been evaluated in 3 recent reviews (Ackerman et al.
                                                                                                                                                                                       Iran
                                                                                                                                                                                       Iran

                                                                                                                                                                                       Iran
                                                                                                                                                                                       Iran

                                                                                                                                                                                                                       2016, Whitney and Cristol 2017b, Evers 2018). Numerous
                                                                                                                                                                                                                       authors have correlated measured total Hg concentra-
                                                                                                                                                                                                                       tions in tissues of field-collected animals with observed
                                                                                                                                                                                       Barnes and Gerstenberger 2015
                                                                                                                                                                                       Barnes and Gerstenberger 2015

                                                                                                                                                                                                                       effects. This information has been used, in turn, to estab-
                                                                                                                                                                                                                       lish residue-based effect thresholds. Additional controlled
                                                                                                                                                                                                                       laboratory exposures have been conducted to estimate
                                                                                                                                                                                       Bowerman et al. 1994
                                                                                                                                                                                       Bowerman et al. 1994
                                                                                                                                                                                       Zolfaghari et al. 2007
                                                                                                                                                                                       Zolfaghari et al. 2007

                                                                                                                                                                                       Zolfaghari et al. 2007
                                                                                                                                                                                       Zolfaghari et al. 2007
                                                                                                                                                                                       Bourbour et al. 2019

                                                                                                                                                                                       Bourbour et al. 2019
                                                                                                                                                                                       Bourbour et al. 2019

                                                                                                                                                                                       Bourbour et al. 2019
                                                                                                                                                                                       Bourbour et al. 2019
                                                                                                                                                                                       Bourbour et al. 2019
                                                                                                                                                                                       Bourbour et al. 2019

                                                                                                                                                                                       Bourbour et al. 2019
                                                                                                                                                                                       Bourbour et al. 2019
                                                                                                                                                                                       Rumbold et al. 2017
                                                                                                                                                                                       Rumbold et al. 2017

                                                                                                                                                                                                                       effect thresholds expressed as an administered dose (e.g.,
                                                                                                                                                                    Article

                                                                                                                                                                                                                       in egg injection studies) or measured MeHg concentration
                                                                                                                                                                                                                       in the diet. Collectively, the reviewed studies document a
                                                                                                                                                                                                                       wide range of negative impacts including reduced repro-
                                                                                                                                                                                                                       ductive success, behavioral changes, neurological effects,
                                                                                                                                                                                                                       and various physiological and immune responses. Based
                                                                                                                                                                                                                       on these and similar efforts, MeHg is now known to ad-
                                                                                                                                                                                                                       versely affect the reproductive success of many bird popu-
                                                                                                                                                                                       95% CI 0.56–0.94 ug g−1

                                                                                                                                                                                       95% CI 3.47–5.23 ug g−1
                                                                                                                                                                                       95% CI 1.37–3.32 ug g−1

                                                                                                                                                                                       95% CI 0.75–3.14 ug g−1
                                                                                                                                                                                       95% CI 0.44–0.67 ug g−1
                                                                                                                                                                                       95% CI 0.30–0.83 ug g−1
                                                                                                                                                                                       95% CI 1.20–2.30 ug g−1

                                                                                                                                                                                       95% CI 1.76–6.11 ug g−1
                                                                                                                                                                                       95% CI 0.16–0.67 ug g−1
leucocephalus, Red-tailed Hawk = Buteo jamaicensis, Prairie Falcon = Falco mexicanus.

                                                                                                                                                                                                                       lations across multiple foraging guilds, habitat types, and
                                                                                                                                                                                                                       geographic areas.
                                                                                                                                                                                       −1

                                                                                                                                                                                       0.38–93.65 ug g−1

                                                                                                                                                                                       0.54–75.05 ug g−1

                                                                                                                                                                                       0.12–49.64 ug g−1
                                                                                                                                                                                       0.93–42.54 ug g−1
                                                                                                                                                                                       0.33–45.79 ug g

                                                                                                                                                                                                                          A complicating factor in determining the risk of MeHg
                                                                                                                                                                                       ± 0.0006 SD/SE
                                                                                                                                                                    Range

                                                                                                                                                                                       0.20–66 ug g−1
                                                                                                                                                                                       ± 0.08 SD/SE

                                                                                                                                                                                       ± 0.15 SD/SE
                                                                                                                                                                                       ± 1.26 SD/SE

                                                                                                                                                                                                                       to birds is that species may vary in their sensitivity to an ac-
                                                                                                                                                                                                                       cumulated residue or delivered dose, potentially based on
                                                                                                                                                                                                                       foraging guilds and phylogeny. For example, egg injection
                                                                                                                                                                                                                       studies indicate that adverse effects on embryo survival
                                                                                                                                                                                                                       and hatching success in songbirds and some raptors (e.g.,
                                                                                                                                                                                       15.84 ug g−1 dw

                                                                                                                                                                                                                       Osprey and American Kestrel) occur at lower dose levels
                                                                                                                                                                                       17.8 ug g−1 dw

                                                                                                                                                                                       1.03 ug g−1 dw
                                                                                                                                                                                       1.70 ug g−1 dw

                                                                                                                                                                                       1.00 ug g−1 dw
                                                                                                                                                                                       1.70 ug g−1 dw

                                                                                                                                                                                       3.76 ug g−1 fw
                                                                                                                                                                                       21 ug g−1 dw

                                                                                                                                                                                                                       than those that cause similar effects in waterbirds (Orders
                                                                                                                                                                    Average

                                                                                                                                                                                       12.19 ug g−1
                                                                                                                                                                                       −1

                                                                                                                                                                                       0.75 ug g−1

                                                                                                                                                                                       4.35 ug g−1
                                                                                                                                                                                       2.35 ug g−1

                                                                                                                                                                                       1.94 ug g−1
                                                                                                                                                                                       0.56 ug g−1
                                                                                                                                                                                       0.57 ug g−1
                                                                                                                                                                                       1.75 ug g−1

                                                                                                                                                                                       3.93 ug g−1
                                                                                                                                                                                       0.41 ug g−1
                                                                                                                                                                                       6.92 ug g

                                                                                                                                                                                                                       Gaviiformes, Anseriformes, and Pelecaniformes; Heinz
                                                                                                                                                                                                                       et al. 2009). The interpretation of such studies is com-
                                                                                                                                                                                                                       plicated, however, by the unnatural nature of this dosing
                                                                                                                                                                                                                       route. Perhaps the best studied of all birds with respect
                                                                                                                                                                                                                       to adverse effects of MeHg is the Common Loon. Effect
                                                                                                                                                                                       Unspecified
                                                                                                                                                                                       Unspecified

                                                                                                                                                                                       Unspecified
                                                                                                                                                                                       Unspecified
                                                                                                                                                                                       Unspecified

                                                                                                                                                                                       Unspecified

                                                                                                                                                                                       Unspecified

                                                                                                                                                                                       Unspecified
                                                                                                                                                                                       Unspecified

                                                                                                                                                                                                                       thresholds, expressed as MeHg concentrations in fish, have
                                                                                                                                                                                       Nestling

                                                                                                                                                                                       Nestling
                                                                                                                                                                                       Juvenile

                                                                                                                                                                                       Juvenile
                                                                                                                                                                    Age

                                                                                                                                                                                                                       been established based on in situ observations (Evers et al.
                                                                                                                                                                                       Adult

                                                                                                                                                                                       Adult

                                                                                                                                                                                       Adult
                                                                                                                                                                                       Adult

                                                                                                                                                                                       Adult

                                                                                                                                                                                       Adult

                                                                                                                                                                                                                       2003, 2008; Burgess and Meyer 2008, Depew et al. 2012)
                                                                                                                                                                                                                       and laboratory feeding studies (Kenow et al. 2003, 2010,
                                                                                                                                                                                                                       2011). The lowest proposed effect threshold (0.1 μg g−1 fw)
                                                                                                                                                                                       Red-shouldered Hawk
                                                                                                                                                                                       Sharp–shinned Hawk

                                                                                                                                                                                       Northern Goshawk
                                                                                                                                                                                       Northern Goshawk

                                                                                                                                                                                                                       for dietary Hg was developed in adult Common Loons
                                                                                                                                                                                       American Kestrel

                                                                                                                                                                                       Peregrine Falcon
                                                                                                                                                                                       Peregrine Falcon
                                                                                                                                                                                       Peregrine Falcon
                                                                                                                                                                                       Northern Harrier

                                                                                                                                                                                       Red-tailed Hawk

                                                                                                                                                                                                                       (Depew et al. 2012). Somewhat higher thresholds were
                                                                                                                                                                                       Cooper’s Hawk
                                                                                                                                                                                       Sparrowhawk
                                                                                                                                                                                       Sparrowhawk

                                                                                                                                                                                       Prairie Falcon

                                                                                                                                                                                                                       given for significant reproductive impairment (0.18 μg g−1
                                                                                                                                                                                       Bald Eagle
                                                                                                                                                                                       Bald Eagle

                                                                                                                                                                                                                       fw) and reproductive failure in wild adult loons (0.4 μg g−1
                                                                                                                                                                    Species
                                                                                                                                                                                       Osprey
                                                                                                                                                                                       Osprey

                                                                                                                                                                                       Merlin

                                                                                                                                                                                                                       fw). By comparison to the Common Loon, MeHg effects
                                                                                                                                                                                                                       data for raptors are much more limited. Female American

                The Condor: Ornithological Applications 122:1–17, © 2020 American Ornithological Society
E. R. Keyel, M. A. Etterson, G. J. Niemi, et al.                                  Mercury increases with δ15N in two raptor species   11

                                                                                                                                            Downloaded from https://academic.oup.com/condor/advance-article-abstract/doi/10.1093/condor/duz069/5741362 by AOS Member Access user on 26 February 2020
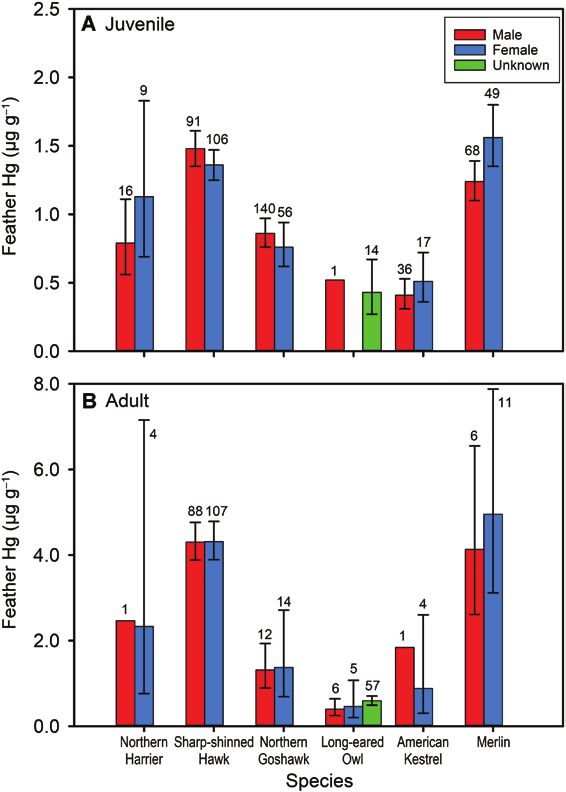
FIGURE 4. Histogram of estimated total blood Hg concentrations by risk category for all individuals (n = 966) sampled at Hawk Ridge,
Duluth, Minnesota, USA (2009–2012). Risk categories are from Ackerman et al. (2016). Blood Hg concentrations were predicted using
an empirical model that relates Hg concentrations in feathers to those in blood (Eagles-Smith et al. 2008).

Kestrels were exposed for approximately 16 weeks to MeHg                 North America varied substantially within and among spe-
in the diet and followed to evaluate effects on reproduction             cies. In general, Hg concentrations in AHY birds were
(Albers et al. 2007). The number of fledglings and the per-              higher than those in HY birds and appeared to vary by diet
cent of nestlings fledged was reduced markedly at 0.3 μg g−1             strategy, with bird-specialist species having higher concen-
fw, while egg production, incubation performance, and the                trations than mammal-specialist species. Because Hg was
percent of eggs hatched declined between 1.2 and 1.7 μg g−1              correlated with ordinal day for Merlin, sampling over the
fw. Based on this information, it appears that effect thresh-            entire period of migration may be required to accurately
olds for MeHg in the American Kestrel and Common                         assess MeHg exposure in this and other raptors. An evalu-
Loon do not differ substantially. Presently, however, effect             ation of δ 13C and δ 15N values in Merlin and Sharp-shinned
thresholds for other raptors are largely unknown.                        Hawk suggested that both species feed primarily from
   In an attempt to estimate MeHg risk to raptors migrating              a terrestrially associated food web and that the trophic
through the Central flyway, we used an empirically based                 level of individual birds is a major determinant of MeHg
model given by Eagles-Smith et al. (2008) to estimate Hg                 exposure. Measured concentrations of Hg in some AHY
concentrations in blood from those measured in feathers:                 Merlin and Sharp-shinned Hawk suggest a moderate risk
ln(blood Hg) = 0.749 × ln(breast feather Hg) − 1.855. This               of adverse effects from MeHg exposure. It is currently un-
model was developed using data for pre-breeding water-                   known whether Hg residues in North American raptors are
birds. Its application to raptors assumes that the processes             increasing, decreasing, or stable, and ongoing monitoring
responsible for sequestration of MeHg in developing                      is essential to detect changes in these levels over time.
feathers are the same in all birds. Predicted blood Hg
concentrations were then compared with adverse effect                    ACKNOWLEDGMENTS
thresholds recently proposed by Ackerman et al. (2016).
These comparisons suggested that most of the individ-                    We would like to thank Hawk Ridge Bird Observatory, es-
uals sampled in our study were at negligible or low risk to              pecially D. Evans, and D. Alexander for collecting many of
MeHg (Figure 4). However, a small number of AHY Merlin                   our feather samples. We would also like to thank R. Gray,
and Sharp-shinned Hawk exhibited predicted blood Hg                      Biodiversity Research Institute, for careful managing of sam-
                                                                         ples and data. B. Taylor provided advice for feather sample
concentrations associated with a moderate level of risk.
                                                                         preparation and analysis. We also thank K. Regan and
                                                                         C. Persico of the Biodiversity Research Institute for analyzing
CONCLUSION                                                               feather samples for mercury concentrations. We would like
                                                                         to thank A. Cotter at the Mid-Continent Ecology Division
For most of the sampled birds the predicted risk was low or              of the U.S. Environmental Protection Agency for analyzing
negligible. Total Hg concentrations in breast feathers from              our feather samples for nitrogen and carbon stable isotopes.
raptors sampled during their fall migration through central              R. LePage created the figures for this manuscript. A. Jackson

                                                The Condor: Ornithological Applications 122:1–17, © 2020 American Ornithological Society
12   Mercury increases with δ15N in two raptor species                                            E. R. Keyel, M. A. Etterson, G. J. Niemi, et al.

provided helpful comments on an earlier version of this man-             Bearhop, S., G. D. Ruxton, and R. W. Furness (2000). Dynamics of
uscript. E.R.K. would like to thank A. Keyel, M. Joyce, and J.               mercury in blood and feathers of Great Skuas. Environmental
Bednar for technical support and comments.                                   Toxicology and Chemistry 19:1638–1643.

                                                                                                                                                      Downloaded from https://academic.oup.com/condor/advance-article-abstract/doi/10.1093/condor/duz069/5741362 by AOS Member Access user on 26 February 2020
Funding statement: Funding for this research was pro-                    Bearhop, S., S. Waldron, S. C. Votier, and R. W. Furness (2002).
vided by Hawk Ridge Bird Observatory and the Biodiversity                    Factors that influence assimilation rates and fractionation
Research Institute.                                                          of nitrogen and carbon stable isotopes in avian blood
Ethics statement: All birds were trapped and banded using                    and feathers. Physiological and Biochemical Zoology
standard protocols, as approved under the USFWS HRBO                         75:451–458.
station permit. The views expressed in this paper are those of           Becker, P. H. (1992). Egg mercury levels decline with the laying
                                                                             sequence in Charadriiformes. Bulletin of Environmental
the authors and do not necessarily reflect the views or policies
                                                                             Contamination and Toxicology 48:762–767.
of the U.S. Environmental Protection Agency.
                                                                         Bildstein, K. L., and K. D. Meyer (2000). Sharp-shinned Hawk
Author contributions: E.R.K., M.A.E., G.J.N., D.C.E., C.R.D.,
                                                                             (Accipiter striatus), version 2.0. In The Birds of North America
J.W.N., and J.C.H. conceived the idea, design, experiment                    (A. F. Poole and F. B. Gill, Editors). Cornell Lab of Ornithology,
(supervised research, formulated question or hypothesis).                    Ithaca, NY, USA. https://doi.org/10.2173/bna.482
E.R.K., F.N., D.C.E., C.R.D., J.W.N., and J.C.H. performed the           Bourbour, R. P., B. L. Martinico, J. T. Ackerman, M. P. Herzog,
experiments (collected data, conducted the research). E.R.K.,                A. C. Hull, A. M. Fish, and J. M. Hull (2019). Feather mercury con-
M.A.E., G.J.N., C.R.D., J.W.N., and J.C.H. wrote the paper.                  centrations in North American raptors sampled at migration
M.A.E., D.C.E., C.R.D., and J.C.H. developed or designed                     monitoring stations. Ecotoxicology 13:1–13.
methods. E.R.K., M.A.E., J.C.H., and Y.L. analyzed the data.             Bowerman, W. W., E. D. Evans, J. P. Giesy, and S. Postupalsky
Data depository: Analyses reported in this article can be re-                (1994). Using feathers to assess risk of mercury and sel-
produced using the data provided by Keyel et al. (2020).                     enium to Bald Eagle reproduction in the Great Lakes
                                                                             region. Archives of Environmental Contamination and
                                                                             Toxicology 27:294–298.
LITERATURE CITED                                                         Bowerman, W. W., J. P. Giesy, D. A. Best, and V. J. Kramer (1995). A
                                                                             review of factors affecting productivity of Bald Eagles in the
Ackerman, J. T., C. A. Eagles-Smith, and M. P. Herzog (2011).                Great Lakes region: Implications for recovery. Environmental
   Bird mercury concentrations change rapidly as chicks                      Health Perspectives 103(Suppl 4):51–59.
   age: Toxicological risk is highest at hatching and fledging.          Bowerman, W. W., A. S. Roe, M. J. Gilberston, D. A. Best, J. G. Sikarskie,
   Environmental Science & Technology 45:5418–5425.                          R. S. Mitchel, and C. L. Summer (2002). Using Bald Eagles to
Ackerman, J. T., C. A. Eagles-Smith, M. P. Herzog,                           indicate the health of the Great Lakes’ environment. Lakes &
   C. A. Hartman, S. H. Peterson, D. C. Evers, A. K. Jackson,                Reservoirs: Research and Management 7:183–187.
   J. E. Elliott, S. S. Vander Pol, and C. E. Bryan (2016).              Braune, B. M., and D. E. Gaskin (1987). Mercury levels in Bonaparte’s
   Avian mercury exposure and toxicological risk across                      Gulls (Larus philadelphia) during autumn molt in the Quoddy
   western North America: A synthesis. The Science of the                    region, New Brunswick, Canada. Archives of Environmental
   Total Environment 568:749–769.                                            Contamination and Toxicology 16:539–549.
Ackerman, J. T., C. A. Eagles-Smith, J. Y. Takekawa, S. A. Demers,       Burger, J. (1993) Metals in avian feathers: Bioindicators of envir-
   T. L. Adelsbach, J. D. Bluso, A. Keith Miles, N. Warnock,                 onmental pollution. Reviews in Environmental Toxicology
   T. H. Suchanek, and S. E. Schwarzbach (2007). Mercury concen-             5:203–311.
   trations and space use of pre-breeding American Avocets and           Burgess, N. M., and K. A. Hobson (2006). Bioaccumulation of mer-
   Black-necked Stilts in San Francisco Bay. The Science of the              cury in yellow perch (Perca flavescens) and Common Loons
   Total Environment 384:452–466.                                            (Gavia immer) in relation to lake chemistry in Atlantic Canada.
Albers, P. H., M. T. Koterba, R. Rossmann, W. A. Link, J. B. French,         Hydrobiologia 567:275–282.
   R. S. Bennett, and W. C. Bauer (2007). Effects of methylmercury       Burgess, N. M., and M. W. Meyer (2008). Methylmercury exposure
   on reproduction in American Kestrels. Environmental                       associated with reduced productivity in Common Loons.
   Toxicology and Chemistry 26:1856–1866.                                    Ecotoxicology 17:83–91.
Anderson, D. W., T. H. Suchanek, C. A. Eagles-Smith, and T. M. Cahill,   Burnham, K. P., and D. R. Anderson (2002). Model Selection and
   Jr. (2008). Mercury residues and productivity in Osprey                   Multimodel Inference: A Practical Information-Theoretic
   and grebes from a mine-dominated ecosystem. Ecological                    Approach. Springer Verlag, New York, NY, USA.
   Applications 18:A227–A238.                                            Carravieri, A., P. Bustamante, C. Churlaud, A. Fromant, and
Atwell, L., K. A. Hobson, and H. E. Welch (1998). Biomagnification           Y. Cherel (2014). Moulting patterns drive within-individual
   and bioaccumulation of mercury in an Arctic marine food                   variations of stable isotopes and mercury in seabird body
   web: Insights from stable nitrogen isotope analysis. Canadian             feathers: Implications for monitoring of the marine environ-
   Journal of Fisheries and Aquatic Sciences 55:1114–1121.                   ment. Marine Biology 161:963–968.
Barnes, J. G., and S. L. Gerstenberger (2015). Using feathers to de-     Caut, S., E. Angulo, and F. Courchamp (2009). Variation in dis-
   termine mercury contamination in Peregrine Falcons and their              crimination factors (Δ 15N and Δ 13C): The effect of diet isotopic
   prey. Journal of Raptor Research 49:43–58.                                values and applications for diet reconstruction. Journal of
Barnes, J. G., G. E. Doney, M. A. Yates, W. S. Seegar, and                   Applied Ecology 46:443–453.
   S. L. Gesternberger (2019). A broadscale assessment of mer-           Compeau, G. C., and R. Bartha (1985). Sulfate-reducing bacteria:
   cury contamination in Peregrine Falcons across the north lati-            Principal methylators of mercury in anoxic estuarine sediment.
   tudes of North America. Journal of Raptor Research 53:1–13.               Applied and Environmental Microbiology 50:498–502.

The Condor: Ornithological Applications 122:1–17, © 2020 American Ornithological Society
E. R. Keyel, M. A. Etterson, G. J. Niemi, et al.                                     Mercury increases with δ15N in two raptor species         13

Condon, A. M., and D. A. Cristol (2009). Feather growth influ-             Evers, D. C., J. D. Kaplan, M. W. Meyer, P. S. Reaman, A. Major,
   ences blood mercury level of young songbirds. Environmental                 N. Burgess, and W. E. Braselton (1998b). Bioavailability of envir-
   Toxicology and Chemistry 28:395–401.                                        onmental mercury measured in Common Loon feathers and

                                                                                                                                                      Downloaded from https://academic.oup.com/condor/advance-article-abstract/doi/10.1093/condor/duz069/5741362 by AOS Member Access user on 26 February 2020
Cristol, D. A., R. L. Brasso, A. M. Condon, R. E. Fovargue,                    blood across North America. Environmental Toxicology and
   S. L. Friedman, K. K. Hallinger, A. P. Monroe, and A. E. White              Chemistry 17:173–183.
   (2008). The movement of aquatic mercury through terrestrial             Evers, D. C., L. J. Savoy, C. R. DeSorbo, D. E. Yates, W. Hanson,
   food webs. Science 320:335.                                                 K. M. Taylor, L. S. Siegel, J. H. Cooley, Jr., M. S. Bank, A. Major,
Cristol, D. A., E. K. Mojica, C. W. Varian-Ramos, and B. D. Watts              et al. (2008). Adverse effects from environmental mercury
   (2012). Molted feathers indicate low mercury in Bald Eagles of              loads on breeding Common Loons. Ecotoxicology 17:69–81.
   the Chesapeake Bay, USA. Ecological Indicators 18:20–24.                Evers, D. C., K. M. Taylor, A. Major, R. J. Taylor, R. H. Poppenga, and
Depew, D. C., N. Basu, N. M. Burgess, L. M. Campbell, D. C. Evers,             A. M. Scheuhammer (2003). Common Loon eggs as indicators
   K. A. Grasman, and A. M. Scheuhammer (2012). Derivation of                  of methylmercury availability in North America. Ecotoxicology
   screening benchmarks for dietary methylmercury exposure                     12:69–81.
   for the Common Loon (Gavia immer): Rationale for use in                 Evers, D. C., J. G. Wiener, N. Basu, R. A. Bodaly, H. A. Morrison,
   ecological risk assessment. Environmental Toxicology and                    and K. A. Williams (2011). Mercury in the Great Lakes region:
   Chemistry 31:2399–2407.                                                     Bioaccumulation, spatiotemporal patterns, ecological risks,
DeSorbo, C. R., N. M. Burgess, C. S. Todd, D. C. Evers, R. A. Bodaly,          and policy. Ecotoxicology 20:1487–1499.
   B. H. Massey, S. E. Mierzykowski, C. P. Persico, R. B. Gray,            Falk, K., S. Møller, and W. G. Mattox (2006). A long-term increase
   W. E. Hanson, D. E. Meattey, and K. J. Regan (2018). Mercury                in eggshell thickness of Greenlandic Peregrine Falcons Falco
   concentrations in Bald Eagles across an impacted water-                     peregrinus tundrius. The Science of the Total Environment
   shed in Maine, USA. The Science of the Total Environment                    355:127–134.
   627:1515–1527.                                                          Fallacara, D. M., R. S. Halbrook, and J. B. French (2011). Toxic effects
Driscoll, C. T., Y. J. Han, C. Y. Chen, D. C. Evers, K. F. Lambert,            of dietary methylmercury on immune system development in
   T. M. Holsen, N. C. Kamman, and R. K. Munson (2007). Mercury                nestling American Kestrels (Falco sparverius). Environmental
   contamination in forest and freshwater ecosystems in the                    Toxicology and Chemistry 30:1328–1337.
   northeastern United States. BioScience 57:17–28.                        Farmer, C. J., D. J. Hussell, and D. Mizrahi (2007). Detecting popula-
Driscoll, C. T., R. P. Mason, H. M. Chan, D. J. Jacob, and N. Pirrone          tion trends in migratory birds of prey. The Auk 124:1047–1062.
   (2013). Mercury as a global pollutant: Sources, path-                   Fournier, F., W. H. Karasov, K. P. Kenow, M. W. Meyer, and
   ways, and effects. Environmental Science & Technology                       R. K. Hines (2002). The oral bioavailability and toxicokinetics
   47:4967–4983.                                                               of methylmercury in Common Loon (Gavia immer) chicks.
Eagles-Smith, C. A., J. T. Ackerman, T. L. Adelsbach, J. Y. Takekawa,          Comparative Biochemistry and Physiology. Part A, Molecular
   A. K. Miles, and R. A. Keister (2008). Mercury correlations                 & Integrative Physiology 133:703–714.
   among six tissues for four waterbird species breeding in San            French, J. B., Jr., R. S. Bennett, and R. Rossmann (2010). Mercury in
   Francisco Bay, California, USA. Environmental Toxicology and                the blood and eggs of American Kestrels fed methylmercury
   Chemistry 27:2136–2153.                                                     chloride. Environmental Toxicology and Chemistry
Edmonds, S. T., D. C. Evers, D. A. Cristol, C. Mettke-Hoffmann,                29:2206–2210.
   L. L. Powell, A. J. McGann, J. W. Armiger, O. P. Lane, D. F. Tessler,   Furness, R. W., J. J. Muirhead, and M. Woodburn (1986). Using
   P. Newell, K. Heyden, and M. J. O’Driscoll (2010). Geographic               bird feathers to measure mercury in the environment:
   and seasonal variation in mercury exposure of the declining                 Relationships between mercury content and moult. Marine
   Rusty Blackbird. The Condor 112:789–799.                                    Pollution Bulletin 17:27–30.
Evans, D. L., G. J. Niemi, and M. A. Etterson (2012). Autumn raptor        Gann, G. L., C. H. Powell, M. M. Chumchal, and R. W. Drenner
   banding at Hawk Ridge, Duluth, Minnesota, USA, 1972–2009:                   (2015). Hg-contaminated terrestrial spiders pose a poten-
   An overview. Journal of Raptor Research 46:36–49.                           tial risk to songbirds at Caddo Lake (Texas/Louisiana, USA).
Evers D. (2018). The effects of methylmercury on wildlife: A com-              Environmental Toxicology and Chemistry 34:303–306.
   prehensive review and approach for interpretation. In The               Green, R. E., I. Newton, S. Shultz, A. A. Cunningham, M. Gilbert,
   Encyclopedia of the Anthropocene, vol. 5 (D. A. DellaSala and               D. J. Pain, and V. Prakash (2004). Diclofenac poisoning as a
   M. I. Goldstein, Editors). Elsevier, Oxford, UK. pp. 181–194.               cause of vulture population declines across the Indian subcon-
Evers, D. C., N. M. Burgess, L. Champoux, B. Hoskins, A. Major,                tinent. Journal of Animal Ecology 41:793–800.
   W. M. Goodale, R. J. Taylor, R. Poppenga, and T. Daigle (2005).         Grier, J. W. (1982). Ban of DDT and subsequent recovery of repro-
   Patterns and interpretation of mercury exposure in fresh-                   duction in Bald Eagles. Science 218:1232–1235.
   water avian communities in northeastern North America.                  Gurney, K. E. B., R. G. Clark, S. M. Slattery, and L. C. M. Ross (2017).
   Ecotoxicology 14:193–221.                                                   Connecting the trophic dots: Responses of an aquatic bird
Evers, D. C., Y. Han, C. T. Driscoll, N. C. Kamman, M. W. Goodale,             species to variable abundance of macroinvertebrates in nor-
   K. F. Lambert, T. M. Holsen, C. Y. Chen, T. A. Clair, and T. Butler         thern boreal wetlands. Hydrobiologia 735:1–17.
   (2007). Biological mercury hotspots in northeastern United              Haney, A., and R. L. Lipsey (1973). Accumulation and effects of
   States and southeastern Canada. BioScience 57:29–43.                        methyl mercury hydroxide in a terrestrial food chain under la-
Evers, D. C., J. D. Kaplan, M. W. Meyer, P. S. Reaman, W. E. Braselton,        boratory conditions. Environmental Pollution 5:305–316.
   A. Major, N. Burgess, and A. M. Schuehammer (1998a).                    Hebert, C. E., D. V. C. Weseloh, A. Idrissi, M. T. Arts, and E. Roseman
   Geographic trend in mercury measured in Common Loon                         (2009). Diets of aquatic birds reflect changes in the Lake Huron
   feathers and blood. Environmental Toxicology and Chemistry                  ecosystem. Aquatic Ecosystem Health and Management
   17:173–183.                                                                 12:37–44.

                                                The Condor: Ornithological Applications 122:1–17, © 2020 American Ornithological Society
You can also read