Modeling the Future Tree Distribution in a South African Savanna Ecosystem: An Agent-Based Model Approach
←
→
Page content transcription
If your browser does not render page correctly, please read the page content below
land
Article
Modeling the Future Tree Distribution in a South African
Savanna Ecosystem: An Agent-Based Model Approach
Ulfia A. Lenfers * , Nima Ahmady-Moghaddam                            , Daniel Glake       , Florian Ocker, Julius Weyl
and Thomas Clemen
                                          Department of Computer Science, Hamburg University of Applied Sciences, Berliner Tor 7,
                                          20099 Hamburg, Germany; nima.ahmady-moghaddam@haw-hamburg.de (N.A.-M.);
                                          daniel.glake@haw-hamburg.de (D.G.); florian.ocker@haw-hamburg.de (F.O.);
                                          julius.weyl@haw-hamburg.de (J.W.); thomas.clemen@haw-hamburg.de (T.C.)
                                          * Correspondence: ulfia.lenfers@haw-hamburg.de

                                          Abstract: Understanding the dynamics of tree species and their demography is necessary for predict-
                                          ing future developments in savanna ecosystems. In this contribution, elephant-tree and firewood
                                          collector-tree interactions are compared using a multiagent model. To investigate these dynamics, we
                                          compared three different tree species in two plots. The first plot is located in the protected space of
                                          Kruger National Park (KNP), South Africa, and the second plot in the rural areas of the Bushbuckridge
                                          Municipality, South Africa. The agent-based modeling approach enabled the modeling of individual
                                          trees with characteristics such as species, age class, size, damage class, and life history. A similar level
                                          of detail was applied to agents that represent elephants and firewood collectors. Particular attention
                                          was paid to modeling purposeful behavior of humans in contrast to more instinct-driven actions
                                          of elephants. The authors were able to predict future developments by simulating the time period

                                   between 2010 and 2050 with more than 500,000 individual trees. Modeling individual trees for a time
Citation: Lenfers, U.A.; Ahmady-
                                          span of 40 years might yield more detailed information than a simple woody mass aggregation. The
Moghaddam, N.; Glake, D.; Ocker, F.;      results indicate a significant trend toward more and thinner trees together with a notable reduction
Weyl, J.; Clemen, T. Modeling the         in mature trees, while the total aboveground biomass appears to stay more or less constant. Further-
Future Tree Distribution in a South       more, the KNP scenarios show an increase in young Combretum apiculatum, which may correspond to
African Savanna Ecosystem: An             bush encroachment.
Agent-Based Model Approach. Land
2022, 11, 619. https://doi.org/           Keywords: savanna trees; bush encroachment; firewood collection; big-tree loss; species shift; ele-
10.3390/land11050619                      phant; agent-based modeling; MARS
Academic Editors: Michael Nones,
Elias Symeonakis, Mulatie Mekonnen
and Dereje Adeba
                                          1. Introduction
Received: 12 April 2022
Accepted: 21 April 2022
                                               Trees are keystone species in savanna landscapes (as illustrated in Figure 1) and are
Published: 22 April 2022
                                          highly adaptable to impacts from their surroundings [1–5]. Such impacts can include
                                          changes in soil conditions, temperature, and precipitation, as well as disturbances such
Publisher’s Note: MDPI stays neutral
                                          as utilization and fire. Therefore, savanna tree species can withstand droughts and fire
with regard to jurisdictional claims in
                                          and have developed different strategies to avoid over-utilization by, e.g., browsing ani-
published maps and institutional affil-
                                          mals [6–10]. Savanna trees are also characterized by different life states, which sometimes
iations.
                                          have contradictory needs.
                                               To obtain a representative and comprehensive model, three tree species with differ-
                                          ent survival strategies [9] were included: Acacia nigrescens, Combretum apiculatum, and
Copyright: © 2022 by the authors.
                                          Sclerocarya birrea (Marula).
Licensee MDPI, Basel, Switzerland.             Acacia nigrescens (A.n.) is a tall, deciduous tree that stands without leaves for several
This article is an open access article    months. Its height commonly ranges between 8 and 10 m, but can be up to 20 m. The
distributed under the terms and           juvenile and adult tree is resistant to fire and drought, and is favored by many browser
conditions of the Creative Commons        species. This has a high impact on the survival rate from seedling to adult trees [11].
Attribution (CC BY) license (https://          Combretum apiculatum (C.a.) is a small to medium-sized tree with a height between
creativecommons.org/licenses/by/          3 and 10 m. This tree occurs in dry, open woodlands and the Bushveld. The hard wood is
4.0/).                                    resistant to borers and termites [11].

Land 2022, 11, 619. https://doi.org/10.3390/land11050619                                                        https://www.mdpi.com/journal/land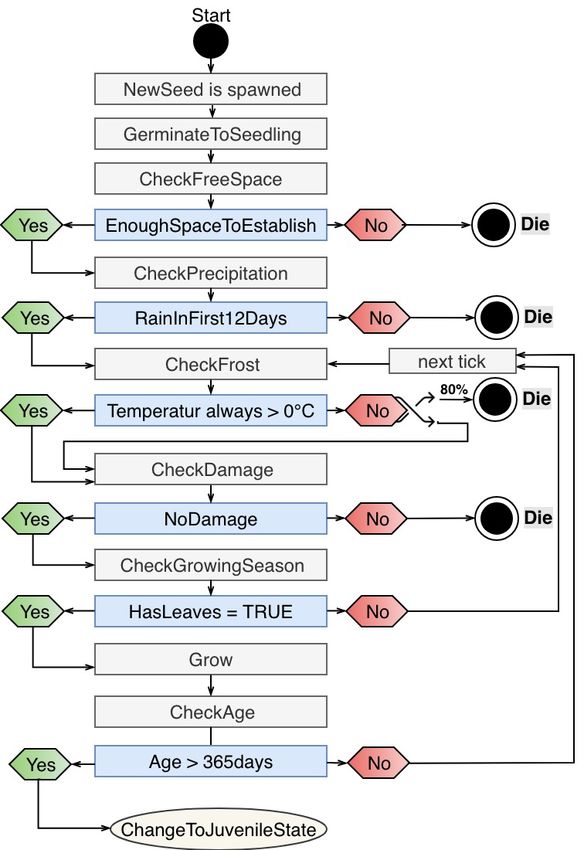
Land 2022, 11, 619                                                                                                  2 of 24

                     Figure 1. Illustration of trees as keystone species in savannas, offering a set of benefits and being
                     impacted by a set of drivers. The actors within the dashed square are modeled as agent types in the
                     agent-based model.

                          Sclerocarya birrea (S.b.) is a 7−17 m medium-height, deciduous tree which is leafless
                     for several months of the year. Nevertheless, these trees are an essential forage source for
                     many animals. Its fruits, leaves, kernels, but also bark and roots, are attractive to several
                     animals. The habitat ranges from medium- to low-altitude open woodland and bush [11].
                          Additionally, the model includes an average tree, called Tree tree (T.t.), to obtain an
                     appropriate population density of trees throughout the spatial extent of the model (see
                     Section 3.1.1).
                          Two study sites in the most extreme land-use forms of the savanna were chosen: a
                     plot in the rural area of the Bushbuckridge Municipality (BBR) and a plot in the Kruger
                     National Park (KNP) near Skukuza (SKU), as a near-natural example in a protected area. In
                     Figure 2, the geographic locations of the study sites are shown. Both sites are part of the
                     EMSAfrica (FKZ 01LL1801C) study site system and have a rich database [12–20]. After the
                     selection of sites, the main agent types in addition to the four previously described tree
                     species were identified: firewood collector and elephant (Loxodonta africana).
                          Many existing models aim to predict fuel wood demand [21–26] or to calculate the
                     aboveground biomass (AGB) of trees in savannas [25,27–32]. However, a valid represen-
                     tation of adaptable human behavior has been absent in models of nonlinear systems [33].
                     To begin to fill this gap, goal-oriented action planning (GOAP) [14] was employed. Here,
                     wood collection was modeled on the household scale with preferences in the quality of
                     firewood, which results from the tree species and the collected parts of wood.
                          Disturbances against trees by elephants are mainly driven by the location of the
                     elephants and the time of day, rather than by the number of elephants [34]. In order
                     to simulate elephant behavior realistically, the model is coupled with an existing KNP
                     elephant model designed and developed by the MARS Group [35].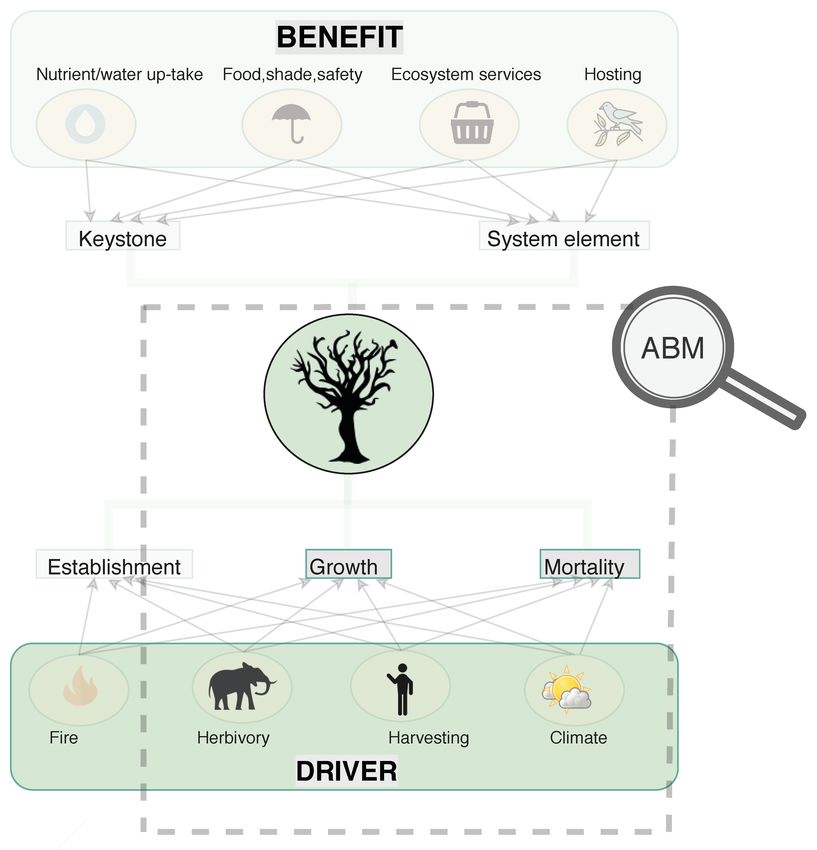
Land 2022, 11, 619 3 of 24
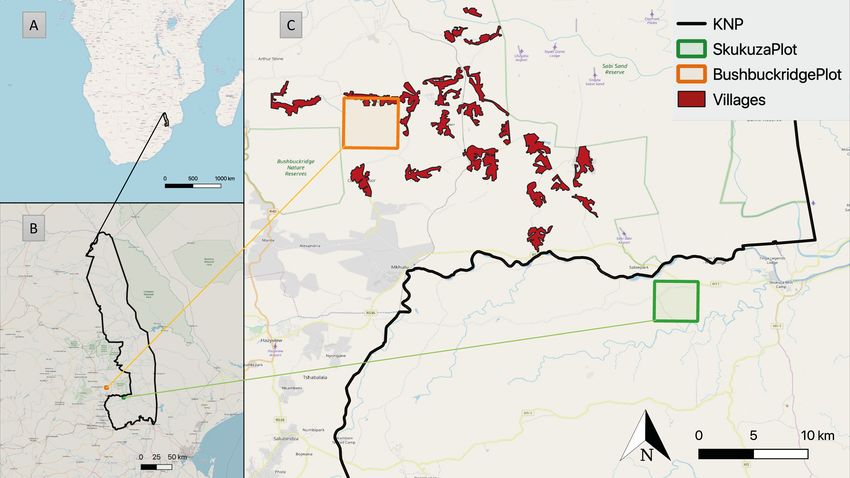
Figure 2. Study site: Overview of Southern Africa showing (A) the location of the KNP, (B) the
location of both study sites with respect to the KNP, and (C) the location of both study sites with
respect to the adjacent KNP border and neighboring villages.
Additionally, fire is a disturber against trees in savanna landscapes. It can reduce
woody cover [36] mainly by killing young trees and by setting back the height growth with
a start of resprouting until the fire escape height is reached [37]. However, the frequency
and intensity of fires is a function of fuel accumulation. Therefore, frequent burning is not
always possible [36,38]. This is also the case in a plot of intensive firewood collection, such
as the site near Bushbuckridge. The plot inside the KNP, on the other hand, has a low fire
return frequency [39]. To avoid affecting the comparability of the study sites by special
events such as fires, fire as a potential disturber is not included in the model. Generally, fire
is an important aspect of the study of savanna ecosystems. However, fire is a relatively rare
and low-impact source of disturbance in the two chosen study sites. While this does not
make fire disturbances negligible, we argue that it allows for its exclusion in a model that
aims to study the impact of utilization by animals and humans.
The impact of future climate is uncertain. In order to standardize these uncertainties,
scenarios for model comparison purposes must be defined. New data sets were created
and presented in the Intergovernmental Panel on Climate Change (IPCC) Fifth Assessment
Report (AR5) with Representative Concentration Pathways (RCP) scenarios. The RCP name
different scenarios with space- and time-dependent trajectories of human-made concen-
trations of greenhouse gases and pollution. In the model, two extreme RCP scenarios [40]
are considered.
The research question of this contribution is whether a large-scale agent-based model
(ABM) that is informed by spatio-temporal data from the pertinent geographic region is
suitable for modeling and predicting future tree distributions. We argue that this approach
complements previous efforts, which relied mainly on aggregations of AGB and/or up-
scaling from an average value per ha. Using an ABM, we were able to model the life cycles
of each single tree belonging to one of the three different tree species. This provides a
greater level of detail and a potentially richer model output for further analysis. As such,
the research objective is to develop a workflow that comprises a data-driven selection
of agent types for the model, a literature-driven modeling behavior of each agent type,
the specification of a range of scenarios to compare different tree distribution outcomes,
the implementation of the designed model, and first analyses of model outputs. For
more details, see the ODD Protocol (overview, design concepts, and details) [41,42] in
Appendix A.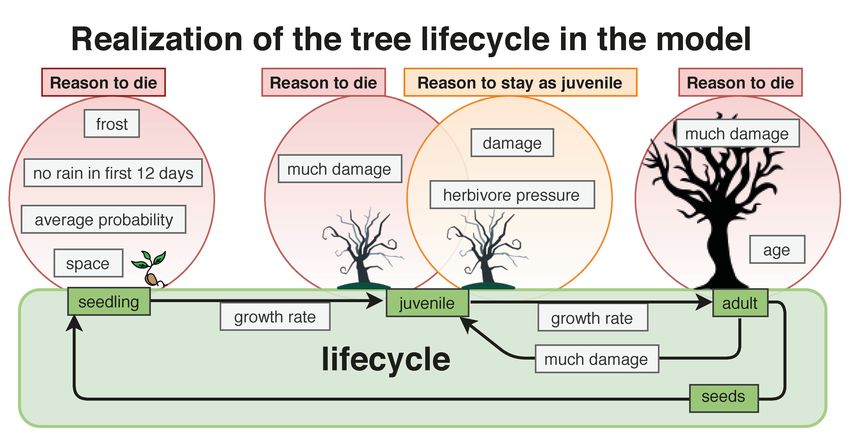
Land 2022, 11, 619                                                                                            4 of 24

                     2. Study Area
                          To model distributions of specific savanna tree species, the research areas (see Figure 2)
                     were placed in the Lowveld, one of the savanna biomes in South Africa with the vegetation
                     type Granite Lowveld. Being in the Lowveld, both study sites are located within an altitude
                     range of 150−600 m above sea level. The vegetation characteristics of this region typically
                     consist of a few trees in tall shrubland up to dense thicket or open savanna [43].
                          The majority of annual rainfall occurs in the summer between October and May, with
                     a mean annual precipitation of 570 mm in Skukuza and 640 mm in Bushbuckridge. The
                     rainfall is driven mainly by thunderstorms with a high inter-annual variability, causing
                     droughts to occur regularly. The temperature profile is characterized by hot summers and
                     mild and dry winters [44]. Within this savanna biome, there are three main different land
                     tenure systems: the state-owned communal areas (see Figure 2, BushbuckridgePlot), the
                     state-owned conservation area KNP (see Figure 2, SkukuzaPlot), and a buffer zone that
                     belongs to a system of privately owned conservation areas.

                     2.1. BushbuckridgePlot/BBR Model
                          One of the two main study sites of the EMSAfrica project [45] is located in the Bush-
                     buckridge Municipality, south of Agincourt (−24.82°, 31.21°). Throughout the paper, we
                     refer to this site (represented by the orange square in Figure 2) as BushbuckridgePlot. The
                     model that we implemented of this site is referred to as the BBR Model. The social structure
                     is characterized by low-income households and the regular use of natural resources from
                     communal lands [25,46,47]. 40% of the area is used for houses, streets, or agriculture land,
                     while the remaining 60% is used for firewood collection. Additionally, there is little woody
                     structure left on the first 1500 m south of Agincourt due to ongoing heavy firewood collec-
                     tion [48]. This was taken into account while calculating the space required for firewood
                     collection.

                     2.2. SkukuzaPlot/SKU Model
                           The second study site of the EMSAfrica project is located 13 km southwest of Skukuza
                     (−25.02°, 31.50°) [45]. We refer to this site (represented by the green square in Figure 2)
                     as SkukuzaPlot and to its model as the SKU Model. Since 2000, there has been an eddy
                     covariance flux tower to measure mainly CO2 fluxes [18]. Here, a nearly undisturbed
                     savanna still exists. Additionally, data collection has been ongoing for nearly a century,
                     allowing for reasonable estimates of the natural variances in this area [19]. The EMSAfrica
                     Project declares a region of 16 km2 to be the collaborative research area. In this near-natural
                     site, the primary disturbance agent of trees is the African Elephant (Loxodonta africana).

                     3. Method
                          Agent-based modeling is an assessed approach to modeling interactions between
                     individuals and their impact on the modeled system [49]. Each agent is defined as an
                     autonomous entity that can make decisions by using information from its environment
                     and other agents. Rule-based behavior allows for the execution of various actions which
                     represent the whole range of possibilities within the system [50]. Since the behavior choices
                     of an agent depend on its internal state and its observations of the environment, the
                     behaviors of agents tend to vary over time. A simulation of the model is divided into
                     discrete time steps, and all updates in the environment and interactions of the agents are
                     recorded. The used modeling framework, MARS (Multi-Agent Research and Simulation),
                     is under development at the University of Applied Sciences in Hamburg, Germany. The
                     group has worked on different topics but has focused mainly on designing large-scale
                     ABMs [51–53]. The analyses and visualizations in this study were performed with the
                     programming languages Python (version 3.7.x) and R (version 3.6.x) and the online GIS
                     visualization tool https://kepler.gl (accessed on 19 April 2022). The setup of the ABM
                     involved, firstly, a technical construction of the environment with different layers and,
                     secondly, a realization of the different agent types with corresponding attributes and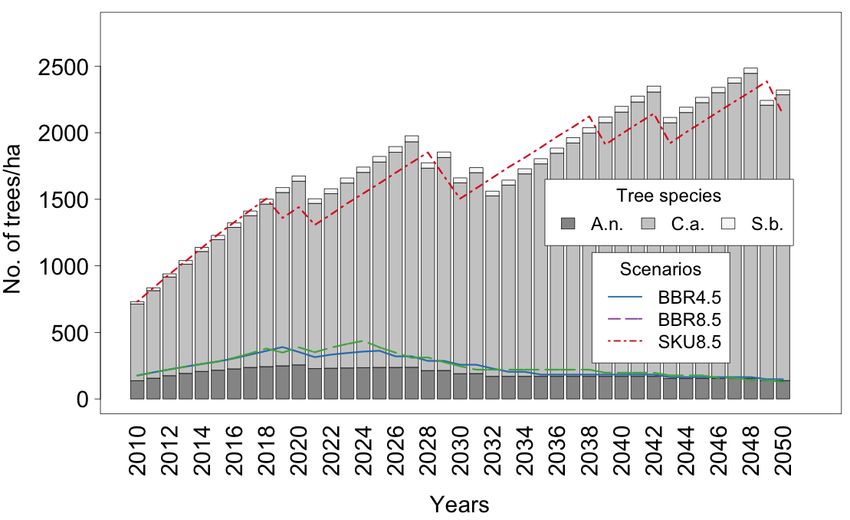
Land 2022, 11, 619                                                                                                  5 of 24

                     behaviors. All agents were designed as individual entities that sense the environment, their
                     surroundings, as well as other agents with which they can interact. Additionally, the two
                     climate scenarios were defined mainly to create minimum and maximum temperature, days
                     of frost, and precipitation per day. The conceptual model of the ABM is shown in Figure 3.
                     The workflow employed for this study covers data acquisition and integration, model
                     development, scenario simulation, and result analysis and visualization (see Figure A1).

                     Figure 3. Conceptual model of the implemented ABM. Each of the three agent types, FirewoodCol-
                     lector, Tree, and Elephant, is defined by a set of attributes and equipped with a set of active and/or
                     passive actions. A FirewoodCollector is associated with a Household, while an Elephant is associated
                     with an Elephant Group. Trees are interfaced with EnvironmentalFactors and a HerbivorePressure
                     component. These external forces, along with disturbances by FirewoodCollectors and Elephants,
                     impact the state of Trees in the ABM. For more details, see Appendix B.

                     3.1. Agents
                          The research question focuses on the current and potential distribution of different
                     tree species in Lowveld. The region is characterized by different land uses, making an
                     inclusion of this feature in the question essential to the modeling process. This leads to
                     the three agent types Tree, FirewoodCollector, and Elephant to compare human–tree to
                     elephant–tree interactions. For more details on the structure and properties of the ABM,
                     see Appendix A. For more details on the parameters and behavior routine of each agent
                     type, see Appendix B.

                     3.1.1. Tree
                           The agent-type Tree is the key component of both models and, therefore, is identical
                     in both models. Since trees in savannas have various strategies against disturbances, the
                     agent-type Tree must represent a wide variety of behaviors. Much work has been conducted
                     to describe these differences (see, e.g., [54–58]). Wigley et al. [56] collected data about leaf
                     traits in different savanna trees. This data set was the fundamental resource for defining
                     tree species in the ABM. For different survival strategy, the most abundant tree species
                     Acacia nigrescens, Combretum apiculatum, and Sclerocarya birrea [9] were chosen. Additionally,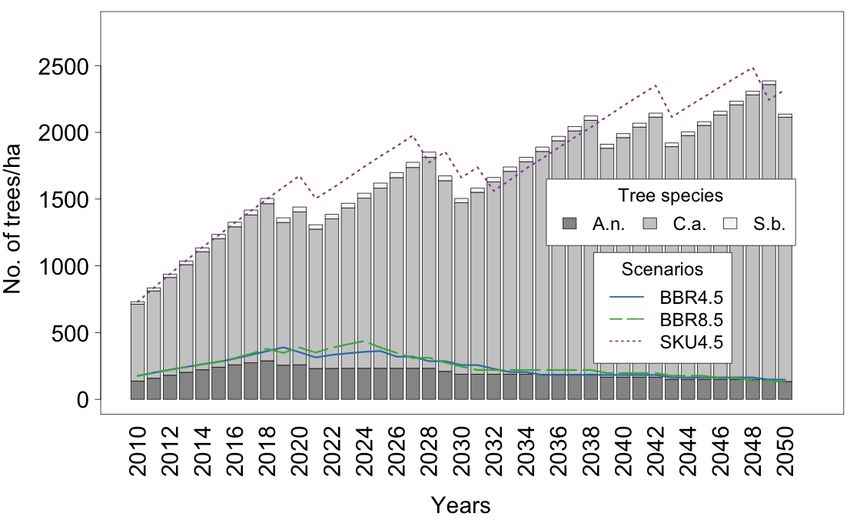
Land 2022, 11, 619                                                                                             6 of 24

                     to obtain a realistic density of trees in the simulation, a generic tree species named Tree tree
                     was developed. It has attribute values mediated over the three selected tree species.
                           A key characteristic of the life cycle of savanna trees, illustrated in Figure 4, is the
                     ability to return adult trees back to a juvenile state upon damage. If there is too much or too
                     frequent damage, the tree remains a juvenile without any seed production. Damage can be
                     caused by FirewoodCollectors or Elephants. The damage classes, modified after [59], are N
                     (80%).

                     Figure 4. Tree lifecycle: From seed to adult tree or back to juvenile.

                     3.1.2. Firewood Collector
                          A FirewoodCollector is an independent agent that is part of a Household in the BBR
                     Model. A Household consists of six family members with daily firewood consumption.
                     This consumption causes the FirewoodCollector to have to refill the firewood stock of the
                     Household as needed. In pursuit of firewood, a FirewoodCollector can perform different
                     actions, such as collecting dead wood or cuttings shoots [14]. Each action is weighted by a
                     preference and a cost to reach the site of action, as listed in Table A3. Depending on the
                     location of the agent, the surroundings are explored and the most preferable action is chosen
                     until the capacity for a return is reached. The collection routine of a FirewoodCollector
                     consists of moving to a reasonable position within the firewood site, orienting itself, and
                     beginning collection. If no reasonable action is available (e.g., due to overcutting or
                     distance), the FirewoodCollector might return without reaching its collection goal.

                     3.1.3. Elephant
                           The agent type Elephant is the main driver of tree damage in the SKU Model [47].
                     Female elephants are organized in family groups with one leading cow. The Elephant
                     agents are executed in their own model [35]. A coupling between this model and the SKU
                     Model allows Elephant agents to walk through the whole modeled KNP and interact with
                     Tree agents in the SKU Model. (The MARS KNP base model and the elephant agent can be
                     downloaded here: https://github.com/MARS-Group-HAW/KNP (accessed on 19 April
                     2022)). The elephant distribution of the KNP elephant model was based on helicopter
                     counts performed in the KNP. Whether a single elephant or a herd of elephants is about to
                     enter the SkukuzaPlot depends mainly on available water and a random factor. For more
                     details, see [35]. As Figure A5 shows, damage to the trees varies depending on the month,
                     tree species, droughts, and the state of the tree [59–62].

                     3.2. Layers
                          Along with agents, the environment is a key component of an ABM. In an ABM
                     designed with MARS, the environment is made up of multiple layers. Each agent has
Land 2022, 11, 619 7 of 24
a georeferenced coordinate that describes its location in the environment. The environ-
ment, in turn, comprises several time-series layers that hold, for example, climate data. By
querying these time-series layers, an agent can sense environmental attributes such as, for
example, temperature, precipitation, and aggregated data such as the sum of precipitation
within the last 12 days. In this model, the environment is made up of an ElephantLayer,
a FirewoodCollectorLayer, and a TreeLayer, each as an organization unit. Furthermore,
the model includes a TemperatureLayer, a PrecipitationLayer, and a DroughtLayer. The
TemperatureLayer comprises time-series data that provide daily maximum, minimum, and
average temperature to querying agents. The PrecipitationLayer includes daily precipita-
tion and a function to calculate precipitation for a given interval. The DroughtLayer results
from the precipitation layer and serves to switch between average-year and drought-year
attribute values in Tree agents. In a drought year, all seeds and seedlings die, and juveniles
die at a random probability between 7% and 15% [63]. When a Tree is alive, the deadwood
production is 1.7% of the AGB [64]. Even when there is no firewood collection or damage
by elephants, the AGB is regularly reduced by herbivores, pastorals, and insects [19,65].
Therefore, a HerbivorePressureLayer was included to manage the reduction in biomass for
each Tree once a year.
3.3. Parameterization
Due to the favorable quantity and quality of data in both research areas, no infield
data collection was performed specifically for this study. Instead, existing data were used
for the parametrization and initialization of the model. Each Tree agent must have its own
lifecycle covering the stages seed, seedling, juvenile, adult, and dead, with corresponding
parameters (see Table 1). In Appendix B.1, a more detailed description of each attribute of
the Tree agent type is provided: state (age class), living and dead wood mass, maximum
stem diameter, number of days with photosynthetic activity per year, damage type, juvenile
growth rate, adult growth rate, first time of seed production, number of seeds, space needed
for germination, mortality after drought for seeds, juveniles and adults, time span from
seedling to juvenile, and days of precipitation as a seed [2,17,59,64,66–68].
Table 1. Tree parameters per modeled species.
Acacia nigrescens
SeedlingLand 2022, 11, 619 8 of 24
study site were modeled. For the BBR Model, it was calculated that 56 FirewoodCollector
agents represent 336 inhabitants of Agincourt for these 100 ha. This corresponds to 4104
people in 684 households, which equals half of the population of Agincourt in 2017 [48].
For more information, see Appendix B.2.
Table 2. Firewood collector parameters.
FirewoodCollector
Households 684 (4100 persons)
Firewood demand per Household 10 kg per day
Household members 6
Hours per collection 3
Per hour collection time 5 km distance; 20 km dead wood; 15 kg shoots; 10 kg living wood
Demand per collection (kg) 15–40
Most stem cut 4–10 cm must >3 cm
Weekly collection frequency 3
Species preferences C.a > A.n. > S.b.
Wood collecting preferences dead wood > coppicing > cutting branches > cutting down living trees
Since the elephant model is a coupled model, other requirements apply here. The
elephants can move freely throughout the KNP model and live their daily lives there [35].
They enter the elephant–tree interaction submodel only when they come close to the
geographic extent modeled by the SKU Model. Thus, the parameterization for this model
is limited to what the elephants do when they are in the SKU Model (see Section 3.1.3). Due
to the high complexity of the model coupling, the study area is limited to 9 ha. For more
information, see Appendix B.3.
3.4. Initialization
Tree distribution of the given AGB is related to the measured distribution of tree
species and their age classes for both sites [17,18,25,33,47,70,71]. Tree agents were gen-
erated only once for the BBR Model and once for the SKU Model by applying the data
from Tables 3 and 4, respectively. Their georeferenced placement in the environment was
performed at random. The initialization process produced a comma-separated values (CSV)
file with all generated trees including their georeferenced position, species, stem diameter,
and age state. The total AGB differs from 10 t/ha [33] in the rural area to 23 t/ha [17] in
the KNP.
Table 3. Tree initialization in the BBR Model.
BBR Model A.n. C.a. S.b. T.t. (98%) Total
State Seedling Juvenile Adult Seedling Juvenile Adult Seedling Juvenile Adult Seedling Juvenile Adult
Individuals 8 2 0 31 131 3 31 73 7 3546 638 38 4508
AGB t/ha 0 0.2 0 0.445 0 0.765 0 8.78 10
Table 4. Tree initialization in the SKU Model.
SKU Model A.n. C.a. S.b. T.t. (33%) Total
State Seedling Juvenile Adult Seedling Juvenile Adult Seedling Juvenile Adult Seedling Juvenile Adult
Individuals 683 130 7 2888 550 26 89 17 1 1817 300 46 6554
AGB t/ha 0 3.9 0 5.4 0 6.1 0 7.6 23
3.5. Scenarios
This study includes models of two sites, the BushbuckridgePlot and the SkukuzaPlot
(see Sections 2.1 and 2.2, respectively), with different tree disturbance agents. In South
Africa, the temperature has increased over the last few decades. Additional climate change
is projected to lead to temperature increases of up to 6 °C and changing precipitation
patterns [72]. In order to have a first meaningful comparison, the two extreme climate
scenarios RCP 4.5 and RCP 8.5 were selected (see Table 5).Land 2022, 11, 619 9 of 24
Table 5. IPCC Scenarios (RCP 4.5 and RCP 8.5).
RCP 4.5
Seedling mortality 88–100%
Growth rate Max. growth ratespecies = 100%
Drought years BBR (Land 2022, 11, 619 10 of 24
(a) (b)
Figure 5. (a) Total AGB of all trees in t/ha summed across all species, and (b) average number of
trees in one hectare summed across all species.
In Figure 5b, all four scenarios show an increase in the total number of trees in the
first seven years. Due to a stable AGB, this must be a trend toward more but thinner trees.
For the BBR Model, the analyses show that even in times when there is nearly no AGB, a
considerable number of trees exists in the scenario. This means that the diameter must be
minimal.
The differences in the RCP scenarios are driven mainly by the different droughts that
cause the death of many trees. However, within the near-nature SKU Model, the numbers
always recovered after a few years.
In Figure 6a–d, the results are stratified by age class. The amount of AGB, as well as
the number of trees, is mainly driven by the age class Juvenile. Here, we were not able to
distinguish between juveniles that become adults and juveniles that remain in their current
state (see Figure 4).
(a) (b)
(c) (d)
Figure 6. Results grouped by age class per hectare and summed over all species for (a) BBR RCP 4.5
Scenario, (b) BBR RCP 8.5 Scenario, (c) SKU RCP 4.5 Scenario, and (d) SKU RCP 8.5 Scenario.
However, the results (see Figure 7) indicate that all adult trees in the rural area will be
lost under ongoing firewood collection. In the KNP, a high loss of big trees over the last
years was observed. Nevertheless, it seems that the number of adult trees is stabilizing.Land 2022, 11, 619 11 of 24
Figure 7. Number of adult trees in one hectare (sum of all species).
4.2. Tree Species
For the three tree species considered (see Figure 8a–d), the results are heterogeneous.
In the BBR Model, irrespective of the scenario, there are only two A.n. individuals per ha.
Even with the total number of trees, which is more than 450,000 at this site, it is difficult to
detect a clear trend. In total, a rare species becomes even rarer over time.
(a) (b)
(c) (d)
Figure 8. Distributions of Tree species A.n., C.a., and S.b. in (a) BBR RCP 4.5 Scenario, (b) BBR RCP
8.5 Scenario, (c) SKU RCP 4.5 Scenario, and (d) SKU RCP 8.5 Scenario.
For the SKU Model, the number of single trees is similar from 2010 to 2050, with higher
numbers in between. Here, A.n. seems to be more stable than outside the protected areas.
C.a. shows the most significant differences across sites. In the rural area, the number
of trees is declining; in the SKU Model, however, a fourfold increase in trees within the
40 simulated years were observed. Surprisingly, the RCP 4.5 Scenario produces higher
numbers than the RCP 8.5 Scenario.
S.b. plays a unique role in rural areas. Since it is forbidden by law to cut down an
adult tree, a stable number of Marula trees can be observed over a long time. This tree
species was harvested only when other sources of firewood became scarce. There is still aLand 2022, 11, 619 12 of 24
stable number of trees in both climate scenarios. However, these are mainly juvenile trees,
as mentioned before (see Figure 4).
However, because of the declining number of adult trees (see Figure 7), each tree with
the damage class Extreme or Dead changes the age class distribution to more juvenile trees
and fewer adult trees.
5. Discussion
This study aimed to compare the current and future distribution of savanna trees at
the individual level for two different forms of land use and under two different climate
scenarios by comparing the results of differently parameterized simulations of a large-scale
ABM.
The findings suggest extreme differences between the two types of land use. In the
rural area, there will be a substantial loss of trees under ongoing firewood collection and
land use change [16,25,47,75]. Even if the projections are hyperbolized, the decreasing
number of adult trees will destabilize the system. However, the results also show that there
are still enough individual trees to potentially stabilize the site. For this to happen, the
ongoing firewood collection must be regulated.
In the SKU Model, the AGB seems to fluctuate only slightly but with a significant
trend toward more and thinner trees [76]. This is mainly driven by an increasing number of
juvenile C.a. trees. This finding corresponds to a potential shift in the species composition
and bush encroachment [16].
To compare the forms of land use, the main disturbers of trees were modeled. The
agent type FirewoodCollector was modeled with GOAP to show adaptive behavior in
starting to collect less firewood as a result of changing conditions at the site after some time
of overharvesting. Nevertheless, the total number of extreme damage to trees, inflicted by
coppicing or tree felling, is extremely high [47,70].
Elephant damage is most detrimental in the damage class Low, which means damage
up to 30% [34]. Such damage seems to regulate the biomass in total. However, all pushover
and ringbarking of adult trees changes the tree distribution because of a lack of upcoming
new adult trees [22,61].
This research suggests no significant differences between the two considered climate
scenarios. Here, the strongest differences in temperature and precipitation do not start
until 2050. Hence, the time frame of the simulations would need to be extended in order
to detect potential long-term differences in tree distribution due to differences in climate
projections.
In all four scenarios, a loss of adult trees was observed. Even if savanna trees have a
high potential of recovering after damage, fewer adult trees imply fewer seeds over time.
Therefore, every single tree that disappears from the landscape might have a destabilizing
effect on the tree–grass savanna system. Seeing elephants as agents that rebuild the savanna
over time [34] can help to understand the future distribution of mature trees.
The situation looks more dramatic in the rural areas, where the demand for firewood
will no longer be covered sustainably by the ecosystem. When the preferred stem diameter,
i.e., 4−10 cm, becomes scarce, the FirewoodCollector resorted to cutting down larger
trees [25]. Both disturbers covered by this study can create specific spatial patterns without
adult trees [47]. A few healthy mature trees can stabilize the savanna system. However, the
generation of, for example, S.b., is highly episodic [77] and needs many years to reestablish
a normal age class distribution.
We are aware that this study has several limitations. Future iterations of the model
will need to include more complexity in all three agent types. Trees will be extended with
more detailed seed production and dispersal. As a result, elephants will interact with
trees as seed distributors. For more realistic human behavior, a wider range of goals and
actions need to be included to capture more of the changing living conditions in rural areas.
Nevertheless, technical innovations and other unforeseen developments that might reduce
the reliance of the modeled communities on firewood for cooking are also not included inLand 2022, 11, 619 13 of 24
the model. The ways in which future trends might cause the adaption of human behavior
during long-term simulations can be explored in more detail with models such as this one.
6. Conclusions
The use of an ABM to model future tree distribution in the savanna landscape gave
some insight into the different systems. There are differences between the tree compositions
in the rural area and in the KNP.
The BBR Model has a stable AGB for a long time. However, when overharvesting
starts, the collected diameter decreases accordingly. Even when there is different firewood
quality, the collection pressure equalizes it. Additionally, if all adults are under continuous
high pressure and at the hands of ongoing collection, they will likely disappear with fatal
consequences. However, when the system can recover for some years, it might return to a
stable state. Protecting adult trees seems to be very important.
In the SKU Model, the system is more resilient during periods of high elephant
damage. In total, the system tends toward more individuals with smaller stem diameter.
Adult S.b. disappear because of elephant damage during droughts. Protecting single adult
Marula trees seems to be a good way to stabilize the system. At the same time, C.a. is doing
very well. This is driven by a high number of juveniles and could be a signal for bush
encroachment.
One limitation of this contribution is that the analyzed data for each of the four
scenarios are based on a single simulation run. The reason for this is that a time span of
40 years was modeled. Since the model captures the daily behaviors of several thousand
individual agents, the computational complexity is considerable. This results in long real-
world execution durations of the model. Therefore, the analysis is limited to a single run of
each climate scenario.
Future work will, on the one hand, attempt to incorporate more tree–environment
interactions (by, e.g., adding fire as a tree disturber) and, on the other hand, prepare models
for policy and decision making to translate different scenarios into beneficial actions for
nature and human well-being. To this end, agent-based modeling allows the option of
replacing and supplementing all parts of the model as needed.
The study findings highlight the complexity of the savanna system. By creating a
simplified model of tree–interaction systems, we were able to form an understanding of the
three different tree species under the chosen scenarios. Moreover, changes in tree density
need decades, allowing predictive models to provide early warnings of potential loss of
tree species, loss of big trees, as well as point out zones with high potential for conflict as a
result of loss of resources.
Author Contributions: Conceptualization: U.A.L.; methodology: U.A.L., N.A.-M., D.G., F.O., J.W.
and T.C.; software: D.G., F.O. and J.W.; writing—original draft preparation: U.A.L.; writing—review
and editing, U.A.L., N.A.-M. and T.C.; supervision: T.C.; funding acquisition: T.C. All authors have
read and agreed to the published version of the manuscript.
Funding: This study was funded by the German Federal Ministry of Research for the project EM-
SAfrica (FKZ 01LL1801C).
Data Availability Statement: Pre-configured MARS models for both scenarios executable on Win-
dows, macOS, and Linux computers can be downloaded at https://git.haw-hamburg.de/mars/
model-deployments (accessed on 19 April 2022).
Acknowledgments: We acknowledge support for the article processing charge by the Open-Access
Publication Fund of the University of Applied Sciences in Hamburg, Germany.
Conflicts of Interest: The authors declare no conflict of interest.Land 2022, 11, 619 14 of 24
Abbreviations
The following abbreviations are used in this manuscript:
A.n. Acacia nigrescens
ABM Agent-based modeling
AGB Aboveground biomass
AI Artificial Intelligence
BBR Bushbuckridge
C.a. Combretum apiculatum
C.m. Colophospermum mopane
EMSAfrica Ecosystem Management Support for Climate Change in Southern Africa
GIS Geographic Information System
GOAP Goal-oriented action planning
H Damage class high, 60−80%
IPCC Intergovernmental Panel on Climate Change
KNP Kruger National Park
L Damage class light, 10−30%
M Damage class moderate, 30−60%
MARS Multi-Agent Research and Simulation
N Damage class nil,Land 2022, 11, 619 15 of 24
Appendix A.3. Adaptation
Tree: Depending on the species, they can grow, sprout, and (after reaching a specific
size) produce seeds.
Elephant: Movements depend on existing biomass and water holes. The agent type
elephant reproduces better observed behavior patterns. For example, differences in the
month with and without grass biomass, droughts, and differences in species utilization.
Only leading cows and bulls are allowed to plan actions. To show the behavior of the herd,
selected actions are then executed five times.
Firewood collector: The collection is cost-optimized. Agents attempt to minimize the
total effort of movement and wood collection. If the effort is too high, the collection is
aborted prematurely. The firewood collectors are modeled with GOAP. They must collect
an amount of firewood with preferences and different collection costs.
Appendix A.4. Objectives
Tree: Trees have to grow to become adult trees and to spawn seeds.
Elephant: Elephants interact with trees when they are inside the SKU Model.
FirewoodCollector: The behavior can be described as a sequence of decisions. GOAP
derives from the field of Artificial Intelligence (AI) and integrates adaptive decision making
into multiagent models. An action might be associated with a cost value, indicating the
effort that is necessary for the action to be executed.
The planning algorithm calculates a cost-optimized way to reach the goal. The decision-
making architecture allows agents to adapt their behavior according to a changing environ-
ment.
Each agent keeps an internal state, which is represented by a set of properties (at-
tributes). These properties are often described as Boolean predicates, evaluating to true
or false based on current property values of the agent and the state of the environment
observed by the agent. A goal can be described as a state that an agent desires to reach. For
example, an agent that has to collect firewood has a HasEnoughFirewood predicate which
evaluates to false. The agent might follow its individual goal to change the evaluation of
this predicate to true.
Appendix A.5. Fitness
Tree: Grow, become adult, and produce seeds.
Elephant: Search for food and water.
Firewood collector: Collect the required amount of firewood.
Appendix A.6. Learning
Tree: No learning.
Elephant: No learning.
Firewood collector: The experiment showed that the firewood collectors first increased
walking distance. When firewood is scarce, they collect less firewood. This emergent
behavior is a result of the exhausting circumstances.
Appendix A.7. Prediction
Tree: The tree can grow and has the ability to resprout after cutting but has a passive
role apart from that. The tree agent type responds to the RCP 8.5 Scenario with a higher
seedling survival rate and a growth rate boost of 30%.
Elephant: The amount of interaction of elephants with trees varies according to tree
species and increases with drought.
FirewoodCollector: They first collect deadwood and shoots. If the distance or the effort
is too high, collection is stopped.Land 2022, 11, 619 16 of 24
Appendix A.8. Sensing
All agents can access the environmental layers and their surrounding agents. Firewood
collectors and elephants are aware of and can sense the entire site but look for the nearest
tree with the attributes to fulfill the next action.
Tree: The growth behavior of trees is linked to the climate data coming from the IPCC
scenarios, and seeds are able to germinate only when there is enough space. Additionally,
seeds have to sense precipitation, germinating with the first rainfall. Afterwards, they
check if there is any precipitation within the first 12 days after germination to start growing
and become a seedling or die.
Elephant: They can sense the environment and recognize the tree species with all other
tree attributes.
FirewoodCollector: They can sense the way between home and firewood sites, and they
can recognize the tree species and the amount of dead and living wood mass.
Appendix A.9. Interaction
Tree: Trees receive the elephant interactions and the firewood collector interactions.
Elephant: TakeLivingWoodmass, TakeRingbarking, and PushOver.
Firewood collector: TakeDeadwood, TakeShoots, and TakeLivingwoodMass.
All actions are based on the damage to savanna trees by elephants and firewood
collection. The simulation time covers the years 2010−2050. The tick length is generally one
day, except for elephants, where there are hourly tick routines.
Appendix A.10. Stochasticity
Probability equations determinate the likelihood of tree growth and seed production,
as well as elephant interactions with trees. The firewood collectors plan their actions with
GOAP.
The main focus of this study is to model a large-scale environment with many agents
over a long period of time. Therefore, the evaluation of results does not entail a stochastic
analysis.
Appendix A.11. Collectives
Tree: Trees are individuals and stand only for themselves.
Elephant: Elephants are members of elephant groups. However, males can be without
a group. Therefore, the leading cow and the bull interact with the trees. This behavior is
afterwards repeated five times with other trees.
Firewood collector: One firewood collector represents a household of six members. All
households are part of Agincourt, South Africa.
Appendix A.12. Observation
For model testing, the Graphical User Interface (GUI) facilitated the elephant move-
ment. Tree growth and collection behavior was observed with R (version 3.6.x) and the
open-source visualization tool https://kepler.gl (accessed on 19 April 2022).
Tree: AGB in total per species, species composition, age class (state) composition,
damage classes, reason to die, and number of juveniles becoming adults and vice versa.
Elephant: Pathway tracking.
Firewood collector: Amount of collected firewood per collection and the number of and
reasons for collection abortions.
Appendix B. Supplementary Information on Agent Types
In this Appendix, additional information of the agent types Tree, FirewoodColector,
and Elephant are included. As an overview, the technical workflow of the model is
illustrated in Figure A1. It highlights the major steps of the model execution process,Land 2022, 11, 619 17 of 24
beginning with the integration of external data into the model and ending with the storage
of model results in a database for further analysis.
Modeling Project
ABM (here: tree distribution with trees, elephants, humans in South Africa)
Agents Environment
Databases for
model input data
(here: each agent with its own coordinates (here: climate data)
and a set of attributes)
Upload model and data files to MARS
Simulation in MARS
(here: tick length = 1day, simulation time = 2010 - 2050)
Sense
Reason
Act
Each agent for each tick Database
cluster
Visualization
back-end service
Result Processing
MARS Infrastructure Data aggregation Visualization
Mongo DB
Document-oriented
NoSQL database.
R (version 3.6.x)
kepler.gl
Python (version 3.7.x)
Figure A1. Illustration of technical workflow from model initialization to result storage.
Appendix B.1. Agent Type: Tree
In a perfect world, seeds receive water from rainfall within the first 12 days, have
enough space to germinate (for more details, see Table A1), and thereby survive the first
probability to die [68]. Thereafter, in the simulation, the seed becomes an instance of
the agent type Tree. The species of that single tree is derived from the seed, which was
produced by an adult tree. The first state is Seedling. In this state, the tick-based behavior
(see Figure A2) brings the Seedling to a Juvenile if it is still alive at the start of the next
vegetation year (October 1). Trees grow only when they have leaves. For this study, all trees
have leaves from October 1 to March 31. For the daily tick routine, the total growing in one
year is divided in the value of the attribute DaysWithLeavesOn. In the states Juvenile and
Adult, each tree has the attributes: aboveground biomass (AGB), stem diameter, maximum
growth rate, damage class, and the ability to switch from LeavesOn in photosynthetic
active growing season to LeavesOff. For each species, there is a threshold by stem diameter
to change between states (see Table A2). Only adult trees are able to produce seeds. In March,
an adult tree spawns 50 seeds in its surroundings [67]. With the first rainfall after spawning,
the life cycle starts again. The daily tick routine of Juvenile and Adult trees (see Figure A3)
starts with a check of new damage because damage has the most impact on the trees.
Table A1. Need for space for establishment.
Radius (cm) of No Establishment When Neighbored by Seedling Juvenile Adult
A.n. 4 32 80
C.a. 4 40 80
S.b. 4 80 500
T.t. 4 52 220Land 2022, 11, 619 18 of 24
Figure A2. Daily tick routine for Tree agent in seedling state.
Figure A3. Daily tick routine for juvenile and adult Tree.Land 2022, 11, 619 19 of 24
Table A2. Age types classification by stem diameter.
A.n. C.a. S.b. T.t.
Seedling 13
Max. 20 20 50 30
Growth Rates—Juveniles
The maximum growth rate (max) per species based on undisturbed average diameter
and time span to become an adult tree. In the following equations, xi represents the stem
diameter during the simulation tick i.
A.n. (StemDiameter 1–14 cm) xi+1 = xi + (−0.068 · xi + 0.9) (A1)
C.a. (StemDiameter 1–13 cm) xi+1 = xi + (−0.068 · xi + 1.2) (A2)
S.b. (StemDiameter 1–19 cm) xi+1 = xi + (−0.068 · xi + 1.9) (A3)
T.t. (StemDiameter 1–16 cm) xi+1 = xi + (−0.068 · xi + 1.33) (A4)
Growth Rates—Adults
• Definition reduceFactor : The growth rate is reduced by damage. For damage type
N, the growth rate is maximized; damage type L reduces the growth rate randomly
between 0−10%; damage type M reduces the growth rate randomly between 10−30%;
and damage type H reduce the growth rate randomly between 30−60%. By damage
type X, the tree falls back into the juvenile state or dies.
• Definition growthRate: Because Combretum apiculatum grows more slowly than Acacia
nigescens and Sclerocarya birrea, a growthRate value was integrated. The value for
Acadia is 0.5, and 1 for all species.
• Definition MaxStemDiameter (xmax ): The maximum stem diameter differs by species.
It is 20 cm for A.n.; 20 cm for C.a.; 50 cm for S.b., and 30 cm for T.t.
!
xi
x i +1 = x i + 1 − · growthRate ÷ DaysWithLeaves · reduceFactor (A5)
xmax
• Germination, establishment and needs to become a seedling Adults spawn 50 seeds
per year. Seeds can germinate with the first rain, but need space to grow (see Table A1).
For the tick routine of a Tree in the seedling state, see Figure A2.
Calculation from Stem Diameter to Woody Biomass
The AGB for each species was calculated based on [17]. Dried woody biomass is only
60% of the AGB. The formulas were modified accordingly. For the species, the formulas
are:
−3.55 + 3.06 · ln(StemDiameter)
A.n. (AGB) = (A6)
0.6
−3.27 + 2.8 · ln(StemDiameter)
C.a. (AGB) = (A7)
0.6
−3.35 + 2.62 · ln(StemDiameter)
S.b. (AGB) = (A8)
0.6
−3.39 + 2.827 · ln(StemDiameter)
T.t. (AGB) = (A9)
0.6
Appendix B.2. Agent Type: FirewoodCollector
The agent type FirewoodCollector is modeled with GOAP. To calculate the best se-
quence of actions, there must be a list of actions and costs (Table A3). The tick routine of
the FirewoodCollector is illustrated in Figure A4.Land 2022, 11, 619 20 of 24
Table A3. Actions and cost for firewood collection.
Action Cost
CutBranchAn 50
CutBranchCa 50
CutBranchSb 90
CutBranchTt 50
CutShoot 30
CollectDeadWood 10
CarryWoodHome 0
AbortAndGoHome 0
EvaluateAndPackWoodForTransport 0
Figure A4. Daily tick routine for FirewoodCollector.
Appendix B.3. Agent Type: Elephant
During the dry season and especially in September, up to 94% of the elephant
diet consists of woody biomass [59]. The different utilization of trees by elephant from
[59,61,62,68,78,79] were included (see Table A4).
Table A4. Ranking of Elephant interactions.
Elephant Interactions
Food preferences Fresh grass > fresh leaves > twig, bark, and roots
Ringbarking (by food/water stress) A.n. > S.b.
C.a.
Pushover (by food/water stress) Juvenile A.n. > S.b.
No damage Stem diameter < 2 cmLand 2022, 11, 619 21 of 24
Figure A5 shows the tick routine of the elephant. Damage to the trees varies depending
on the month, tree species, droughts, and state of the tree [59–62].
Figure A5. Elephant hourly tick routine in the SKU Model.
References
1. Blanco, C.C.; Scheiter, S.; Sosinski, E.; Fidelis, A.; Anand, M.; Pillar, V.D. Feedbacks between vegetation and disturbance processes
promote long-term persistence of forest-grassland mosaics in south Brazil. Ecol. Model. 2014, 291, 224–232. [CrossRef]
2. Helm, C.V.; Scott, S.L.; Witkowski, E.T.F. Reproductive potential and seed fate of Sclerocarya birrea subsp. caffra (marula) in the
low altitude savannas of South Africa. S. Afr. J. Bot. 2011, 77, 650–664. [CrossRef]
3. Jacobs, O.S.; Biggs, R. The status and population structure of the marula in the Kruger National Park. S. Afr. J. Wildl. Res. 2002,
32, 1–12.
4. Manning, A.D.; Fischer, J.; Lindenmayer, D.B. Scattered trees are keystone structures—Implications for conservation. Biol.
Conserv. 2006, 132, 311–321. [CrossRef]
5. Stevens, N.; Swemmer, A.M.; Ezzy, L.; Erasmus, B.F.N. Investigating potential determinants of the distribution limits of a savanna
woody plant: Colophospermum mopane. J. Veg. Sci. 2014, 25, 363–373. [CrossRef]
6. Accatino, F.; Wiegand, K.; Ward, D.; De Michele, C. Trees, grass, and fire in humid savannas-The importance of life history traits
and spatial processes. Ecol. Model. 2016, 320, 135–144. [CrossRef]
7. Colgan, M.S.; Martin, R.E.; Baldeck, C.A.; Asner, G.P. Tree foliar chemistry in an African savanna and its relation to life history
strategies and environmental filters. PLoS ONE 2015, 10, e0124078. [CrossRef]
8. Higgins, S.I.; Bond, W.J.; Combrink, H.; Craine, J.M.; February, E.C.; Govender, N.; Lannas, K.; Moncreiff, G.; Trollope, W.S.W.
Which traits determine shifts in the abundance of tree species in a fire-prone savanna? J. Ecol. 2012, 100, 1400–1410. [CrossRef]Land 2022, 11, 619 22 of 24
9. Lenfers, U.A.; Brüggemann, R.; Clemen, T. Exploring survival strategies of African Savanna trees by partial ordering techniques.
Ecol. Inform. 2017, 42, 14–23. [CrossRef]
10. Tomlinson, K.W.; Poorter, L.; Sterck, F.J.; Borghetti, F.; Ward, D.; de Bie, S.; van Langevelde, F. Leaf adaptations of evergreen and
deciduous trees of semi-arid and humid savannas on three continents. J. Ecol. 2013, 101, 430–440. [CrossRef]
11. Coates-Palgrave, K. Trees of Southern Africa, 3rd ed.; Struik Nature, Penguin Random House (Pty) Ltd.: Century City, South Africa,
2002; p. 1212.
12. Fisher, J.T.; Witkowski, E.T.; Erasmus, B.F.; Van Aardt, J.; Asner, G.P.; Wessels, K.J.; Mathieu, R. Human-modified landscapes:
Patterns of fine-scale woody vegetation structure in communal savannah rangelands. Environ. Conserv. 2012, 39, 72–82. [CrossRef]
13. Kaschula, S.A.; Twine, W.E.; Scholes, M.C. Coppice harvesting of fuelwood species on a South African common: Utilizing
scientific and indigenous knowledge in Community Based Natural Resource Management. Hum. Ecol. 2005, 33, 387–418.
[CrossRef]
14. Lenfers, U.A.; Weyl, J.; Clemen, T. Firewood Collection in South Africa: Adaptive Behavior in Social-Ecological Models. Land
2018, 7, 97. [CrossRef]
15. Madubansi, M.; Shackleton, C.M. Changes in fuelwood use and selection following electrification in the Bushbuckridge lowveld,
South Africa. J. Environ. Manag. 2007, 83, 416–426. [CrossRef] [PubMed]
16. Mograbi, P.J.; Witkowski, E.T.; Erasmus, B.F.; Asner, G.P.; Fisher, J.T.; Mathieu, R.; Wessels, K.J. Fuelwood extraction intensity
drives compensatory regrowth in African savanna communal lands. Land Degrad. Dev. 2019, 30, 190–201. [CrossRef]
17. Nickless, A.; Scholes, R.J.; Archibald, S. A method for calculating the variance and confidence intervals for tree biomass estimates
obtained from allometric equations. S. Afr. J. Sci. 2011, 107, 1–10. [CrossRef]
18. Odipo, V.; Nickless, A.; Berger, C.; Baade, J.; Urbazaev, M.; Walther, C.; Schmullius, C. Assessment of Aboveground Woody
Biomass Dynamics Using Terrestrial Laser Scanner and L-Band ALOS PALSAR Data in South African Savanna. Forests 2016,
7, 294. [CrossRef]
19. Scholes, R.J.; Gureja, N.; Giannecchinni, M.; Dovie, D.; Wilson, B.; Davidson, N.; Piggott, K.; McLoughlin, C.; Van der Velde, K.;
Freeman, A.; et al. The environment and vegetation of the flux measurement site near Skukuza, Kruger National Park. Koedoe
2001, 44, 73–84. [CrossRef]
20. Statistics South Africa. South African Community Survey 2016. Available online: https://www.statssa.gov.za (accessed on 30
March 2022).
21. Banks, D.I.; Griffin, N.J.; Shackleton, C.M.; Shackleton, S.E.; Mavrandonis, J.M. Wood supply and demand around two rural
settlements in a semi-arid Savanna, South Africa. Biomass Bioenergy 1996, 11, 319–331. [CrossRef]
22. Emanuel, P.L.; Shackleton, C.M.; Baxter, J.S. Modelling the sustainable harvest of Sclerocarya birrea subsp. caffra fruits in the
South African lowveld. For. Ecol. Manag. 2005, 214, 91–103. [CrossRef]
23. Munalula, F.; Meincken, M. An evaluation of South African fuelwood with regards to calorific value and environmental impact.
Biomass Bioenergy 2009, 33, 415–420. [CrossRef]
24. Scheiter, S.; Schulte, J.; Pfeiffer, M.; Martens, C.; Erasmus, B.F.; Twine, W.C. How Does Climate Change Influence the Economic
Value of Ecosystem Services in Savanna Rangelands? Ecol. Econ. 2019, 157, 342–356. [CrossRef]
25. Twine, W.C.; Holdo, R.M. Fuelwood sustainability revisited: Integrating size structure and resprouting into a spatially realistic
fuelshed model. J. Appl. Ecol. 2016, 53, 1766–1776. [CrossRef]
26. Wessels, K.J.; Colgan, M.S.; Erasmus, B.F.; Asner, G.P.; Twine, W.C.; Mathieu, R.; Van Aardt, J.A.; Fisher, J.T.; Smit, I.P. Unsustain-
able fuelwood extraction from South African savannas. Environ. Res. Lett. 2013, 8, 014007. [CrossRef]
27. Baxter, P.W.J. Modeling the Impact of the African Elephant, Loxodonta africana, on Woody Vegetation in Semi-Arid Savannas.
Ph.D. Thesis, University of California, Berkeley, CA, USA, 2003.
28. Bonan, G.; Levis, S.; Sitch, S. A dynamic global vegetation model for use with climate models: Concepts and description of
simulated vegetation dynamics. Glob. Chang. Biol. 2003, 9, 1543–1566. [CrossRef]
29. Jeltsch, F.; Milton, S.J.; Dean, W.R.; Van Rooyen, N.; Moloney, K.A. Modelling the impact of small-scale heterogeneities on
tree-grass coexistence in semi-arid savannas. J. Ecol. 1998, 86, 780–793. [CrossRef]
30. Liedloff, A.C.; Cook, G.D. Modelling the effects of rainfall variability and fire on tree populations in an Australian tropical
savanna with the Flames simulation model. Ecol. Model. 2007, 201, 269–282. [CrossRef]
31. Moncrieff, G.R.; Scheiter, S.; Slingsby, J.A.; Higgins, S.I. Understanding global change impacts on South African biomes using
Dynamic Vegetation Models. S. Afr. J. Bot. 2015, 101, 16–23. [CrossRef]
32. Scholtz, R.; Kiker, G.A.; Smit, I.P.; Venter, F.J. Identifying drivers that influence the spatial distribution of woody vegetation in
Kruger National Park, South Africa. Ecosphere 2014, 5, 71. [CrossRef]
33. Mograbi, P.; Erasmus, B.; Witkowski, E.; Asner, G.; Wessels, K.; Mathieu, R.; Knapp, D.; Martin, R.; Main, R. Biomass increases go
under cover: Woody vegetation dynamics in a communally utilized semi-arid savanna in Bushbuckridge, South Africa. S. Afr. J.
Bot. 2015, 98, 191–192. [CrossRef]
34. Gaylard, A. Adopting a Heterogeneity Paradigm for Understanding and Managing Elephants for Biodiversity: A Case Study in
Riparian Woodlands in Kruger National Park. Ph.D. Thesis, University of the Witwatersrand, Johannesburg, South Africa, 2015.
35. Clemen, T.; Lenfers, U.A.; Dybulla, J.; Ferreira, S.M.; Kiker, G.A.; Martens, C.; Scheiter, S. A cross-scale modeling framework for
decision support on elephant management in Kruger National Park, South Africa. Ecol. Inform. 2021, 62, 101266. [CrossRef]
36. Smit, I.P.J.; Asner, G.P.; Govender, N.; Vaughn, N.R.; van Wilgen, B.W. An examination of the potential efficacy of high-intensity
fires for reversing woody encroachment in savannas. J. Appl. Ecol. 2016, 53, 1623–1633. [CrossRef]Land 2022, 11, 619 23 of 24
37. Bond, W.J.; Midgley, G.F.; Woodward, F.I. What controls South African vegetation—Climate or fire? S. Afr. J. Bot. 2003, 69, 79–91.
[CrossRef]
38. Trollope, W.; Trollope, L.; Biggs, H.; Pienaar, D.; Potgieter, A. Long-term changes in the woody vegetation of the Kruger National
Park, with special reference to the effects of elephants and fire. Koedoe 1998, 41, 103–112. [CrossRef]
39. SANparks. Kruger National Park, Kruger Management Plan, for the Period 2018–2028. 2018. Available online: https://www.
sanparks.org/assets/docs/conservation/park_man/knp/knp-approved-plan.pdf (accessed on 19 April 2022).
40. Engelbrecht, F.; Adegoke, J.; Bopape, M.J.; Naidoo, M.; Garland, R.; Thatcher, M.; McGregor, J.; Katzfey, J.; Werner, M.; Ichoku, C.;
et al. Projections of rapidly rising surface temperatures over Africa under low mitigation. Environ. Res. Lett. 2015, 10. [CrossRef]
41. Grimm, V.; Berger, U.; Bastiansen, F.; Eliassen, S.; Ginot, V.; Giske, J.; Goss-Custard, J.; Grand, T.; Heinz, S.K.; Huse, G.; et al. A
standard protocol for describing individual-based and agent-based models. Ecol. Model. 2006, 198, 115–126. [CrossRef]
42. Grimm, V.; Berger, U.; DeAngelis, D.L.; Polhill, J.G.; Giske, J.; Railsback, S.F. The ODD protocol: A review and first update. Ecol.
Model. 2010, 221, 2760–2768. [CrossRef]
43. Rutherford, M.C.; Mucina, L.; Lötter, C.; Bredenkamp, G.J.; Jacobus, H.L.; Scott-shaw, C.R.; Hoare, D.B.; Goodman, S.; Bezuiden-
hout, H.; Scott, L.; et al. Savanna Biome. Vegetation of South Africa, Lesotho & Swaziland. arXiv 2006, 439–539. arXiv:1011.1669v3.
44. Shackleton, C.M.; Griffin, N.J.; Banks, D.I.; Mavrandonis, J.M.; Shackleton, S.E. Community structure and species composition
along a disturbance gradient in a communally managed South African savanna. Vegetatio 1994, 115, 157–167. [CrossRef]
45. Berger, C.; Bieri, M.; Bradshaw, K.; Brümmer, C.; Clemen, T.; Hickler, T.; Kutsch, W.L.; Lenfers, U.A.; Martens, C.; Midgley,
G.F.; et al. Linking scales and disciplines: An interdisciplinary cross-scale approach to supporting climate-relevant ecosystem
management. Clim. Chang. 2019, 156, 139–150. [CrossRef]
46. Matsika, R.; Erasmus, B.F.; Twine, W.C. Double jeopardy: The dichotomy of fuelwood use in rural South Africa. Energy Policy
2013, 52, 716–725. [CrossRef]
47. Mograbi, P.; Asner, G.; Witkowski, E.; Erasmus, B.; Wessels, K.; Mathieu, R.; Vaughn, N. Humans and elephants as treefall drivers
in African savannas. Ecography 2016, 40, 1–11. [CrossRef]
48. Twine, W.C. Personal Comment, 2019. Made during EMSAfrica Stakeholder Meeting at Wits Rural Facility on 8 March 2019.
49. Kelly, R.A.; Jakeman, A.J.; Barreteau, O.; Borsuk, M.E.; ElSawah, S.; Hamilton, S.H.; Henriksen, H.J.; Kuikka, S.; Maier,
H.R.; Rizzoli, A.E.; et al. Selecting among five common modelling approaches for integrated environmental assessment and
management. Environ. Model. Softw. 2013, 47, 159–181. [CrossRef]
50. Bonabeau, E. Agent-based modeling: Methods and techniques for simulating human systems. Proc. Natl. Acad. Sci. USA 2002,
99, 7280–7287. [CrossRef]
51. Glake, D.; Weyl, J.; Dohmen, C.; Hüning, C.; Clemen, T. Modeling through model transformation with MARS 2.0. In Proceedings
of the ADS’17: Proceedings of the Agent-Directed Simulation Symposium, Virginia Beach, VA, USA, 23–26 April 2017; Volume 49,
pp. 13–24. [CrossRef]
52. Hüning, C.; Dalski, J.; Adebahr, M.; Lenfers, U.; Thiel-Clemen, T.; Grundmann, L. Modeling & simulation as a service with the
massive multi-agent system MARS. Simulation Series. In Proceedings of the Society for Computer Simulation International (ADS
’16), Pasadena, CA, USA, 3–6 April 2016; Volume 48, pp. 1–8. [CrossRef]
53. Weyl, J.; Glake, D.; Clemen, T. Agent-based Traffic Simulation at City Scale with MARS. In Proceedings of the 2018 Spring
Simulation Multiconference, Baltimore, MD, USA, 15–18 April 2018; p. 9.
54. Charles-Dominique, T.; Midgley, G.F.; Tomlinson, K.W.; Bond, W.J. Steal the light: Shade vs fire adapted vegetation in for-
est–savanna mosaics. New Phytol. 2018, 218, 1419–1429. [CrossRef]
55. Stevens, N.; Lehmann, C.E.R.; Murphy, B.P.; Durigan, G. Savanna woody encroachment is widespread across three continents.
Glob. Chang. Biol. 2017, 23, 235–244. [CrossRef]
56. Wigley, B.J.; Slingsby, J.A.; Díaz, S.; Bond, W.J.; Fritz, H.; Coetsee, C. Leaf traits of African woody savanna species across climate
and soil fertility gradients: Evidence for conservative versus acquisitive resource-use strategies. J. Ecol. 2016, 104, 1357–1369.
[CrossRef]
57. Wright, I.J.; Westoby, M.; Reich, P.B.; Oleksyn, J.; Ackerly, D.D.; Baruch, Z.; Bongers, F.; Cavender-Bares, J.; Chapin, T.; Cornellissen,
J.H.C.; et al. The worldwide leaf economics spectrum. Nature 2004, 428, 821–827. [CrossRef]
58. Wright, I.J.; Reich, P.B.; Cornelissen, J.H.C.; Falster, D.S.; Groom, P.K.; Hikosaka, K.; Lee, W.; Lusk, C.H.; Niinemets, Ü.; Oleksyn,
J.; et al. Modulation of leaf economic traits and trait relationships by climate. Glob. Ecol. Biogeogr. 2005, 14, 411–421. [CrossRef]
59. Jacobs, O.S.; Biggs, R. The impact of the African elephant on marula trees in the Kruger National Park. S. Afr. J. Wildl. Res. 2002,
32, 13–22.
60. Cook, R.M.; Witkowski, E.T.; Helm, C.V.; Henley, M.D.; Parrini, F. Recent exposure to African elephants after a century of
exclusion: Rapid accumulation of marula tree impact and mortality, and poor regeneration. For. Ecol. Manag. 2017, 401, 107–116.
[CrossRef]
61. Moncrieff, G.R.; Kruger, L.M.; Midgley, J.J. Stem mortality of Acacia nigrescens induced by the synergistic effects of elephants
and fire in Kruger National Park, South Africa. J. Trop. Ecol. 2008, 24, 655–662. [CrossRef]
62. Shannon, G.; Druce, D.J.; Page, B.R.; Eckhardt, H.C.; Grant, R.; Slotow, R. The utilization of large savanna trees by elephant in
southern Kruger National Park. J. Trop. Ecol. 2008, 24, 281–289. [CrossRef]
63. Case, M.F.; Wigley-Coetsee, C.; Nzima, N.; Scogings, P.F.; Staver, A.C. Severe drought limits trees in a semi-arid savanna. Ecology
2019, 100, e02842. [CrossRef] [PubMed]You can also read