FAILURES AND RELIABILITY IN HAWTs OPERATING IN MOUNTAINOUS AREAS, OPEN SEA AND IN HARSCH CLIMATE SITES
←
→
Page content transcription
If your browser does not render page correctly, please read the page content below
E3S Web of Conferences 312, 11010 (2021)                                   https://doi.org/10.1051/e3sconf/202131211010
76° Italian National Congress ATI

     FAILURES AND RELIABILITY IN HAWTs OPERATING IN
     MOUNTAINOUS AREAS, OPEN SEA AND IN HARSCH
     CLIMATE SITES

     Giovanni Maria De Pratti – “La Sapienza” University of Rome – DIMA1

                   Abstract. Recently, offshore wind plants, as Horn’s Riv one, have reached a remarkable
                   interest and development. In these sites, HAWT’s blades experiment corrosion, erosion and
                   fouling and, at higher latitudes, icing conditions too, as in mountainous areas and in harsch
                   climate sites. The operative conditions may influence the machine damages and they may
                   occur as consequence of erosion, corrosion, fouling, icing, exfoliation caused by the above
                   mentioned environmental conditions. The paper reports about data collection about failures
                   occurred to HAWTS operating in offshore, mountainous and harsch climate sites in last ten
                   years. Particularly, the damage occurred to blades, gears and bearings have been examined
                   and the consequences analysed. The occurred failures are examined and the reliability of
                   WTGs is assessed by appropriate models and analysis. The results are com pared to literature
                   data and they may be very useful in programmable maintenance and in predictable one.
                   Reliability analysis may be also useful to increase energy production.

     1. Introduction

     Wind is one of the most important renewable energy sources and at the present time there are
     many wind farms in onshore and offshore sites.
     Recently, offshore wind plants, as Horn’s Riv one, have reached a remarkable interest and
     development. In these sites, HAWT’s (Horizontal Axis Wind Turbine) blades experiment
     corrosion, erosion and fouling and, at higher latitudes, icing conditions too, as in mountainous
     areas and in harsch climate sites.
     1
         Corresponding Author: giovannimaria.depratti@uniroma1.it

© The Authors, published by EDP Sciences. This is an open access article distributed under the terms of the Creative Commons
Attribution License 4.0 (http://creativecommons.org/licenses/by/4.0/).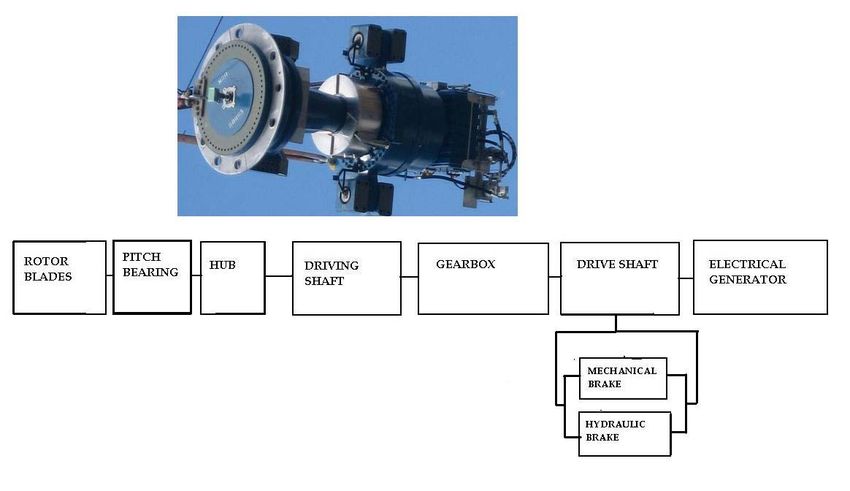
E3S Web of Conferences 312, 11010 (2021)                      https://doi.org/10.1051/e3sconf/202131211010
76° Italian National Congress ATI

    The operative conditions may influence the machine damages and they may occur as
    consequence of erosion, corrosion, fouling, icing, exfoliation caused by the above mentioned
    environmental conditions [8].
    Reliability analysis may be very useful to reach a better knowledge concerning of the behaviour
    of WTG (Wind Turbine Generator) system in the above mentioned sites and conditions [10].
    An important aspect is related to the location of the wind farm. In fact, today, many wind farms
    are built offshore for different reasons: the wind speed is more powerful and constant due to the
    absence of obstacles, and visual, environmental, and acoustic impact is cut down. Nevertheless,
    the maintenance cost is higher than the onshore wind farm. A good stochastic model can help the
    planning of preventive maintenance suggesting when is suitable to execute the maintenance
    operation. This is possible by analyzing what happens when a particular transition between two
    different states may occur.
    Evaluations about WTGs failure show that modern onshore WTs (Win d Turbine) in Europe
    achieve a high availability of 95–99% [6]. However, despite WT technology progress, in terms
    of economy and performance, WT reliability seem to be declined with growing turbine size.
    Electrical and electronic subassemblies, in particular, fail more frequently, leading to higher
    failure rates for WTs of higher complexity. An increasing number of failures cause unplanned
    downtimes up to 10 times per turbine per year, resulting in high maintenance effort and
    production loss [5].
    While the performance and the efficiency of wind turbines and their energy yields have been
    improved with time, their reliability still needs improvement, particularly when considering their
    deployment offshore [9].
    Many factors may influence the WTGs failure rate, such as wind speed, wind turbine design and
    climate conditions: these aspects should be part of every reliability analysis and assessment [8].
    In the Tab. 1 data about these aspects have been collected.
    The shown data have been collected in different way: some have been collected, directly by the
    Author, on machines or wind farms, during mainteinance operation in several Italian sites as
    Collarmele or Tocco da Casauria (in Abruzzi Region) and Frosolone (in Molise Region) and ever
    in mountainous areas, others have been collected by mainteinance journal of WTG in German
    sites or during specific inspection, while only for a group of German wind farms the data have
    been produced by a previous paper [4].
    The modelling of reliability structure of WTG has been developed by analysing many WTG lay-
    out.

                                                   2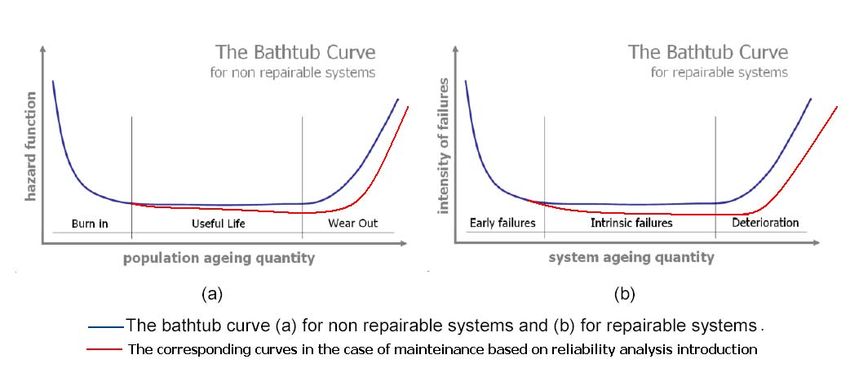
E3S Web of Conferences 312, 11010 (2021)                     https://doi.org/10.1051/e3sconf/202131211010
76° Italian National Congress ATI

                         Table 1. Climate conditions and type of site from [8]

   Particularly, it seems that WTG design complexity may show an higher failure rate than others
   and this is more evident in electric systems, electronic control, sensors, yaw systems, rotor
   blades, generator and drive train [2].
   The specific climate site conditions may be very useful in understanding the failure causes [8].

   2. Reliability of hawts

   Reliability is defined [2] as the ability to perform as required, without failure, for a given time
   interval under given conditions, whereas availability is defined as the ability to be in a state to
   perform as required in the International Electrotechnical Commission (IEC) 60050 standards.
   Particularly, reliability is the probability of a device performing its purpose adequately for the
   period of time intended under the operating conditions encountered, while availability is the
   probability of finding a system in the operating state at some time into the future as in [4]. [5]
   and [7].

                                                   3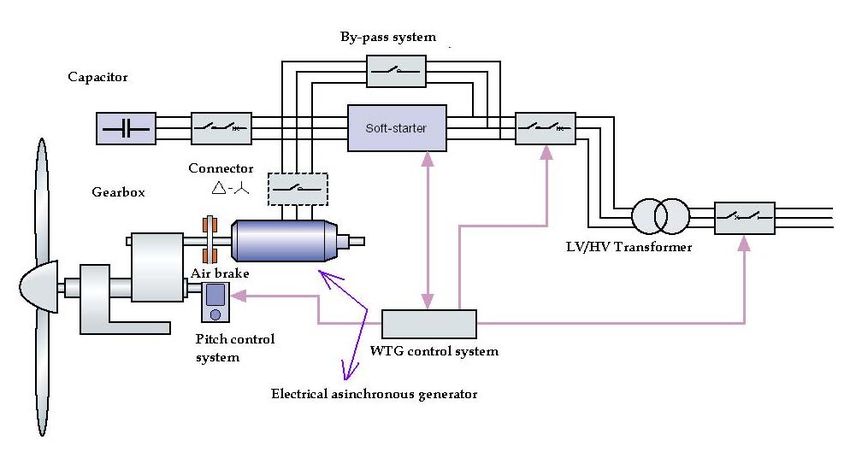
E3S Web of Conferences 312, 11010 (2021)                              https://doi.org/10.1051/e3sconf/202131211010
76° Italian National Congress ATI

    Under the mathematical point of view, reliability may be modelled as in the following equations
    as in [4] and [7].
    Reliability function, from the MTBF point of view, may be:
                                    R (t ) = e
                                              −t / m
                                                                                                           (1)
    where R(t) is reliability as function of time (t) and m is MBTF (it depends from failure rate),
    assessed by Ireson’s criteria [7];
    from a global point of view, reliability may be assessed as in the following eqs. (2) and (3):

                                               ((µ + 1 / T ) ⋅ ( D ⋅ λ + P )
                            P=                                              S
                                                                                                            (2)
                                 µ ⋅ [D ⋅ (µ + 1 / T ) + 1] + D ⋅ λ ⋅ ( µ + 1 / T ) + P S / T
    where [4] µ is the repairing rate, λ is the failure rate, T the time duration of the cycle, D the rate
    of operative running time vs. starting up numbers and PS the probability of a failure during the
    start up and, at last, P the conditioned unavailability.
    Therefore reliability evaluation is represented by
                                           R(t)*= 1-P                                              (3)
    To assess reliability of a system, the system structure function may be very useful. This structure
    has been analysed in the Figs.1, 2, 6, 7 and 8 where every block is a component or a subsystem.
    Taking into account the system shown in Fig. 1 (system structure of an HAWT) the
    corresponding reliability may be modelled as:
                                                     n
                                              Φ=∏X           j
                                                                                                           (4)
                                                     1

    Φ is the reliability function (expressed as structure system function) related to the structure and
    Xj is the generic value of the component “j” reliability. In this way reliability may be assessed at
    first on the basis of machine structure or rather the axis line of the machine.
    Obviously, Xj contributes in different way if the component is “in series” (in succession) or “in
    parallel” (in redundancy) and the corresponding contribute Xj to the Φ function is:
                                             Xj*Xk (components in “series”)                                (5)

                                    [1 – (1- Xj)*(1-Xk)] (components “in parallel”)                        (6)

                                                         4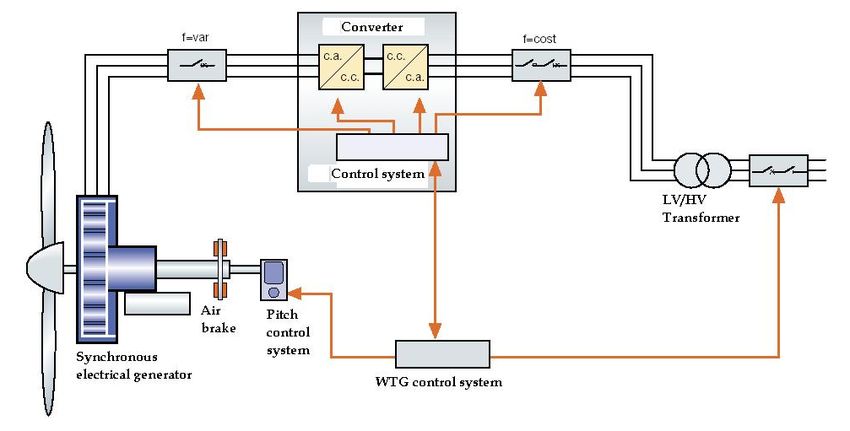
E3S Web of Conferences 312, 11010 (2021)                    https://doi.org/10.1051/e3sconf/202131211010
76° Italian National Congress ATI

                 Figure 1. An example of HAWT structure from reliability point of view

    In the Fig. 1 the succession of blocks reproduces the axis line consisting of: 1=rotor blades and
    hub, 2=driving shaft, 3=gearbox, 4=mechanical brake, 5=hydraulic brake, 4*=brakes “in
    parallel” .
    The reliability analysis and assessment may be very useful in projecting mainteinance procedures
    as shown in Fig. 2 that has been taken with modification from [10].

                           Figure 2. Reliability and mainteinance procedures

    In the Fig. 1 the modification consists of the “red line” representing the corresponding curve in
    the case of mainteinance procedures developed as suggested by reliability analysis.
    To analyse, in a correct way, the structure of an HAWT, it is very important to describe the
    components and the subsystems. They are collected in the Table 2 from [8].

                                                  5
E3S Web of Conferences 312, 11010 (2021) https://doi.org/10.1051/e3sconf/202131211010
76° Italian National Congress ATI
Table 2. Subsystems and components of HAWT from [8]
Every failure may produce a downtime with a resulting lost in energy production or a lower
power generation vs. rated power. The lost in power generation have a corresponding lost in
energy productions and this may be modelled as in [8] by the equation:
LEP= CF⋅PWTG⋅DTF⋅AFR (9)
where LEP is the lost energy production (kWh), CF the capacity factor, PWTG the WTG rated
power (kW), DTF the downtime per failure (h) and AFR the annual failure rate.
From this point of view the analysis of downtime may be very important in assessing lost energy
production from several wind farms.
The first stage of the present work has been a filed study carried out measuring the reliability of
existing WTGs at several operational wind farms in Germany and Italy, using WTGs data as: 10-
Minute average SCADA DATA, fault/alarm logs, work orders/service reports and O&M
contractor reports.
As shown in Figs. 3-4-5-6-7-8, some structure schemes may be very useful in analysing the
above mentioned data, but to analyse system reliability in the better way possible we ought to
remember the structure of systems as showed in Fig. 6 and the following formula by [10] about
the average failure rate for sub-assemblies that has been calculated over the entire recording
period according to:
λ=
∑n
i i
(10)
T −∑ D k i
6E3S Web of Conferences 312, 11010 (2021) https://doi.org/10.1051/e3sconf/202131211010
76° Italian National Congress ATI
where i is index counting the number of sub-assemblies failures, n is the number of sub-assembly
failures, T is the total length of the recording period, k is the index counting the total number of
downtimes and, obviously, D is downtime.
Figure 3. Structure of an HAWT-drive train
7E3S Web of Conferences 312, 11010 (2021) https://doi.org/10.1051/e3sconf/202131211010
76° Italian National Congress ATI
Figure 4. HAWT’s Structure (presence of gearbox) [11]
Figure 5. Gearless HAWTS’s Structure [11]
8E3S Web of Conferences 312, 11010 (2021) https://doi.org/10.1051/e3sconf/202131211010
76° Italian National Congress ATI
Figure 6. Structure of an hawt system revised from [10]
9E3S Web of Conferences 312, 11010 (2021) https://doi.org/10.1051/e3sconf/202131211010
76° Italian National Congress ATI
Figure 7. An example of hawt structure revised from [4]
In the Figs. 6 and 7 the revision consists of the insert of reliability as structure function of the
wind turbine axis line.
10E3S Web of Conferences 312, 11010 (2021) https://doi.org/10.1051/e3sconf/202131211010
76° Italian National Congress ATI
Figure 8. Full drive train structure of an hawt
In Fig. 6, 7 and 8, close by the system structure, there are the Xj value of the corresponding
reliability of the specific component and, particularly, in Figs 6 and 7 the function Φ [see
equation (4)]. As a result of the action carried out on HAWTs installed in harsch climate sites,
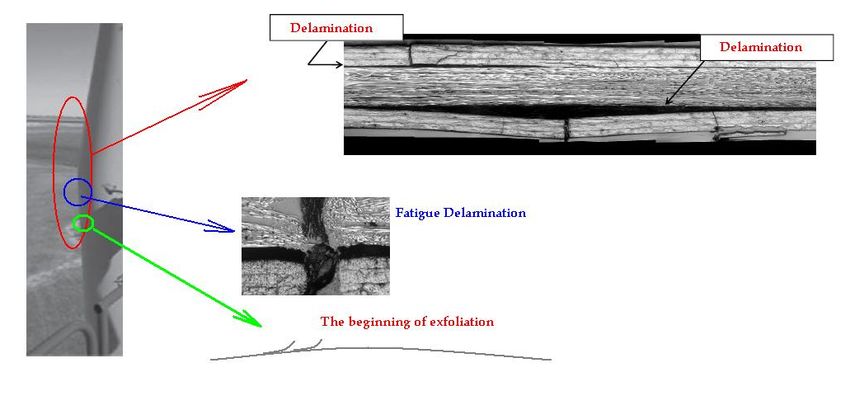
the Fig. 9 show some structural damage to blade structure detected in an Italian site in Abruzzi
Region.
Figure 9. Surfacial and structural damage for an hawt blade
11E3S Web of Conferences 312, 11010 (2021) https://doi.org/10.1051/e3sconf/202131211010
76° Italian National Congress ATI
The damage is represented by fatigue delamination, exfoliation of the blade surface material.
The impacts of climatic conditions on wind turbine failures have been investigated in many
studies as in [4] and [8]. Low temperatures could lead to lubricant freezing and brittleness in the
components while temperature variations could cause expansions and contractions. Generally,
high wind speed, turbulence and gust can produce lower reliability of wind turbine blade, pitch
and mechanical drive train, whereas temperature and humidity affect electrical components
rather than mechanical ones. The external factors such as lightning, icing and high winds
increase the failure rate of wind turbines by 1.713 times. For the effects of weather conditions on
wind turbine failures, winter is the season in which failure frequencies are increased and wind
speed did not show any impact on failure occurrences. About 30% of the blade damage cases are
caused by thunderstorms, followed by heavy rainfall with 28%. Climatic conditions can not only
have an impact on failure rates, but also affect the repair times of any failures, thus eventually
causing variation in the resulting downtime. It is intuitive that repair time for a wind turbine in a
snowy region when there is a heavy snowfall is not as the same as a region with no
environmental obstacles for repair time. Particularly, we have observed as the failure rates and
downtime values, based on different turbine types and aspects, show that direct-drive wind
turbines failure rates in electrical and electronical components are greater than geared-drive wind
turbines where gearbox failures cause the most downtime. Therefore, there is a need to determine
the criticalities in these two different types of wind turbine. Really the impact may be very high
in harsch climate sites as shown in following Tabs. Furtherly, the reliability of HAWTs may
analysed using Second-Order Semi-Markov Chain as in [3] and for structural failure may be
useful the procedure in [1] and also the other in [9].
3. Failure data analysis
Starting by the preliminary study as in [4], as previously exposed, we have collected data about
failure rates, MTBF and downtime values for several WTGs in differente sites in Germany,
North Europe Countries and in Italy, onshore and offshore, in mountainous areas and also in
harsch climate sites.
The above mentioned data are shown in the following Tabs.
12E3S Web of Conferences 312, 11010 (2021) https://doi.org/10.1051/e3sconf/202131211010
76° Italian National Congress ATI
Table 3. Data concerning of hawts taken into account in [4]
Table 4. Data about WTGs in Germany in [8] and [10]
13E3S Web of Conferences 312, 11010 (2021) https://doi.org/10.1051/e3sconf/202131211010
76° Italian National Congress ATI
Table 5. Downtimes in German Wind Farms from [8] and [5]
Table 6. Downtimes in hawts operating in harsch climate sites from [4] and [8]
The data shown in Tab. 3 concern of wind turbines failures in the analysed Italian wind farms,
while data in Tabs. 4 and 5 concern wind turbines in German sites. The Tab. 6 shows data about
the downtimes detected in German and Italian sites with the same wind turbine type (Micon,
Nordex and Vestas about 2 MW in rated power).
On the contrary, in Tab. 6 recent data (2015-2018) about Italian and German sites are exposed.
They show as the larger downtime is due to mechanical systems thet in mountainous areas may
have a particular failure sensitivity.
In the Tab. 7 recent data (2017-2019) about some Italian wind farms in mountainous sites are
exposed: according to them the drive train failures and the yaw systems ones are the larger and
14E3S Web of Conferences 312, 11010 (2021) https://doi.org/10.1051/e3sconf/202131211010
76° Italian National Congress ATI
by analysis od SCADA system data the main cause appears as the gusts suffered during winter
storms and the grid failures during the same period. Gearbox failures have caused great damages
to drive train and, particularly, to the electrical generator increasing the global downtime as yet.
Table 7. Recent data about downtimes in Italian wind farms
The annual failure rate (AFR) is defined as the average number of failures per year and the
corresponding data are shown in Tab. 8.
Table 8. AFR data concerning of wind farms analysed in [5] and [8]
15E3S Web of Conferences 312, 11010 (2021) https://doi.org/10.1051/e3sconf/202131211010
76° Italian National Congress ATI
Starting from downtimes data, it’s possible to assess reliability values for subsystems and
components, as in Tab. 9, and, then, from equation (3), (4), (5) and (6) analyse the HAWT
reliability.
The resulting value for the HAWT global reliability is shown in Tab. 10 where the reliability
value for every site-type results from the analysis of collected data about mainteinance of several
wind farms.
Table 9. Reliability values assessment for hawt subsystems and components
Table 10. HAWTs reliability values assessment
In Tab. 10 reliability assessment has been proposed as result of eq. (4) and referring to the wind
turbine structures in Fig. 8.
These values represent the functional objective that mainteinance should assure for wind turbines
in the corresponding sites and the related environmental conditions.
16E3S Web of Conferences 312, 11010 (2021) https://doi.org/10.1051/e3sconf/202131211010
76° Italian National Congress ATI
4. Conclusions
The climate conditions sites and the type of HAWT drive train affects machine reliability in a
remarkable way, and, generally, the best values are reached by gearless wind turbine.
In several mainteinance actions the Author has detect as reliability analysis results are not taken
into account, probably for a kind of different organization, but this fact doesn’t result in a good
efficiency.
The MTBF data may be very useful in organizing preventive mainteinance and the reliability
assessment according eq. (2) may useful to know the specific reliability and the MTBF expected
value if failure rate is constant.
A larger use of mainteinance procedures based on reliability analysis may be very useful
particularly in wind farms offshore, in mountainous areas and in adverse climate conditions.
A greater diffusion of these procedures among the companies that deal with maintenance would
be very important to reduce intervention times and the global mainteinance duration.
In this way, downtimes may be reduced with a lower lost in energy pruduction (LEP).
Also a reduction in AFR value using higher quality components may be very useful. To reach
this objective the reliability assessment based on eq. (4) may be useful.
As above shown, wind turbines achieve an excellent technical availability of about 98% on
average, although they have to face a high number of malfunctions.
It can be assumed that these good availability figures can only be achieved by an high number of
service teams who respond to turbine failures within short time.
Furtherly, in order to improve the reliability of WTs, the designers have to better the choice of
electric and electronic components.
This is particularly true and absolutely necessary in the case of new and large turbines,
expecially for machines operating in adverse and hasch climate conditions sites.
References
[1] ADAMS, D. et Al. (2011) : Structural health monitoring of wind turbines : method and application to a HAWT,
in Wind Energy, 2011, 14, pp. 603-623;
[2] BRESS, T. J. (2017): Wind turbine reliability, in Electrical Engineering & Computer Science Article, June 2017,
pp. 5;
[3] D’AMICO, G. et Al. (2013): Reliability measures of Second-Order Semi-Markov Chain Applied to Wind
Energy Production, in Hindawi Publ. Co. – Journal of Renewable Energy, Vol. 2013, Article ID 368940, pp. 6;
[4] DE PRATTI, G.M. (2002): Analisi dei problemi di affidabilità degli aerogeneratori operanti in ambiente
aggressivo, in Proc. of the 7th ANIV Conference, Milan, 15-18.09.2002, pp. 523.529;
17E3S Web of Conferences 312, 11010 (2021) https://doi.org/10.1051/e3sconf/202131211010
76° Italian National Congress ATI
[5] FAULSTICH, S. et Al. (2011) : Wind Turbine downtime and its importance for offshore deployment, in Wind
Energy, 2011, 14, pp. 327-337;
[6] HAHN, B. et Al. (2006) : Reliability of Wind turbines, Kassel (Germany), ISET, pp. 4;
[7] IRESON, W. G. – COOMBS, C. F. jr. (1988): Handbook of Reliability Engineering and Management,
New York, McGraw-Hill Ed., pp. 400;
[8] OZTURK, S. et Al. (2018) : Failure Modes, Effects and Criticality Analysis for Wind Turbines
Considering Climatic Regions and Comparing Geared and Direct Drive Wind Turbines, in Energies 2018,
11, 2317 ; doi : 10.3390/en11092317, pp. 18;
[9] SARANYASOONTORN, K. and Manuel, L. (2005): On Assessing the Accuracy of Offshore Wind
Turbine Reliability-based Design Loads from the Environmental Contorur Method, in Int. J. of Offshore
and Polar Engineering, Vol. 15, No. 2, June 2005, pp. 1-9;
[10] WILKINSON, M. et Al. (2011) : Measuring Wind Turbine Reliability – Results of the Reliawind
Project, Final Rep. Of the EU FP7 Project RELIAWIND 212966, pp. 8;
[11] WH – ABB (2011): Wind Energy Handbook n° 13, ABB, in library.e.abb.com, pp. 136.
18You can also read