Facing the Challenges - THE UNITED NATIONS WORLD WATER DEVELOPMENT REPORT 4 - Sustainable Sanitation and Water ...
←
→
Page content transcription
If your browser does not render page correctly, please read the page content below
Facing                           Report

the Challenges                            United Nations
                                          Educational, Scientific and
                                          Cultural Organization

—

THE UNITED NATIONS WORLD WATER
DEVELOPMENT REPORT 4
VOLUME 3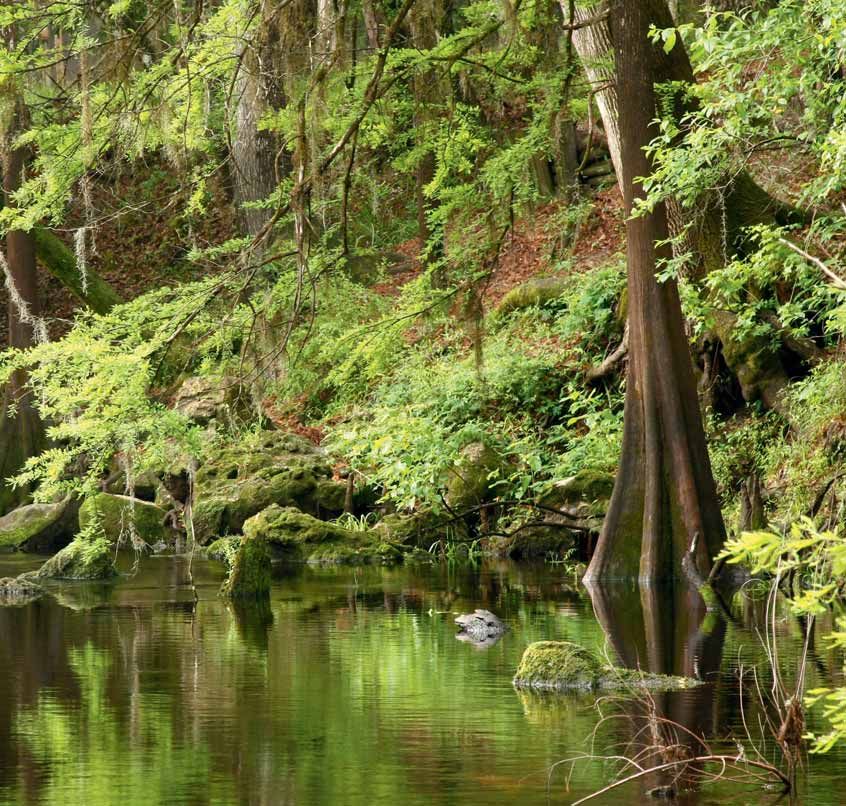
Facing
the Challenges
—

THE UNITED NATIONS WORLD WATER
DEVELOPMENT REPORT 4
VOLUME 3
Published in 2012 by the United Nations Educational,                       WWDR4 has been published on behalf of the United Nations World
Scientific and Cultural Organization                                       Water Assessment Programme (WWAP) with the support of the
7, place de Fontenoy, 75352 Paris 07 SP, France                            following organizations:

© UNESCO 2012                                                              United Nations Funds and Programmes
All rights reserved                                                        United Nations Children’s Fund (UNICEF)
                                                                           United Nations Conference on Trade and Development (UNCTAD)
Chapter 24, ‘Investing in water infrastructure, its operation and its      United Nations Department of Economic and Social Affairs
maintenance’, © The International Bank for Reconstruction and                (UNDESA)
Development/The World Bank                                                 United Nations Development Programme (UNDP)
1818 H Street, NW, Washington, DC 20433, USA                               United Nations Environment Programme (UNEP)
                                                                           United Nations High Commissioner for Refugees (UNHCR)
ISBN 978-92-3-104235-5                                                     United Nations Human Settlements Programme (UN-HABITAT)
e-book ISBN 978-92-3-001045-4                                              United Nations University (UNU)

Original title: The United Nations World Water Development                 Specialized UN Agencies
Report 4: Managing Water under Uncertainty and Risk (Vol. 1),              Food and Agriculture Organization of the United Nations (FAO)
Knowledge Base (Vol. 2) and Facing the Challenges (Vol. 3).                International Atomic Energy Agency (IAEA)
                                                                           International Bank for Reconstruction and Development
Published in 2012 by the United Nations Educational,                          (World Bank)
Scientific and Cultural Organization                                       International Fund for Agricultural Development (IFAD)
                                                                           International Labour Organization (ILO)
UNESCO Publishing: http://publishing.unesco.org/                           United Nations Educational, Scientific and Cultural Organization
                                                                              (UNESCO)
Suggested citation:                                                        United Nations Industrial Development Organization (UNIDO)
WWAP (World Water Assessment Programme). 2012. The United                  United Nations Institute for Training and Research (UNITAR)
Nations World Water Development Report 4: Managing Water under             World Health Organization (WHO)
Uncertainty and Risk. Paris, UNESCO.                                       World Meteorological Organization (WMO)
                                                                           World Tourism Organization (UNWTO)
The designations employed and the presentation of material
throughout this publication do not imply the expression of any             United Nations Regional Commissions
opinion whatsoever on the part of UNESCO concerning the legal              Economic and Social Commission for Asia and the Pacific
status of any country, territory, city or area or of its authorities, or     (UNESCAP)
concerning the delimitation of its frontiers or boundaries.                Economic and Social Commission for Western Asia (UNESCWA)
                                                                           Economic Commission for Africa (UNECA)
The ideas and opinions expressed in this publication are those of          Economic Commission for Europe (UNECE)
the authors; they are not necessarily those of UNESCO and do not           Economic Commission for Latin America and the Caribbean
commit the Organization.                                                     (UNECLAC)

—                                                                          Secretariats of United Nations Conventions and Decades
                                                                           Secretariat of the Convention to Combat Desertification (UNCCD)
The contents of Volume 2 were contributed by the UN-Water                  Secretariat of the Convention on Biological Diversity (CBD)
members and partners listed on the title pages of the chapters             Secretariat of the International Strategy for Disaster Reduction
therein. UNESCO and the United Nations World Water Assessment                (UNISDR)
Programme (WWAP) are not responsible for errors in the content             United Nations Climate Change Secretariat (UNFCCC)
provided or for discrepancies in data and content between
contributed chapters.

WWAP provided the opportunity for individuals to be listed as
authors and contributors or to be acknowledged in Volume 2.
WWAP is not responsible for any omissions in this regard.

—

Cover and interior design and typesetting by Phoenix Design Aid
A/S, an ISO 14001 (environmental management) and a DS 49001
(corporate social responsibility) certified and approved carbon
neutral company.

Printed by Imprimerie Centrale S. A. (Imprim’Vert certified) for
UNESCO CLD, Paris.

This publication is printed with vegetable inks on FSC Mixed Sources
paper, supporting responsible use of forest reserves. This is a carbon
neutral print product. Imprimerie Centrale will contribute funds to a
project replanting trees in Panama for this publication.

Printed in Luxembourg
TABLE OF CONTENTS

Foreword                                                                                     iii
by Olcay Ünver, Coordinator, United Nations World Water Assessment Programme

Summary                                                                                      iv
Case study development process and highlights of the findings

AFRICA

Chapter 37. Ghana                                                                           779
Chapter 38. Mara River basin, Kenya and Tanzania                                            786

ARAB STATES

Chapter 39. Jordan                                                                          792
Chapter 40. Morocco                                                                         798

ASIA AND THE PACIFIC

Chapter 41. Murray-Darling basin, Australia                                                 803
Chapter 42. Yellow River basin, China                                                       809
Chapter 43. Jeju Island, Korea                                                              814
Chapter 44. Pakistan, with special reference to the Indus River basin                       820

EUROPE AND NORTH AMERICA

Chapter 45. Czech Republic                                                                  826
Chapter 46. Marseille Provence Métropole Urban Community, France                            830
Chapter 47. Tiber River basin, Italy                                                        835
Chapter 48. Tagus River basin, Portugal                                                     842
Chapter 49. St Johns River basin, Florida, United States of America                         847

LATIN AMERICA AND THE CARIBBEAN

Chapter 50. Costa Rica                                                                     853
Chapter 51. Lerma-Chapala basin, Mexico                                                    860

Boxes, tables, figures and maps                                                            866

WWDR4                                                                          TABLE OF CONTENTS   i
“We can’t solve problems by using
      the same kind of thinking we used
      when we created them.”
     Albert Einstein

ii                              FACING THE CHALLENGES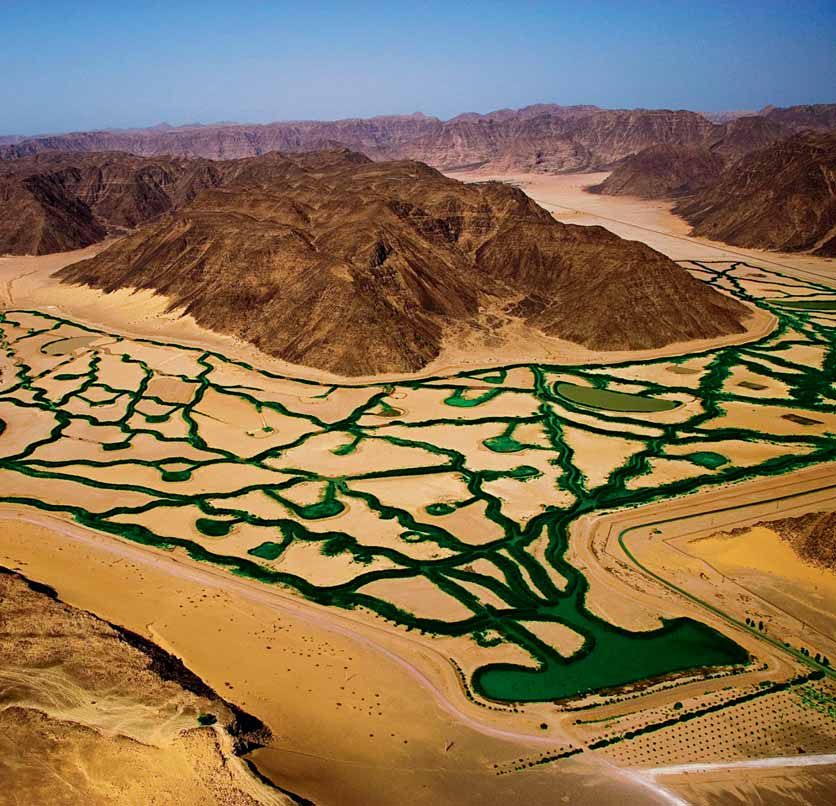
FOREWORD
        by Olcay Ünver, Coordinator, United Nations
        World Water Assessment Programme
        —

        From its first edition in 2003, the United Nations World Water Development Report
        (WWDR) has shown how decisions made in every realm of life and work can have
        an impact on our water resources. Rapidly changing conditions across the globe are
        creating new pressures on water, and introducing new uncertainties and risks for
        its use and management. The resilience of societies to cope with these challenges
        varies greatly, largely determined by their institutional and legal frameworks and the
        availability of financial and human resources.

        Case studies are a significant part of each WWDR. Collectively, they illustrate the
        challenges that confront policy-makers and water managers around the globe, and
        how they are responding to them. The present volume, Facing the Challenges, features
        concise summaries of fifteen case studies compiled over a period of three years,
        providing ‘snapshots’ of water management and use today in diverse regions of the
        world. These case studies, by design, closely complement the other volumes of the
        2012 World Water Development Report 4, as most of the factors influencing water
        resources management discussed in those volumes can be observed, in one form or
        another, in the pages presented here.

        Since the launch of the United Nations World Water Assessment Programme (WWAP)
        in 2000, the number of case studies has continuously risen. Overall, 58 regional
        studies at the basin or national level have been completed so far, through partnerships
        with national bodies worldwide. The mobilization of key stakeholders is also important
        to the development of case study projects. As we move forward, WWAP will continue
        working with national partners and other stakeholders to develop further case studies
        of water management and use in diverse countries and river basins, to achieve as wide
        a regional coverage as possible.

        This volume constitutes a valuable contribution to the international community. The
        experiences and policies it describes provide different perspectives for all those
        working towards sustainable development – not only water professionals, but
        managers and decision makers at all levels, and researchers from within or outside the
        ‘water box’1 – helping all to make informed decisions with better knowledge.

        Olcay Ünver
        Coordinator, United Nations World Water Assessment Programme

        ııııııııııııııııııııııııııııııııııııııııııııııııııııııııııııııııııııııııııııııııııııııııııııııııııııııııııııııııııııııı

        Note

        1   The concept of the ‘water box’ is used in the third edition of the World Water Development Report to
            describe the specific sphere (the ‘water sector’) to which questions of water management are too-often
            confined.

WWDR4                                                                                                              FOREWORD       iii
SUMMARY                    CHAPTER 37
     Case study development
                          Loremprocess
                                 ipsum dolor
                                       and
     highlights of the findings

                                                                                                                                      UNEP
                                                                                                —
                                                              Authors Xxxxxxxx Xxxxxxxxxxxx
     This fourth edition of the United Nations World WaterContributors Xxxxxxxx
                                                                    Eight        Xxxxxxxxxxxx
                                                                          of these pilot projects (See map below,
     Development Report (WWDR) features 15 case    Acknowledgements
                                                      studies       case
                                                                       Xxxxxxxx
                                                                         studies Xxxxxxxxxxxx
                                                                                 2, 5, 6, 10, 11, 12, 13 and 15) have been
     from different geographies of the world. For the first         conducted at the river basin level, while the others
     time, there are pilot studies from North America (St           showcase national efforts. Although the majority of the
     Johns River Basin, Florida, USA) and the Middle East           countries that participated in the development of these
     (Jordan). As with previous volumes of the WWDR,                case studies are new WWAP partners, five of them –
     the focus continues to be on the common challenges             China, France, Italy, Mexico and the Republic of Korea –
     that the countries and regions included are facing: the        have also contributed to earlier volumes of the WWDR.
     management and allocation of freshwater resources,             We would like to express our deep appreciation to all
     shortcomings in institutional and legal frameworks,            our country partners for their significant input.
     environmental degradation, declining water quality, and
     the risks posed by climatic variations and climate change.     This volume presents concise summaries of these
                                                                    15 case study reports, the original versions of which
     The regional distribution of case studies that are             represent approximately one thousand pages. The
     featured in this volume is shown in the map below.             amount of work that went into preparing the full

     Regional distribution of the case studies

                                                                                                9
                                                                                          10   11
                                                                                 12                                                    6
                                                                                                                                                                 PACIFIC
                                                                                                                                              7                   OCEAN
                                                                                                         3
                                               13                                                                     8
                                                                             4
                                   15
                                                        ATLANTIC
                                        14               OCEAN
                                                                                      1

                                                                                                          2

                         PACIFIC
                          OCEAN
                                                                                                                          INDIAN
                                                                                                                          OCEAN

                                                                                                                                                                       5

           AFRICA                ARAB STATES           ASIA and the PACIFIC                       EUROPE and NORTH AMERICA                     LATIN AMERICA and the CARIBBEAN
        1. Ghana              3. Jordan             5. Australia (Murray-Darling basin)         9. Czech Republic                            14. Costa Rica
        2. Kenya-Tanzania     4. Morocco            6. China (Yellow River basin)               10. France (Marseille Provence               15. Mexico (Lerma-Chapala basin)
        (Mara River basin)                          7. Korea (Jeju Island)                          Métropole Urban Community)
                                                    8. Pakistan (with special reference         11. Italy (Tiber River basin)                     Countries included in both Africa and Arab States
                                                       to the Indus River basin)                12. Portugal (Tagus River basin)                  Regions of UNESCO
                                                                                                13. United States of America                      Countries included in both Europe/North America
                                                                                                    (St Johns River basin, Florida)               and Asia/Pacific Regions of UNESCO

iv                                                                                                                                                             FACING THE CHALLENGES
case study reports and their concise summaries is            the flow of the river throughout its course, and
noteworthy: on average each report went through two          especially to its lower reaches. The government
iterations to ensure the quality of the final studies.       of Pakistan is working to reform irrigation water
                                                             management in the Indus River basin, and in the
The areas covered by the case studies vary greatly. In       St Johns River basin (Florida, USA) the Watershed
this edition, Jeju Island, Korea is the smallest in size     Restoration Act has helped control problems of
(approximately 1,850 km2) whereas the Yellow River           pollution. The 2000 EU Water Framework Directive
basin, China (approximately 795,000 km2) and the             is being implemented by all European nations, with
Murray–Darling River basin, Australia (more than a           different countries currently at different stages of
million km2) are the two largest.                            completing its requirements.

The concise summaries provide a snapshot of reality.         Climate change and climatic variations are likely to
They present the current situation of water resources        pose challenges of varying degree and intensity.
and their use in each area covered through a common          While several models suggest likely scenarios,
framework that includes the state of the resource,           some countries have already started experiencing
how water resources are utilized, competition among          the effects of climate change in the shape of more
sectors, legal and administrative frameworks, the            frequent and intense water-related natural disasters
status of ecosystems, impacts of climate change              (e.g. floods, droughts, mudslides, tornados).
and climatic variations, water related disasters, and        Almost all of our case study partners reported
more. Boxes highlight important recent events (the           increasing variability in the occurrence of such
catastrophic flood in Pakistan, the recent drought in        events. All of these countries, without exception,
the Murray–Darling basin), key water-related projects        have mechanisms and legislations in place for
(ecosystem conservation efforts in Jordan, sediment          disaster mitigation, however, their institutional and
load reduction in the Yellow River basin, attempts           financial capacity to respond when such disasters
to introduce payment for ecosystem services in the           strike are closely linked to their level of economic
Mara River basin) and the structure and functioning          development.
of river basin organizations (the Lerma–Chapala Basin
Council in Mexico, river basin district administrations in   Cooperation among riparian countries in the
Portugal).                                                   context of international water resources is critical
                                                             for the sharing and protection of scarce water
Regardless of a country’s level of development, water        resources in an era of increasing climatic variability
resources management and protection are areas                and climate change. Jordan and Israel reached
where constant improvement is sought. Australia has          an agreement on water rights in the Jordan River
produced a blueprint for water reform in its 2004            basin in their 1994 peace treaty. In the case of Spain
National Water Initiative, while on Jeju Island (Republic    and Portugal, the Albufeira Convention applies to
of Korea) there is a clear understanding of the              several transboundary rivers and covers issues such
importance of integrated water resource management           as the exchange of information, pollution control
for effective planning. Strict control of water allocation   and prevention, the evaluation of the transboundary
at the district level in the Yellow River basin ensures      impacts of water uses, and conflict resolution and

WWDR4                                                                                                      SUMMARY    v
the assignment of rights. The Convention allows            The case studies reveal that approaches towards
     for future revisions to ensure the achievement of          sustainable utilization of water resources are evolving
     environmental objectives set at basin level and to         in the direction of integrated water resources
     integrate climate change adaptation measures.              management (IWRM). The need to integrate surface
     Cooperation is vital for shared water resources in the     water and groundwater resources within basins and to
     national context, too. The Yellow River basin crosses      balance competing sectoral interests with the needs
     nine provinces of China, however the 1987 Water            of ecosystems are increasingly accepted at all levels
     Allocation Scheme and 2006 ordinance have created          of governance. However, considerable progress is
     the basis for regulating water use to satisfy demand in    necessary to make the IWRM approach a mainstream
     all provinces and improve environmental conditions,        objective at the global level. The same observation
     especially in the lower reaches of the basin.              applies to the attainment of the Millennium
                                                                Development Goals (MDGs), for which there are
     Water and food security are among the most                 blatant regional disparities.
     important issues of concern not only in arid regions,
     such as Jordan and Morocco, but also in regions            The case studies clearly highlight the diversity of
     that are well endowed in terms of water resources.         circumstances, challenges and priorities facing
     In Ghana, for example, the absence of adequate             different regions. Consequently, efforts towards
     storage and agro-processing facilities leads to losses     attaining wider coverage will continue in subsequent
     of perishable crops. Overall, increasing demographic       editions of the WWDR, as additional case study
     pressures and climatic variations, such as floods and      partners are sought.
     droughts, that affect crop yields are other drivers that
     diminish food security.

vi                                                                                                  FACING THE CHALLENGES
CHAPTER 37
                            Ghana

                            —
                            Acknowledgements Kodwo Andah, Ben Ampomah,
                            Christine Young Adjei, Winston Ekow Andah

© Shutterstock/Steve Heap
Location and general characteristics in the extreme north. The highest annual rainfall is
The Republic of Ghana (Ghana from here on) is located 2,150 mm in the extreme south-west of the country,
in West Africa. It is bounded to the north by Burkina and this reduces progressively to a low of 800 mm in
Faso, to the east by Togo, to the west by Côte d’Ivoire the south-east and about 1,000 mm in the north-east.
and to the south by the Gulf of Guinea and the Atlantic Disparity in the geographical and seasonal distribution
Ocean (Map 37.1). The country extends over an area of of precipitation causes water stress at the local and
238,540 km2, and it has 24.3 million inhabitants (2010). regional levels. For example, even in the high rainfall belt
The national capital, Accra, is home to about 2 million in the south and west, water scarcity in the dry season
people (2009). can last three to five months. In the northern and the
south-eastern regions, where rainfall is the lowest, the dry
The topography consists mainly of rolling plains, season continues over eight to nine months.
escarpments and low hill ranges. The highest
elevation in Ghana, Mount Afadjato in the Akwapim– Ghana has a relatively diverse and rich natural resource
Togo Ranges, rises 880 m above sea level. Ghana base – principally gold, diamonds, manganese ore, and
has a warm, humid tropical climate. Mean annual bauxite. Gold and cocoa are Ghana’s top two exports,
temperatures range from 26°C near the coast to 29°C and the country has been an oil exporter since 2010.
MAP 37.1
Ghana
B U R K I N A F A S O
Bolgatanga
Kol p a
wn
B E N I N
Blac k Volta
Wa
ta
Vol
ite
h
Basin
W
Tamale
Ramsar site
a
T O G O
ak
Hydroelectric
Oti
D
power plant CÔTE olta
Black V
National park D'IVOIRE
City
ru
P
International boundary
Tai n
Sunyani
Afr Lake
a
Volta
m
Kumasi Ho
Bia
Lake
Bosumtwi
A nu
m
ri
Keta
Tano
Volt
Bi
m
a Lagoon
Koforidua
Ankobra
Pra
Accra
GULF
OF GUI NEA
Cape Coast
A TLANTIC Sekondi-Takoradi
0 25 50 75 100 km
OCEAN
780 CHAPTER 37 AFRICAWater resources availability, their use recharge. Groundwater abstraction is projected to
and management increase by approximately 70% in order to meet the
Ghana is drained by three main river systems. These water demand in 2020.
are the Volta, South-Western and Coastal river systems,
which respectively cover 70%, 22% and 8% of the Since the beginning of the 1980s, the Government
country. The Volta river system consists of the Oti and of Ghana has introduced a number of policy reforms
Daka rivers, the White and Black Volta, and the Pru, that were specially intended to improve efficiency
Sene and Afram rivers. The south-western river system in rural, urban and irrigation water use as well as to
comprises the Bia, Tano, Ankobra and Pra rivers. The attain measures of environmental protection and
coastal river system includes the Ochi-Nakwa, Ochi conservation. The key problem was the absence of
Amissah, Ayensu, Densu and Tordzie rivers. The a holistic water policy that included all aspects of
total annual runoff from all the rivers combined is water resources management. The Water Resources
56.5 billion m3 of water, of which 40 billion m3 is Commission, which was established in 1996 to regulate
accounted for by the Volta River. Approximately 40% and manage the use of freshwater resources and to
of total water resources availability originates outside coordinate policies in relation to them, responded to
Ghana’s territory. this challenge by introducing the draft Water Policy in
2002. A wider consultative process was initiated later
The only significant natural freshwater lake is Lake in 2004 to incorporate policies that were specific to
Bosumtwi, which has a surface area of 50 km2, and a water supply and sanitation services. The draft Policy
depth of 78 m. Lake Volta, which is the reservoir of the was further enhanced through integration of the
Akosombo Dam, is one of the world’s largest artificial principles of environmental assessment to promote
lakes, and it covers an area of 8,500 km2. the sustainability of natural resources. In 2007, the
National Water Policy – which took an integrated
In 2000, total water withdrawal was approximately water resources management approach as one of its
980 million m3. Of this, about 652 million m3 (66%) core principles – was approved. The policy recognizes
was used for irrigation and raising livestock, the various cross-sectoral issues related to water
235 million m3 (24%) was used for water supply and use, and the links to other relevant sectoral policies
sanitation, and 95 million m3 (10%) was used by such as those on sanitation, agriculture, transport
industry. Non-consumptive water use for generating and energy (MWRWH, 2007). This holistic approach
hydroelectricity (only at the Akosombo Dam), is makes the water policy complementary to the national
around 38 billion m3 per year (FAO-Aquastat, n.d.). Poverty Reduction Strategy and the ‘Africa Water
The consumptive water demand for 2020 is projected Vision’ put forward by the New Partnership for Africa’s
to reach 5 billion m3. Development (NEPAD).
Agriculture forms the most important segment of In terms of institutional framework, water sector
the economy (Box 37.1), accounting for about 30% reforms that started in the 1990s led to the
of gross domestic product (GDP) and about 55% establishment of Ghana's Environmental Protection
of formal employment. Industry, including mining, Agency in 1994, and the Water Resources Commission
manufacturing, construction and electricity generation, in 1996. The Public Utilities Regulatory Commission
accounts for about 20% of GDP. The services sector was launched in 1997 to regulate and oversee the
has been growing fast, and now generates half of provision of utilities. Ghana Water Company Limited
national GDP (2010). Poverty rates in the country are was set up in 1998 to provide water supply to urban
not evenly dispersed. areas. The same year, the Community Water and
Sanitation Agency was established to administer rural
While Ghana has over 50,000 boreholes and hand- water supplies.
dug wells, the country’s groundwater resources are
not well studied. However, annual renewable capacity Climate change, water-related disasters and
is estimated to be around 26 billion m3 (2005). In the risk management
Volta basin, annual groundwater use is approximately Ghana often experiences floods and droughts,
90 million m3. Measurements in other basins similarly particularly in the northern Savannah belt. The country
showed that actual use is well below groundwater faced widespread floods in 1962 and 1963. Then
WWDR4 GHANA 781BOX 37.1
Agriculture and food security
In Ghana, overall sustained economic and agricultural growth has been accompanied by rapid poverty reduction. Growth has
created a vibrant market for local farmers, and higher incomes have reduced poverty and led to increases in food demand.
Thanks to economic reforms that began in 1983, Ghana was able to turn its agriculture sector around. A stable economy,
market liberalization, and improved infrastructure have restored incentives to farm, which has both benefited small farmers
and encouraged some large-scale investment in cash crops such as pineapples and palm oil. After 1983, agriculture grew at
an average annual rate of 5.1%. Food supply has been growing faster than the population growth rate, making Ghana largely
self-sufficient in terms of staples. At the same time, food prices have fallen. More accessible food helped to lower the rate
of undernourishment from 34% in 1991 down to 8% by 2003. Child malnutrition also declined, with the proportion of under-
weight infants falling from 30% in 1988 to 17% in 2008. The proportion of the population living in poverty fell from 52% in 1991
to 28.5% in 2006, with rural poverty falling from 64% to 40% over the same period. The most recent estimates suggest that
only 10% of the urban population lives below the poverty line (IFAD, n.d.). Overall, Ghana is on track to achieve the Millennium
Development Goal of halving poverty and hunger (MDG 1).
However, in spite of these developments, food security is not in place in Ghana. Of 19,000 km2 of potentially irrigable land,
only 338 km2 is irrigated (2007). In addition, the rehabilitation of many of the irrigation schemes is long overdue. Another
challenge facing Ghana is losses in perishable crops as a result of the absence of adequate storage and agro-processing fa-
cilities. Climatic variations, such as floods and droughts that affect the crop yield, and a rapidly growing population also have
a negative impact on food security.
Source: FAO-Aquastat (n.d.).
between 1991 and 2008, there were six major floods. reductions of between 30% and 40% were observed
The 1991 flood affected approximately 2 million for simulations using climate change scenarios for
people and the catastrophic floods in the north in 2050. The simulations predicted that the reduction in
2007 affected more than 325,000 Ghanaians, with groundwater recharge would be between 5% and 22%
close to 100,000 requiring assistance to restore by 2020, and between 30% and 40% by 2050. The
their livelihoods (UN-ISDR/WB, 2009). In 2011, there maize yield was predicted to decrease by about 7%
were many floods across the country, especially in in 2020. It was found that millet yield would probably
the eastern and northern regions. Scientific studies not be affected because it is more tolerant of higher
suggest that the periodicity of 5.6 years is highly temperatures.
significant for flood occurrence. At the opposite end
of the spectrum, Ghana also experienced significant It was found too that irrigation water demand could
droughts in 1977, 1983 and 1992. In fact, the 2007 be affected considerably by climate change. The
flood was followed immediately by a period of simulations revealed that in the humid part of the
drought that damaged the initial maize harvest. The country, the increase in irrigation water demand could
economic impact of water-related disasters at the range from about 40% (2020) and 150% (2050) of
national and regional levels is not well documented. the base period water demand. For the dry interior
Savannah, the corresponding increase in irrigation
With international support, Ghana developed national water demand in 2020 and 2050 could be about
climate change scenarios and climate change 150% and 1200% respectively. Hydropower generation
vulnerability assessment studies for water resources could also be seriously affected by climate change.
and the coastal zone. Major findings were that over The projected reduction of the amount of electricity
a 30-year period from 1961 to 1990, temperatures generated by 2020 can be about 60%. In the coastal
rose by about 1°C, rainfall was reduced by 20%, and zone, over 1,000 km2 of land may be lost due to
stream flows dropped by 30%. Flow reductions of sea level rise, which could be as high as one metre.
between 15% and 20% were observed for simulations Consequently, over 130,000 residents living along
using climate change scenarios for 2020; and the east coast are considered to be at risk. Important
782 CHAPTER 37 AFRICAwetlands, especially in the Volta Delta, may be lost problem that claims the lives of approximately 20,000
as a result of land erosion and inundation. Increased children every year. The annual economic burden of
water depths and the salinization of lagoons as a malaria is estimated 1% to 2% of GDP (UNICEF, n.d.b).
result of sea level rise could have a negative impact Other communicable diseases such as cholera and
on the feeding of migratory and local birds. yellow fever are also widespread in Ghana and cause
epidemics from time to time. As a combined result of
Confronted with water-related and other natural these problems, life expectancy is about 58 years.
hazards, the Government of Ghana, with the help
of donor support, is in the process of developing It is estimated that 51.5% of the population lives
strategies and strengthening its institutional capacity in urban settlements, and in 2007, approximately
in disaster risk management. Disaster risk reduction is 5 million people were living in slums with limited or
the responsibility of the National Disaster Management no water supply (UN-HABITAT, 2008). This led to the
Organization (NADMO), established in the Ministry emergence of water vendors to service such deprived
of the Interior. NADMO functions under a national areas, who are now grouped under the Private Water
secretariat and comprises a network of ten regional Tanker Owners Association. Unfortunately, those
secretariats, 168 district/municipal secretariats who rely on water tankers usually pay more than ten
and 900 local offices. Since its inception under times the official rate for piped water and end up
parliamentary Act 517 in 1996, NADMO has contributed spending over 10% of their income on potable water.
considerably to disaster management across the To improve the situation, a Water Sector Rehabilitation
country. However, its activities and response capacity Project was initiated in 1992. Furthermore, the
on the ground are constrained by a lack of adequate Water Sector Restructuring Programme (2003–
funding (NADMO, 2011). The 1997 National Disaster 2009) was implemented to improve the provision of
Management Plan was revised in 2009 along with water by building new production and transmission
a parliamentary amendment to Act 517. In order to facilities and rehabilitating the existing ones in
accomplish its objectives, NADMO has set up technical urban areas. Consequently, water production by
sub-committees to cover all types of disasters Ghana Water Company Limited increased steadily
including geological and hydro-meteorological events, from 205.2 million m3 to 231.77 million m3 between
pest and insect infestations, bushfires and lightning, 2003 and 2009. Since 2006, it has carried out major
disease outbreaks and epidemics. expansion and rehabilitation works on a number of
urban water supply systems throughout the country.
Water and health It must be noted that the unaccounted for water (i.e.
Even though 90% of people in urban areas have access non-revenue water) in the water supply network is still
to safe drinking water, only about 32% had home around 50% (MWRWH, 2009).
connections in 2008 – compared to about 40% in
2000. This drop in coverage is because infrastructural Environment and ecosystems
development is falling behind the rate of population There is a lack of information on the wealth of
growth and urbanization. The coverage in rural areas in Ghana’s biodiversity. So far, about 2,974 indigenous
2008 was 60%. plant species, 504 fish species, 728 bird species,
225 different types of mammals, and 221 species of
The portion of population that has access to improved amphibians and reptiles have been recorded. Some
sanitation facilities is very low. In 2008, it was only 18% 16% of Ghana’s land has been designated as forest
in urban areas and 7% in rural areas (UNICEF, n.d.a). reserve, national park or other wildlife reserve. Five
Close to 40% of all public schools have no access to wetland areas – the Densu Delta, the Songor, the
safe drinking water; and about 50% of public schools Keta Lagoon Complex, the Muni-Pomadze coastal
have no toilet facilities (2011). As a result, water- wetlands and the Sakumo Lagoon – are Ramsar sites
related diseases, such as malaria, schistosomiasis, of international importance. Other wetlands located
guinea worm and lymphatic filariasis are common. in the forest and wildlife reserves of the Mole National
According to the World Malaria Report (WHO, 2009) Park, the Black Volta, the Sene, the Bia and the Owabi
there were 3.2 million reported malaria cases in 2008. Wildlife Sanctuaries are also protected (FAO-Aquastat,
Of those cases, approximately 1 million affected n.d.). Despite these efforts, increasing pressure from
children under the age of five. Malaria is a nationwide agricultural expansion, mining, timber extraction and
WWDR4 GHANA 783other socio-economic factors have had a negative in the supply of electricity caused by droughts will
impact on the environment and the ecosystems. It stabilize.
is estimated that the country is experiencing a rapid
deforestation at about 220 km2 per year. In economic Conclusions
terms, the loss of biodiversity through deforestation Ghana is well endowed with freshwater resources.
and land degradation is estimated to cost about However, disparity in distribution causes water stress,
US$1.2 billion annually (Agyemang, 2011). This is which is further worsened by the uncertainties posed
partially the result of uncoordinated implementation by climate change, climatic variation, rapid population
of sectoral socio-economic development policies. growth, environmental degradation and pollution.
The situation warrants urgent action if further Thanks to continuous economic growth, the country
environmental degradation is to be averted (Ministry is on track to meet the Millennium Development Goal
of Environment and Science, 2002). (MDG) on eradicating extreme poverty and hunger.
However, roughly 40% of rural dwellers remain poor.
Even though industrial water demand accounts for One of the most critical challenges facing the country
around 10% of annual water use, industrial activities is very poor access to improved sanitation facilities.
are the main source of pollution. This adds to water Combined with a less than ideal water supply network,
stress and impairs the health of society. Mining is the diseases such as malaria, cholera and yellow fever are
industrial activity that contributes most to pollution. widespread, causing significant numbers of casualties.
The 2008 report of Ghana's Commission for Human Food security is another concern that leaves the
Rights and Administrative Justice stressed that 82 country at the mercy of climatic variations and makes
rivers and streams in five mining communities in it dependent on imported food to feed its growing
Ghana had either been polluted, destroyed, diverted population. Increasing the amount of cultivated land
or dried-up as a result of mining companies. In (both rainfed and irrigated), improving the irrigation
its 2010 evaluation report, Ghana's Environmental infrastructure and developing the agro-industry are
Protection Agency concluded that mining companies’ crucial issues that require both national investment
observation of environmental standards is poor. and international donor support. Mining activities,
This is caused by environmental laws that are not while creating considerable amount of income, are
sufficiently strict on pollution prevention. The major among the main causes of water quality degradation.
concern lies not with the big mining firms, whose Strengthening environmental protection laws and
activities are easy to monitor, but with illegal small- enforcing them requires urgent action. Inadequate and
scale miners whose activities are neither registered unreliable data on water resources and their use is the
nor monitored. major roadblock to sustainable development.
Water and energy
ıııııııııııııııııııııııııııııııııııııııııııııııııııııııııııııııııııııııııııı
Ghana has one of the highest rates of electrification
in Africa. Access to electricity in urban areas is
close to 70%, and almost 30% of rural households References
are connected. On average, access to electricity in
Ghana is about 60% (IEA, 2009). There are two main Except where otherwise noted, information in this
large dams in operation in Ghana with a combined concise summary is adapted from the Case Study
hydropower generation capacity of 1,072 MW: the Report of Ghana prepared in 2011 by Kodwoh Andah
Akosombo Dam (134 m high) and the Kpong Dam (unpublished).
(29 m high). These plants harness approximately
58% of the country’s 10,600 GWh/year hydropower Agyemang, I. 2011. Analysis of the socio-economic and
cultural implications of environmental degradation in
potential. The construction of the 400 MW Bui Northern Ghana using qualitative approach. African
hydropower plant on the Black Volta began in 2005 Journal of History and Culture, Vol. 3, No. 7, pp. 113–22.
and is expected to commence energy production www.academicjournals.org/ajhc/PDF/pdf2011/Aug/
towards the end of 2012. Sites for a further 17 Agyemang.pdf
potential hydroelectric power plants have been FAO-Aquastat. n.d. Ghana Country Profile. Rome, FAO. http://
identified, and feasibility studies have been carried www.fao.org/nr/water/aquastat/countries_regions/ghana/
index.stm. (Accessed 14 December 2011.)
out. Once these projects are phased in, fluctuations
784 CHAPTER 37 AFRICAIEA (International Energy Agency) 2010. 2009. The Electricity UN-HABITAT (United Nations Agency for Human Settlement).
Access Debate. Paris, IEA. http://www.worldenergyoutlook. 2008. State of the World’s Cities 2010/2011: Bridging
org/database_electricity10/electricity_database_ the Urban Divide. London/Nairobi, Earthscan/UN-
web_2010.htm. HABITAT. http://www.unhabitat.org/pmss/listItemDetails.
aspx?publicationID=2917
IFAD (International Fund for Agricultural Development). n.d.
Rural Poverty Portal, Rural poverty in Ghana. Rome, IFAD. UNICEF (United Nations Children’s Fund). n.d.a. At a Glance:
http://www.ruralpovertyportal.org/web/guest/country/ Ghana, Statistics. New York, UNICEF. http://www.unicef.
home/tags/ghana. (Accessed 15 December 2011. org/infobycountry/ghana_statistics.html (Accessed 14
December 2011.)
Ministry of Environment and Science, Ghana. 2002. National
Biodiversity Strategy for Ghana. Accra, Ministry of ––––. n.d.b. Ghana Fact Sheet, July 2007. Accra, UNICEF
Environment and Science. http://www.cbd.int/doc/world/ http://www.unicef.org/wcaro/WCARO_Ghana_Factsheet_
gh/gh-nbsap-01-en.pdf malaria.pdf
MWRWH (Ministry of Water Resources, Works and Housing, UN-ISDR/WB (International Strategy for Disaster Reduction/
Ghana). 2007. National Water Policy. Accra, Ministry of World Bank). 2009. Disaster Risk Management Programs
Water Resources, Works and Housing. www.water-mwrwh. for Priority Countries: Summary, 2009. Geneva/
com/WaterPolicy.pdf Washington DC, UNISDR/World Bank. www.unisdr.org/files
/14757_6thCGCountryProgramSummaries1.pdf
––––. 2009. Ghana Water and Sanitation Sector
Performance Report. Accra, MWRWH. wsmp.org/ WHO (World Health Organization). 2009. World Malaria
downloads/4d8ca15ec1a12.pdf Report 2009: 31 High-Burden Countries. Geneva, WHO.
http://www.who.int/entity/malaria/world_malaria_
NADMO (National Disaster Management Organization). 2011.
report_2009/all_mal2009_profiles.pdf.
Ghana National Progress Report on the Implementation
of the Hyogo Framework for Action (2009–2011).
Geneva, PreventionWeb. http://www.preventionweb.net/
files/15600_gha_NationalHFAprogress_2009-11.pdf
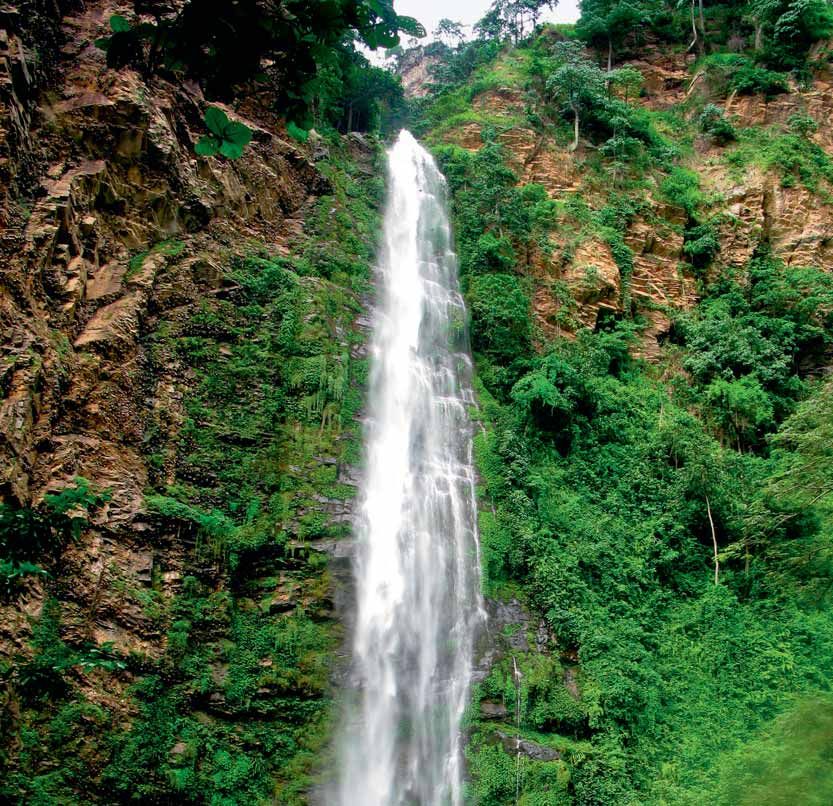
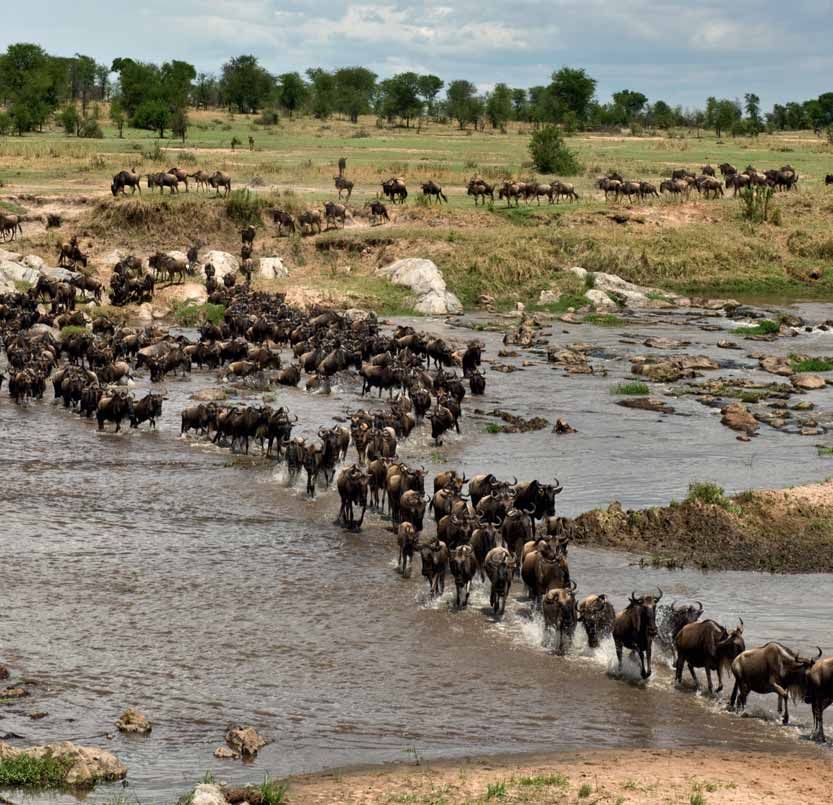
WWDR4 GHANA 785CHAPTER 38
Mara River Basin,
Kenya and Tanzania
—
Acknowledgements Nathan Karres,
Iman Yazdani, Maria C. Donoso, Michael McClain
© Shutterstock/Eric IsseléeLocation and general characteristics Water resources and their use
The Amala and Nyangores rivers originate in Kenya’s As a result of insufficient data, there are only rough
Mau Forest and converge to form the Mara River estimates of the water potential of the Mara River.
(Map 38.1). Other tributaries, the Engare, Talek and The lower estimate is approximately 475 million m3
Sand also flow into the Mara to form the transboundary per year, which only takes into account the flow rates
Mara River basin. of its two main perennial tributaries, the Amala and
the Nyangores. A higher, and probably more accurate
The Mara River is about 400 km long and drains into estimate based on data from more of the tributaries and
Lake Victoria in Tanzania, which makes the river part a gauging station, is around 950 million m3 per year. The
of the larger Nile basin. The Mara River basin covers total annual water demand in the Mara River basin is
an area of approximately 13,750 km2, of which 65% is approximately 23.8 million m3 per year (2006). Irrigated
located in Kenya and 35% in Tanzania. The amount of agriculture is the major user of water throughout the
annual rainfall in the basin varies from 1,400 mm in the basin followed by domestic consumption and livestock
hills of the Mau Forest to 500–700 mm in the dry plains production (Table 38.1).
of north-west Tanzania.
Approximately 840,000 people live in the basin (2010) TABLE 38.1
– the majority of whom are have settled in rural areas. Water use in the Mara River basin (2006)
The Kenyan part of the basin is home to 558,000 and
the remaining 282,000 inhabitants live in the Tanzanian Use Water demand (m3/year)
portion of the basin. According to projections, by 2030, Large-scale irrigation 12,323,400
the overall population in the basin could almost double
Domestic 4,820,336
to as much as 1.35 million.
Livestock production 4,054,566
Poverty is a major concern in the basin. In Kenya, nearly Wildlife 1,836,711
half of the basin’s population lives below the poverty
Mining 624,807
line1. On the Tanzanian side, the rate of poverty is
around 40%. In general, those living in the basin earn Tourism 152,634
their living from growing food crops (36.1%), cash crops Total 23,812,454
(9.6%), livestock production (5.9%), fishing (9.5%) and
business enterprises (11.4%).
MAP 38.1
Mara River basin
es
r
go
Lake
an
Ny
Victoria Thimjope a la
Am
a e
KENYA
ar g ar
M En
Ronda
Basin
Masai Mara Tale Naro
k
Wetlands Mara National Reserve Sura
Musoma Mara
Sand
National park Serengeti
Ngoreme National Park
City
0 25 50 km
International boundary TANZANIA
WWDR4 MARA RIVER BASIN, KENYA AND TANZANIA 787While water use is significantly less than the basin’s of these resources in the wider ecosystem and
potential, the intra-annual variability in supply and deteriorating community livelihoods ...
poor and outdated agronomic practices, lead to
problems meeting the demand. Furthermore, the All these issues point to a need for an integrated
frequency of water shortages and their severity is transboundary strategic planning approach to
likely to increase in parallel with the expansion of biodiversity conservation and water resources
irrigated land in the basin. Presently, 51% of the water management in the basin.
demand is linked to a few big farms in Kenya. These
farms produce mainly maize, beans, gum trees and Protecting the environment and ecosystems is
wheat. essential for ensuring the sustainable development
of both nations. Consequently, Florida International
Biodiversity, tourism and the potential University within the framework of the Global Water
impact of climate change for Sustainability (GLOWS) programme conducted an
Within the basin, there are important habitats that environmental flow assessment in three pilot sites in
support the region’s vibrant biodiversity. Among the basin. The study concluded that in the years when
the most important of these are the Mau Forest, the precipitation is normal (compared to the long-term
Mara Swamp and the Mara–Serengeti eco-region, average of mean annual rainfall), sufficient water
which is a UNESCO World Heritage Site. The Mara– exists to satisfy the needs of the human population
Serengeti alone contains over 90 mammals and more and nature. However, during periods of drought,
than 450 bird species. There have been conservation especially in the upper and middle reaches of the
programmes in the basin implemented by the Kenyan river, natural flow is well below the threshold required
and Tanzanian governments as well as regional and to meet the established reserve for environmental
international institutions. However, despite these needs. This means that no water can be allocated for
efforts, the condition of the habitats continues to other uses (domestic, industrial, tourism, agriculture,
decline. For example, over the past few decades, the etc.) and it is necessary to construct reservoirs to
Mau Forest has been reduced by 23% as a result of meet these demands. While the study is limited in
forest clearing for tea plantations, farming and timber scale, it clearly demonstrates the vulnerability of both
harvesting. Even though there are laws protecting the the human and the wildlife populations in the basin.
buffer zones, the corridor of riverine forest along the
Mara River has been greatly degraded by grazing and Climate change can complicate matters further.
cultivation in both Kenya and Tanzania. Scenarios predict that the flow in the Upper Mara
River may decrease significantly as a result of
Socio-economic demands such as a growing tourism increased ambient temperature and less rainfall. This
sector are adding to the problem. The number of can have a serious impact on both human livelihoods
tourists visiting the Masai Mara National Reserve in and ecosystems. In fact, the importance of the Mara
Kenya and the Serengeti National Park in Tanzania River is that it is the main source of water for the
rose from approximately 190,000 in the 1990s to over migrating animals of the Mara–Serengeti eco-region,
600,000 in the early 2000s. The growing concerns especially during the dry season. Statistical analysis
are clearly highlighted in the management plan of the of rainfall data reveals that droughts are likely to
Masai Mara National Reserve, which states: occur every seven years in the basin. Depending on
the severity of the conditions, 20% to 80% of the
The Reserve is faced by unprecedented challenges. migrating wildebeest may die. With a 50% die-off
Inside the Reserve, escalating pressures from rate, it will take approximately 20 years for the animal
tourism development and growing visitor population to recover, while with an 80% die-off rate,
numbers … are leading to a ... deterioration of the there may be no population recovery at all. Such
natural habitats on which the Reserve’s tourism ecologically disastrous conditions would have severe
product is based ... Outside the Reserve, there repercussions for tourism in the Mara River basin
is growing pressure from local communities to as well, which in turn would affect the Kenyan and
use the Reserve’s pastures and water sources for Tanzanian economies. The climate change scenarios
livestock, because of the diminishing supplies also predict an increase in periods of intense rainfall
788 CHAPTER 38 AFRICAwhich would result in an increased erosion and a drop water from water points that are between 1 km and
in water quality caused by higher sediment content 5 km away. Only 36% of households in Bomet reported
in the river. The best management practices that are any form of water treatment prior to consumption. As
proposed as a part of the ‘Payment for Ecosystem a consequence of over-reliance on unprotected water
Services (PES)’ schemes (Box 38.1) include preserving sources and poor hygiene practices, rates of diarrheal
riparian buffers, reinforcing river banks by planting disease and intestinal worms are very high in both
trees and decreasing grazing as potential remedies to districts. Unfortunately, the unfavourable conditions
alleviate erosion problem. described above are similar on the Tanzanian side of
the basin.
Water and health
A large percentage of the population in the Mara River Water resources management and
basin does not have access to a safe drinking water regulations
supply or adequate sanitation facilities (Table 38.2 and Kenya’s most recent constitution, adopted in August
Table 38.3). Surveys conducted in the Trans Mara and 2010, sets the foundation for the sustainable use
Bomet districts of Kenya’s Rift Valley Province revealed and efficient management of natural resources. It
the lack of sewer infrastructure, with pit latrines being articulates the obligations that the individual and
the only faecal disposal method available to the the state have to the environment. Moreover, it also
population. In general, the majority did not have any enables the formation of a National Land Commission
knowledge of basic sanitation or hygiene. which, among its other duties, has supervisory
responsibility for land use planning throughout
In Bomet, approximately 56% of households draw Kenya. The new constitution mandates the
their drinking water from the Mara River during the decentralization of government, allowing for effective
dry season and 46% of households are forced to fetch governance at the district or basin level.
TABLE 38.2
Rate of access to water resources in the Mara River basin
Piped Rain Pond/dam/
water Spring/well harvesting River/stream lake Other
(%) (%) (%) (%) (%) (%)
Kenya:
22.8 36.3 1.2 29.3 4.7 5.5
Rift Valley Province*
Tanzania:
14.2 63.2 - 6.6 15.6 -
Mara Region
*The Mara River basin lies within the southern section of the Rift Valley Province
TABLE 38.3
Rate of access to sanitation facilities in the Mara River basin
Conventional No latrine (i.e.
sewerage Pit latrine Septic tank open defecation) Other
(%) (%) (%) (%) (%)
Kenya:
3.3 73.3 2.2 20.7 0.4
Rift Valley Province*
Tanzania:
1.9 77.6 - 20.3 -
Mara Region
*The Mara River basin lies within the southern section of the Rift Valley Province
WWDR4 MARA RIVER BASIN, KENYA AND TANZANIA 789Kenya Vision 2030 (formulated in 2007) and the All these underpin the conservation of biodiversity and
Water Act (2002) constitute the main elements of the the regulation of water resources in the country.
country’s national water policy. Kenya Vision defines
the goals and strategies of the country between 2007 Vision 2025 is Tanzania’s national development
and 2030 with particular attention to compensation for blueprint. It projects fast growth while effectively
environmental services and the provision of incentives reversing current adverse trends in environmental
for environmental compliance. The Water Act allows for resources such as forests, fisheries, biodiversity as well
the establishment of the Water Resources Management as fresh water and land resources. Universal access to
Authority, which has a mandate to manage and safe water is also a part of Vision 2025. The National
protect river basins. It also encourages communities to Water Policy promotes decentralizing water resource
participate in water management at the basin level and management through integrated water resources
aims to ensure that sufficient and good-quality water management, involving water user associations and
is available to satisfy basic human needs and to protect the private sector in decision making, ensuring the
ecosystems. The 1999 Environment Management and sustainable use of water resources through economic
Coordination Act and the 2009 National Land Policy incentives such as appropriate pricing mechanisms,
also play a part in water and biodiversity conservation and establishing institutions such as the National Water
in Kenya. Board, the Basin Water Boards and Basin and Sub-basin
Water Committees.
But Tanzania’s constitution, unlike Kenya’s, does
not explicitly contain provisions for land and the The National Environmental Policy emphasizes
environment. However, there are other major national sustainability and the conservation of natural resources
legal instruments such as the Tanzania Development and allows for economic instruments (such as PES,
Vision 2025 (launched in 2000), the National Water potentially) as approaches to environmental resource
Policy (2002), the Water Resources Management Act protection. The Water Resources Management Act gives
(2009) and the National Environmental Policy (1997). effect to the 2002 National Water Policy and includes
BOX 38.1
Payment for ecosystem services
The ecosystems in the Mara River basin contribute significantly to the region’s economy by providing valuable services with-
out the need for any direct human labour or input. Payment for Ecosystem – or Environmental – Services (PES) is a mecha-
nism to integrate this intrinsic wealth or productivity within an economic system.
In principle, the PES mechanism would allow for sustainable land use within the basin without the need for outside funding.
The Mara River basin presents an ideal scenario for implementing a PES scheme because of the conflict of interest between
the farmers upstream and wildlife tourism downstream. This ‘vying for benefits’ creates an opportunity for the transfer of
ecosystem-based benefits to the upstream farmers in the form of economic support for the improvement of agricultural
practices.
The first step towards a PES mechanism was taken in 2006 as a part of the project, Transboundary Water for Biodiversity and
Human Health in the Mara River Basin. A feasibility study identified market-financed PES as the most appropriate methodol-
ogy for economically incentivizing conservation efforts.
Thanks to surveys, analyses, and stakeholder meetings, the project has made considerable progress towards the development
and eventual implementation of a PES mechanism. A final document is expected in 2012, which would present the culmina-
tion of the consensus-building process. However, while current policies in Kenya and Tanzania are generally supportive of PES
schemes, they lack any concrete instruments in terms of laws and regulations for PES agreements. This observation presents
an important challenge for translating a theoretical PES mechanism into a functional market-based system. Although existing
legal and contractual mechanisms in both countries may enable the formation of a basic framework for a PES scheme, the in-
troduction of supplemental regulations seems necessary.
790 CHAPTER 38 AFRICAlegislation related to transboundary water resources Unless appropriate action is taken, growing problems
management. This Act also allows for the creation of the will have a direct impact on the livelihoods of local
Lake Victoria Basin Water Office, which is responsible people as well as on the national economies of both
for management of the Mara River. countries.
Conclusions
The Mara River Basin is facing the mounting challenges
ııııııııııııııııııııııııııııııııııııııııııııııııııııııııııııııııııııııııııı
of water scarcity, pollution and environmental degrada-
tion as a result of agricultural expansion, intensification Notes
of irrigation, population growth and the increasing
impact of tourism. The main competition for water 1 The Kenyan poverty line is set at approximately US$1.50 per day
for rural populations and US$3.50 per day for urban populations.
resources in the basin is between irrigated agriculture
and the Masai Mara and Serengeti Wildlife areas.
Limited access to safe drinking water supply and
ııııııııııııııııııııııııııııııııııııııııııııııııııııııııııııııııııııııııııı
practically the absence of a sanitation infrastructure
add to widespread poverty through a heavy burden References
of disease. Legislation to address issues related to
water and other natural resources is gradually being Except where otherwise noted, information in this
developed and put in place in both Kenya and Tanzania. concise summary is adapted from the Case Study
Their implementation can help to operationalize Report of the Mara River Basin in Kenya and Tanzania,
mechanisms such as Payment for Ecosystem Services prepared in 2011 by the Global Water for Sustainability
(PES), which can create sustainable financial support for (GLOWS) Programme, Florida International University,
efforts to conserve and protect natural resources. supported by USAID (forthcoming).
WWDR4 MARA RIVER BASIN, KENYA AND TANZANIA 791CHAPTER 39
Jordan
—
Acknowledgements Maysoon Al-Zubi
© Yann Arthus-Bertrand/Altitude-Paris
Jordan: Gardens created in the middle of the Wadi Rum desert (29°33' N, 35°39' E)Location and general characteristics steppe and the steppe desert regions have a continental
The Hashemite Kingdom of Jordan (Jordan from climate with large variations in temperature.
here on) is located in the eastern Mediterranean and
bordered by Syria to the north, Iraq to the north-east, Precipitation in the country is very limited and ranges
the Kingdom of Saudi Arabia to the east and south, from 30 mm to 600 mm annually. Some 93.5% of the
and the West Bank and Israel to the west (Map 39.1). country has less than 200 mm of rainfall, and only
Jordan’s population is around 6.3 million and it has 0.7% of the country has annual precipitation of more
a surface area of approximately 90,000 km2. The than 500 mm. Most of the rainfall occurs between
Jordan Rift Valley, a narrow strip of highlands (with a November and April, and, in general, decreases
maximum elevation of 1,600 m above sea level), the considerably from west to east and from north to
steppe, the desert zone and the Dead Sea (426 m south. Overall, 83% of the country is composed of
below sea level in 2010) are the most distinctive desert and desert steppe.
topographical features.
Water resources availability and their use
Climate varies significantly from one region to another. Jordan is one of the most arid countries in the world.
The west of Jordan has a Mediterranean climate, While the average annual rainfall is approximately
characterized by dry hot summers, mild wet winters 8.2 billion m3, 92% of this is lost through evaporation.
and extreme variability in rainfall during the year as Total internal renewable water resources are seriously
well as from year to year. The climate in the highlands is limited. At an estimated 682 million m3/year, the country
characterized by mild summers and cold winters. Aqaba is far below the water poverty line. Developed surface
Governorate and the Jordan Rift Valley have a subtro- water potential was approximately 295 million m3 in
pical climate – hot in summer and warm in winter. The 2007, and is projected to reach 365 million m3 by 2022.
MAP 39.1
Jordan River basin
%
&
'
#
( SYRIA
)
EA
( !
NEAN S
Lake
Tiberias
"
k #
ou
Ya r m Wadi
al Mirba $
Irbid
RRA
+ Al-Mafraq Wadi
Jordan
TE
& Ruwaishid al Satill
Z a rqa
*
DI
Basin , ' Amman JORDAN
ME
#
Ramsar site (
! - Wadi
Dam *
Wadi el el Janab
Dead Moujib
National park " Sea
# Al-Karak Wadi SAUDI
City & Wadi Maghar ARABIA
%
International boundary
Al Jafr
Ma’an
Aqaba
GULF 0 20 40 60 80 100 km
OF
AQABA
WWDR4 JORDAN 793You can also read