FABRICATION OF NANOPORE IN MOS2-GRAPHENE VDW HETEROSTRUCTURE BY ION BEAM IRRADIATION AND THE MECHANICAL PERFORMANCE - MDPI
←
→
Page content transcription
If your browser does not render page correctly, please read the page content below
nanomaterials

Article
Fabrication of Nanopore in MoS2-Graphene vdW
Heterostructure by Ion Beam Irradiation and the
Mechanical Performance
Xin Wu * , Ruxue Yang, Xiyue Chen and Wei Liu *

                                          School of Chemical Engineering and Technology, Sun Yat-sen University, Zhuhai 519082, China;
                                          yangrx7@mail2.sysu.edu.cn (R.Y.); chenxy795@mail2.sysu.edu.cn (X.C.)
                                          * Correspondence: wuxin28@mail.sysu.edu.cn (X.W.); liuwei96@mail.sysu.edu.cn (W.L.)

                                          Abstract: Nanopore structure presents great application potential especially in the area of biosensing.
                                          The two-dimensional (2D) vdW heterostructure nanopore shows unique features, while research
                                          around its fabrication is very limited. This paper proposes for the first time the use of ion beam
                                          irradiation for creating nanopore structure in 2D vdW graphene-MoS2 heterostructures. The forma-
                                          tion process of the heterostructure nanopore is discussed first. Then, the influence of ion irradiation
                                          parameters (ion energy and ion dose) is illustrated, based on which the optimal irradiation param-
                                          eters are derived. In particular, the effect of stacking order of the heterostructure 2D layers on the
                                          induced phenomena and optimal parameters are taken into consideration. Finally, uniaxial tensile
                                          tests are conducted by taking the effect of irradiation parameters, nanopore size and stacking order
                                          into account to demonstrate the mechanical performance of the heterostructure for use under a
                                          loading condition. The results would be meaningful for expanding the applications of heterostructure
                                          nanopore structure, and can arouse more research interest in this area.


Citation: Wu, X.; Yang, R.; Chen, X.;     Keywords: MoS2 -graphene vdW heterostructure; nanopore fabrication; ion beam irradiation;
Liu, W. Fabrication of Nanopore in        mechanical performance
MoS2 -Graphene vdW
Heterostructure by Ion Beam
Irradiation and the Mechanical
Performance. Nanomaterials 2022, 12,      1. Introduction
196. https://doi.org/10.3390/
                                               Nanopore technology refers to the creation and applications of nanometer pores in
nano12020196
                                          membrane structures. Since the size of nanopore channels is comparable to that of typical
Academic Editor: Filippo Giubileo         biomolecules, it is possible to use nanopores for detecting various biomolecules. The first
                                          demonstration of nanopores in biosensing was achieved in 1996 [1]. Thereafter, many
Received: 16 December 2021
                                          research efforts have been made to uncover the underlying mechanisms of nanopore-based
Accepted: 5 January 2022
Published: 7 January 2022
                                          biosensors and to improve the efficiency and sensitivity of detection [2–5]. Nanopore-based
                                          single molecule sequencing was even taken as one of the most promising techniques to
Publisher’s Note: MDPI stays neutral      realize the objective of the “$1000 genome” project [6]. Currently, there are four major
with regard to jurisdictional claims in   types of nanopores: biological nanopores, solid-state nanopores, two dimensional (2D)
published maps and institutional affil-
                                          nanopores, and hybrid nanopores. Among them, the 2D nanopores (nanopore creation in
iations.
                                          2D materials) stand out due to the unique features of the 2D materials [7,8]. For example,
                                          the subnanometer thickness of the 2D nanopore is close to the spatial interval of neighboring
                                          nucleic acid bases, giving the ability to achieve gene sequencing at a single-base level. The
                                          high carrier mobility of 2D materials also enables the detection of biomolecules with great
Copyright: © 2022 by the authors.
Licensee MDPI, Basel, Switzerland.
                                          sensitivity. Besides the applications in biosensing, 2D nanopore technology has also been
This article is an open access article
                                          widely used in ion filtration, sea water desalination, gas separation, etc. [9–11].
distributed under the terms and                2D nanopore materials can be fabricated by many techniques [12–14], which can be
conditions of the Creative Commons        categorized into “top-down” methods, i.e., directly creating the pore structure in membrane
Attribution (CC BY) license (https://     materials, and “bottom-up” methods, i.e., synthesizing nanopores during the growth of
creativecommons.org/licenses/by/          2D materials. Recently, Su et al. [15] comprehensively reviewed the approaches applied in
4.0/).                                    nanopore fabrication in 2D materials, and they divided the fabrication methods into four

Nanomaterials 2022, 12, 196. https://doi.org/10.3390/nano12020196                                     https://www.mdpi.com/journal/nanomaterials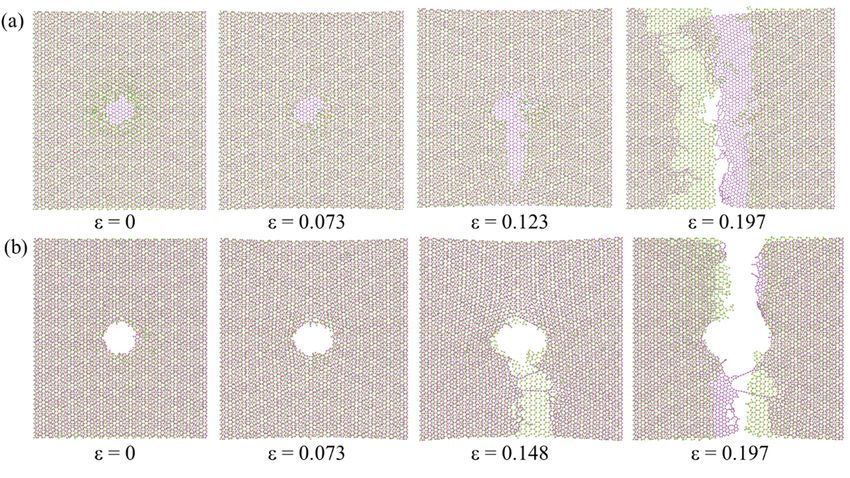
Nanomaterials 2022, 12, 196                                                                                          2 of 15

                              types: energetic particle impact, chemical reaction, physical and chemical methods, and
                              others. Most of the fabrication methods aim at obtaining nanopore arrays with high pore
                              density, which are usually applied in water desalination [9], gas separation [11], and energy
                              conversion [16]. In contrast, some applications such as biosensors require that a single
                              pore is created in the membrane. For this scenario, the methods of electrical pulses [17],
                              transmission electron microscope sculpting [18], and ion beam irradiation [19] are more
                              suitable. Due to the flexibility in adjusting the irradiation parameters and the ability
                              to create pore structures with diameters from subnanometer to tens of nanometers, ion
                              beam irradiation is recognized as the most efficient technique in fabricating nanopores for
                              biosensing. Consequently, many theoretical and experimental studies have been conducted
                              to illustrate the general phenomena and underlying mechanisms of the ion beam fabrication
                              of 2D nanopore structures [20–22].
                                    The 2D materials adopted for the creation of nanopores mainly include graphene,
                              MoS2 and h-BN [23,24]. For applications of 2D nanopores in biosensing, a large elec-
                              tric field is often applied to drive the biomolecules through the nanopore, which results
                              in rapid penetration, limiting the resolution of detection. Moreover, this method only
                              works for biomolecules with net charges. Therefore, it is important to find suitable charge-
                              independent methods for nanopore biosensing. Recently, the nanopores in 2D vdW het-
                              erostructures, which are synthesized by vertically stacking two different 2D crystals [25],
                              were demonstrated to be able to drive the penetration of biomolecules by the difference
                              in binding affinities for each 2D surface, rather than the external electrical field [26–28].
                              The 2D vdW heterostructure nanopore could slow down the translocation speed of the
                              biomolecules as well, which is significant for applications such as DNA sequencing. There-
                              fore, the applications of 2D vdW heterostructure nanopores in biosensing present more
                              advantages. There is, however, limited research around the synthesis of nanopores in vdW
                              heterostructures, especially for the fabrication of nanopores in 2D vdW heterostructures by
                              ion beam irradiation.
                                    Hence, this paper focuses on the creation of nanopore structure in 2D vdW het-
                              erostructures using Ar ion beam irradiation, for which classical molecular dynamics (MD)
                              simulation method is adopted, while graphene/MoS2 (G/M, graphene layer facing the ion
                              beam) heterostructure is taken as the representative structure due to its well-demonstrated
                              performance in biosensing [26,28]. The nanopore formation process and the influence of
                              the irradiation parameters are revealed. By switching the stacking order of the 2D crystals,
                              i.e., generating the MoS2 /graphene (M/G) heterostructure, distinct phenomena can be
                              observed. The mechanical behavior of the heterostructure and nanopore under tensile
                              strain is investigated for actual applications.

                              2. Simulation Models
                                   In this study, the classical MD simulation method is applied through the large scale
                              atomic/molecular massively parallel simulator (LAMMPS) software [29]. LAMMPS is an
                              open source package with a record of successful demonstrations in describing the interac-
                              tions between ions and 2D materials [30–32]. Ar ions are selected for the irradiation, since
                              they are rich as an ion source in experiments [33,34] and widely used in other simulation
                              studies [22]. Monolayer graphene-MoS2 (G/M or M/G) heterostructures are the impact
                              target. The nanopore in a heterostructure is generated through the transfer of momentum
                              energy from energetic Ar to the heterostructure layers. To mimic this process, a hybrid
                              atomic potential is adopted. The interaction between Ar ions and atoms in a heterostruc-
                              ture is described by the Ziegler–Biersack–Littmark (ZBL) universal repulsive potential [35],
                              which can present atomic interaction at small separation during the irradiation. The inter-
                              action between the atoms in MoS2 is captured by a second-generation reactive empirical
                              bond-order (REBO) potential [36], and the interaction between the atoms in graphene is
                              considered as an adaptive intermolecular reactive bond order (AIREBO) potential [37]. The
                              vdW interaction between MoS2 and graphene crystal is modeled by the Lennard–Jones (LJ)
                              potential [38], which is parameterized according to [39,40]. The simulation model is illus-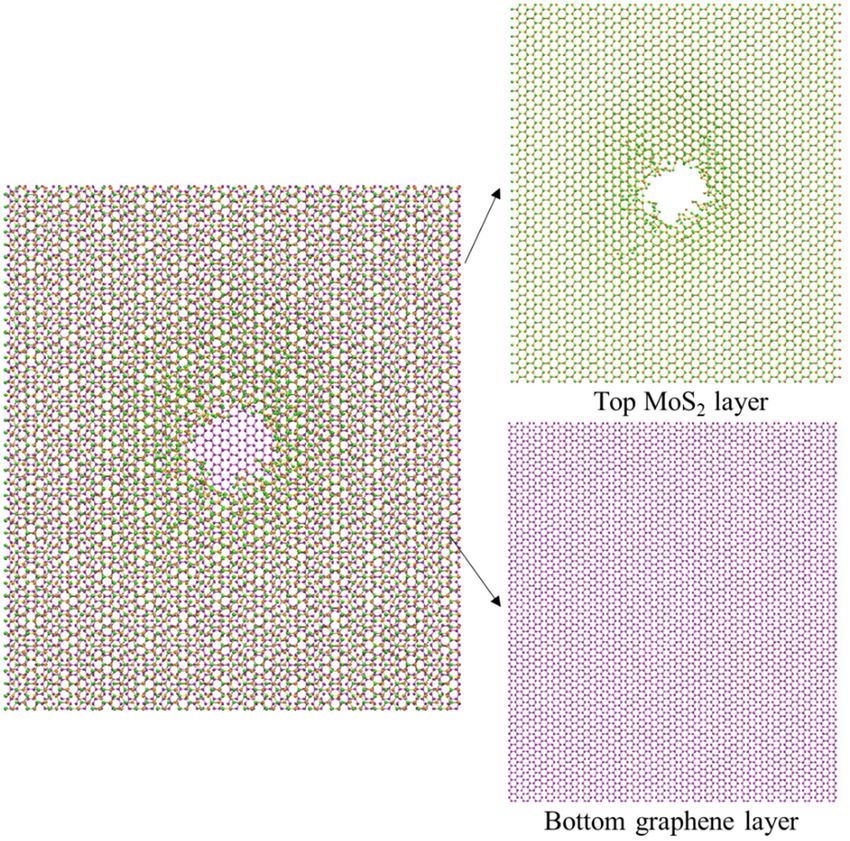
Nanomaterials 2022, 12, x FOR PEER REVIEW 3 of 15
Nanomaterials 2022, 12, 196 graphene is considered as an adaptive intermolecular reactive bond order (AIREBO) po-
3 of 15
tential [37]. The vdW interaction between MoS2 and graphene crystal is modeled by the
Lennard–Jones (LJ) potential [38], which is parameterized according to [39,40]. The simu-
lation model is illustrated in Figure 1, which presents an in-plane size of 115 × 130 Å with
trated in Figure 1, which presents an in-plane size of 115 × 130 Å with 11,124 atoms. The
11,124 atoms. The in-plane directions of the simulation box are assigned with periodic
in-plane directions of the simulation box are assigned with periodic boundary conditions,
boundary conditions, while the out-of-plane direction is fixed to allow the injection of ion
while the out-of-plane direction is fixed to allow the injection of ion beams. During the
beams. During the ion irradiation process, the outermost several layers of the heterostruc-
ion irradiation process, the outermost several layers of the heterostructure are fixed, and
ture are fixed, and several adjacent layers are assigned with Berendsen temperature con-
several adjacent layers are assigned with Berendsen temperature control [41], as shown in
trol [41], as shown in Figure 1b. This strategy could prevent the heterostructure from over-
Figure 1b. This strategy could prevent the heterostructure from overall movement, and
all movement, and minimize the side effects of the ion induced pressure wave as well. The
minimize the side effects of the ion induced pressure wave as well. The system is first
system is first equilibrized through an NVT ensemble at 300 K for enough time to reach a
equilibrized through an NVT ensemble at 300 K for enough time to reach a relaxed state.
relaxed
Then, state. Then,
consecutive Arconsecutive Ar ions emitted
ions are randomly are randomly from aemitted
cylinderfrom withathecylinder with the
axis located at
the center of the heterostructure. The radius of the irradiated spot is 10 Å which is
axis located at the center of the heterostructure. The radius of the irradiated spot can10beÅ
which can be achieved by using a focused ion beam technique
achieved by using a focused ion beam technique in the experiment [42], and the cylinder is in the experiment [42], and
theÅcylinder
40 on top of is the
40 Å on top of the heterostructure
heterostructure plane. Ar ions are plane. Ar ions
irradiated are irradiated
every 1000 timestepsevery 1000
with a
timesteps with a step size of 0.5 fs to achieve a certain dose,
step size of 0.5 fs to achieve a certain dose, during which process the system is stabilized during which process the
system
at 300 K.isIn stabilized
this study, at 300 K. Inion
various thisdoses
study, various
from 1.59 ion× 10doses
15 /cm from
2 to 1.59
2.54 ××10 1016/cm
15
/cmto2 and
2 2.54
× 10 16 /cm 2 and various ion energies from 40 eV to 5000 eV are
various ion energies from 40 eV to 5000 eV are considered to uncover the influence of ion considered to uncover the
influence of ion parameters on the fabrication of the nanopore.
parameters on the fabrication of the nanopore. The studied ranges of ion dose and ion The studied ranges of ion
dose and
energy ionmatch
also energythe also match the experimental
experimental conditions well conditions
[33,34].wellAfter [33,34]. After the irradi-
the irradiation stage,
ation stage, the irradiated structures are annealed at
the irradiated structures are annealed at 2000 K for enough time to mimic the 2000 K for enough time to mimic
long-time the
long-time process
annealing annealing process
in actual in actual experiments.
experiments. Finally, the systemFinally,isthe system
cooled is cooled
to room to room
temperature,
temperature,
and kept at this and keptThe
state. at this
above state. The above
simulation simulation
scheme scheme
can reveal thecan reveal theduring
phenomena phenom- the
ena irradiation
ion during the process,
ion irradiation process, asby
as demonstrated demonstrated
many researchers by many researchers [32,43].
[32,43].
After the ion irradiation
irradiation and annealing
annealing process, the obtained obtained atomic coordinates of
the heterostructures
heterostructures with with nanopores
nanopores are are extracted
extracted and and a uniaxial tensile stretching process
is applied to investigate the mechanical performance of the nanopore structure. structure. One side
of the
the irradiated
irradiatedstructure
structureisisfixed
fixedandandthethe
other sideside
other is stretched
is stretched with with
a strain rate ofrate
a strain 0.0005of
ps−1. The
0.0005 ps−stress
1 . Theinformation for each
stress information foratom
each isatomfirstiscalculated
first calculatedand then stress
and then along
stress the
along
stretching
the stretching direction is summed
direction is summed up for upallfor
theallatoms
the atomsto getto thegetoverall stress of
the overall the whole
stress of the
system.system.
whole The overall stress values
The overall are averaged
stress values are averagedevery every500 timesteps
500 timestepsfor outputting to re-
for outputting
to reduce
duce the fluctuation
the fluctuation of theofdata.
the Thereafter,
data. Thereafter, the stress-strain
the stress-strain relationship
relationship for eachfor each
system
system
is obtainedis obtained and plotted.
and plotted. To showTothe show the dynamics
dynamics of stressofevolution
stress evolution
for eachfor atomeachduring
atom
during the stretching
the stretching process,process, the per-atom
the per-atom stress information
stress information is also isoutputted,
also outputted,
and the and the
Open
Open Visualization
Visualization Tool (OVITO)
Tool (OVITO) software software [44] is adopted
[44] is adopted for visualizing.
for visualizing. The other
The other configura-
configurations
tions are visualized are visualized by the
by the Visual Visual Molecular
Molecular DynamicsDynamics (VMD) program (VMD) program
[45]. [45].
1. Simulation
Figure 1. Simulation models of
of the
the M/G
M/G nanopore fabrication by ion beam
beam irradiation.
irradiation. (a) Front
view, and
view, and (b)
(b) top
top view.
view.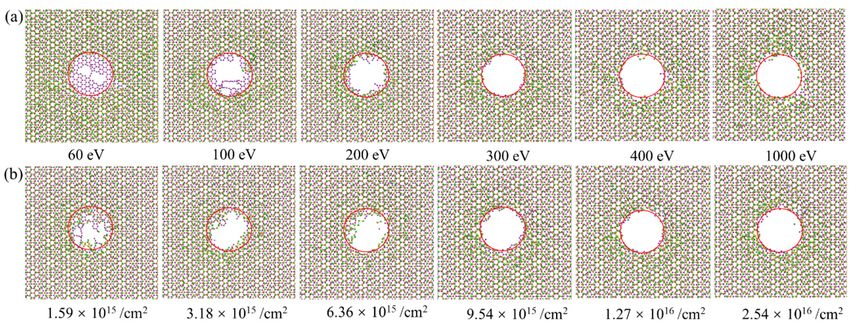
Nanomaterials 2022, 12, 196 4 of 15
Nanomaterials 2022, 12, x FOR PEER REVIEW 4 of 1
3. Results and Discussion
3.1. Dynamic Formation Process of Nanopore
3. Results and Discussion
During ion 3.1.
irradiation, the irradiated
Dynamic Formation Processparticle
of Nanoporewould interact with atoms in the 2D
crystals, which may lead to four phenomena, i.e., reflection, absorption, embedment, or
During ion irradiation, the irradiated particle would interact with atoms in the 2D
penetration, depending on the impact energy [46]. The momentum energy would be
crystals, which may lead to four phenomena, i.e., reflection, absorption, embedment, o
transferred frompenetration,
the Ar ionsdepending
to the atoms on inthe2D vdW energy
impact heterostructure, which induces
[46]. The momentum the would b
energy
fluctuation of thetransferred
heterostructure
from the plane and to
Ar ions generates
the atoms knocked-out atoms if the irradiation
in 2D vdW heterostructure, which induces th
energy is high enough.
fluctuation of the heterostructure plane and generates knocked-out atoms if the irradia
Figure 2 shows the dynamics
tion energy of formation of the nanopore structure in G/M het-
is high enough.
erostructure with an irradiation
Figure 2 shows parameter pair ofof200
the dynamics eV, 1.27of×the
formation 1016 /cm2 . The
nanopore colorsinare
structure G/M hetero
used to mark thestructure
coordinates
with of
an each atom,parameter
irradiation so that we canofobtain
pair 200 eV,the1.27displacement
× 1016 /cm2. Theofcolors
the are used
atoms under different
to markirradiation times.ofThe
the coordinates each initial
atom,blue color
so that weindicates
can obtainthe therandom fluctua-
displacement of the atom
under
tion of the structure different
during irradiation process
the annealing times. The initial
(time = 0blue
ps). color
Afterindicates the random
being irradiated, thefluctuation
of the structure
atoms at the irradiated area would during
move the annealing
along process (time
the irradiation = 0 ps).
direction andAfter beingfrom
separate irradiated, th
the heterostructure plane at a certain energy level, generating irregular defects when separate
atoms at the irradiated area would move along the irradiation direction and the from
the heterostructure plane at a certain energy level, generating
irradiation time is short (time = 2 ps). The damaged area is initially characterized rough irregular defects when th
irradiation time is short (time = 2 ps). The damaged area
edges and dangling molecular chains. With the increase of irradiation time, more atoms in is initially characterized rough
edges
the heterostructure and be
would dangling
sputteredmolecular
and the chains. With structure
nanopore the increase of irradiation
would be initiatedtime,
andmore atom
in the heterostructure would be sputtered and the nanopore structure would be initiated
grown radially (time = 5 ps). The dangling molecular chains would be gradually cleared
and grown radially (time = 5 ps). The dangling molecular chains would be graduall
up, resulting in a smoother pore structure (time = 10 ps). Eventually, the nanopore becomes
cleared up, resulting in a smoother pore structure (time = 10 ps). Eventually, the nanopor
stabilized, and the atoms at the pore edges fluctuate only slightly because there is no more
becomes stabilized, and the atoms at the pore edges fluctuate only slightly because ther
impact from the is irradiation (timefrom
no more impact = 26 the
ps).irradiation
Figure 2b(time gives theps).
= 26 leftFigure
views2bofgives
the structure
the left views of th
during the irradiation process, which reveals a large displacement for the
structure during the irradiation process, which reveals a large displacement atoms at the porefor the atom
edge at the beginning, while
at the pore edge there is beginning,
at the a small displacement
while there isfor the edge
a small atoms when
displacement the
for the edge atom
pore structure gets
whenformed.
the pore The random
structure getslocation
formed.ofThe therandom
red colored
locationatoms
of theindicates
red coloredthatatoms indi
there are some rebounded atoms
cates that there areduring the generation
some rebounded atomsof the nanopore.
during the generation of the nanopore.
Figure 2. StructuralFigure 2. Structural
evolution evolution
of the G/M of the G/M heterostructure
heterostructure under ion(a)
under ion irradiation. irradiation. (a) Front
Front view, and view, an
(b) left view. Ion energy is 200 eV, ion dose
16 is 1.27
2 × 10¹⁶ /cm2. The atoms are colored according t
(b) left view. Ion energy is 200 eV, ion dose is 1.27 × 10 /cm . The atoms are colored according to
the z coordinates. z is defined as the coordinate axis along the irradiation direction.
the z coordinates. z is defined as the coordinate axis along the irradiation direction.
3.2. Influence of Ion Irradiation Energy and Dose
3.2. Influence of Ion Irradiation Energy and Dose
As illustrated in the above, ion irradiation may be able to create a nanopore in th
As illustrated in the above, ion irradiation may be able to create a nanopore in the
heterostructure at a certain ion irradiation energy and dose. However, this does not mean
heterostructure at thatcertain
a ion irradiation
the desired pore structure energy
can beand dose.atHowever,
formed this doesAs
any ion parameter. not meanin Figure 3
shown
that the desired pore structure can be formed at any ion parameter. As shown
when the ion energy is small (80 eV), the formed pore is far from the designed in Figure 3, structur
when the ion energy(rediscircled
smallarea),
(80 eV), the formed
regardless pore
of the ionisirradiation
far from the designed
dose (2.54 × 10structure (red
16/cm2 is actually a rela
circled area), regardless of the
tively high ionion irradiation
dose). Meanwhile, doseif (2.54
the ion 1016 /cm
×dose 2 is actually 15
is small (3.18 × 10 a relatively
/cm2), the generated
high ion dose). Meanwhile,
pore would if thebeion
also fardose
fromisthe
small (3.18 ×
designed 1015regardless
form, /cm2 ), theof generated pore energ
the ion irradiation
would also be far(5000
fromeVtheisdesigned
actually aform, regardless
relatively high ion of energy).
the ion irradiation
Therefore, to energy
achieve(5000 eV
a nanopore wit
desiredhigh
is actually a relatively structure, it is necessary
ion energy). to carefully
Therefore, controlathe
to achieve ion irradiation
nanopore parameters.
with desired
structure, it is necessary to carefully control the ion irradiation parameters.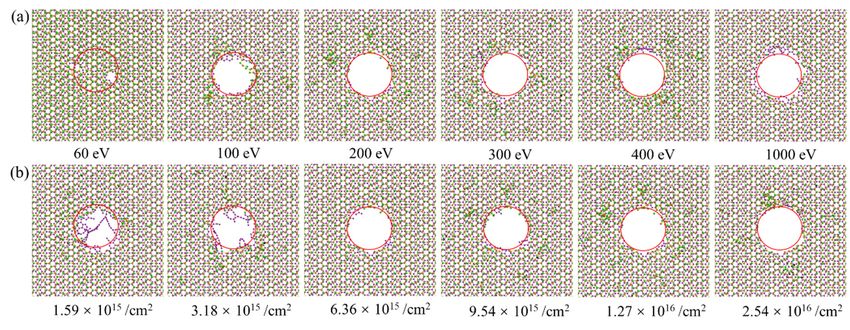
Nanomaterials 2022, 12,Nanomaterials
196 2022, 12, x FOR PEER REVIEW 5 of 15 5o
Figure 3.
Figure 3. Morphologies of Morphologies of the G/M heterostructure
the G/M heterostructure under ion
under ion irradiation irradiation
with with pair
a parameter a parameter
of pair
(a) 80 eV,
16 and 2.54
2 × 10¹⁶ /cm2. (b) 5000 eV,153.18 × 21015 /cm2. The red colored circle is used to indic
(a) 80 eV, and 2.54 × 10 /cm . (b) 5000 eV, 3.18 × 10 /cm . The red colored circle is used to
the irradiation area.
indicate the irradiation area.
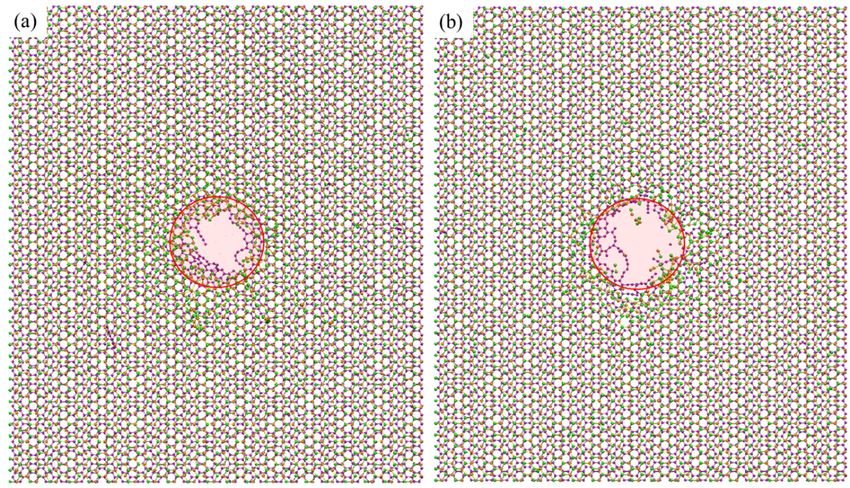
Figure 4 gives the morphologies of the G/M heterostructure irradiated by ions w
Figure 4 gives the morphologies of the G/M heterostructure irradiated by ions with
energies from 60 eV to 1000 eV, and doses15from 1.59 × 10¹⁵ /cm2 to 2.54 × 10¹⁶ /cm2.
energies from 60 eV to 1000 eV, and doses from 1.59 × 10 /cm2 to 2.54 × 10¹⁶ /cm2 . As
shown in Figure 4a, when the irradiation energy is 60 eV, the irradiated area present
shown in Figure 4a, when the irradiation energy is 60 eV, the irradiated area presents a
morphology more like irregular defects, rather than a pore structure. The area gradua
morphology more like irregular defects, rather than a pore structure. The area gradually
develops into a nanopore structure when the ion energy increases from 100 eV to 200 e
develops into a Itnanopore structure when the ion energy increases from 100 eV to 200 eV. It
is seen that under ion irradiation energy above 200 eV (i.e., from 200 eV to 1000 e
is seen that under ion irradiation
there is little change energy
for theabove
pore 200 eV (i.e.,
structure. Asfrom 200 eV
depicted to 10004b,
in Figure eV), there
with an ion irrad
is little change for
tionthedosepore structure.
of 1.59 As 2depicted
× 1015 /cm and 3.18 ×in10 Figure
15 /cm24b, with
, there an ion
would beirradiation
obvious long residu
1015 /cm
dose of 1.59 × carbon 2 and 3.18 × 10¹⁵ /cm2 , there would be obvious long residual
bonds in the graphene plane, while the residual bonds in the MoS2 layer are ve
carbon bonds in the graphene
limited, indicatingplane, while
an easier the residual
knock-out bonds ininthe
phenomenon MoS MoS 2 layer
2 when
are
compared to g
very limited, indicating an easier knock-out phenomenon in MoS
phene. Under higher irradiation dosage, these long residual carbon bonds
2 when compared to would
graphene. Under higher
largely irradiation
cleared up and dosage,
a nanoporethese
withlong
highresidual carbonbebonds
quality would formed.would be
The residual cha
largely cleared would
up and a nanopore with high quality would be formed. The residual
be largely reduced, though they still exist around the nanopore edge. These res
chains would beual largely
bondsreduced,
are usuallythough they still
chemically existproviding
active, around the nanopore
ideal sites foredge. These
the hydrogenation
residual bonds areandusually chemically
nitridation [10] of active, providing
the nanopore ideal sites
structure, for is
which theimportant
hydrogenation
for some[9] applicati
and nitridation scenarios.
[10] of theEven nanopore
thoughstructure, which
ion irradiation is aimportant
with for some
higher energy application
and larger dose could be he
scenarios. Evenfulthough ion an
to achieve irradiation with a the
ideal nanopore, higher energyenergy
redundant and larger dosemay
and dose could be
be detrimental
helpful to achievethean ideal nanopore,
experimental the redundant
equipment, energy
which means and
that thedose may beof
derivation detrimental
an optimized to irradiati
the
Nanomaterials 2022, 12, x FOR PEER REVIEWexperimental equipment,
parameter pairwhich
(the means
least that the
irradiation derivation
energy and of an
dose optimized
for generatingirradiation
a good-quality
6 of 15 po
parameter pair structure) is needed. energy and dose for generating a good-quality pore
(the least irradiation
structure) is needed.
Figure 4. Cont.
Figure 4. Configurations of the G/M heterostructure under ion irradiation with different ion ener-
gies and ion doses. (a) The influence of ion energy under a constant ion dose of 1.27 × 10¹⁶ /cm2. (b)
The influence of ion dose under a constant ion energy of 200 eV. The red colored circle is used to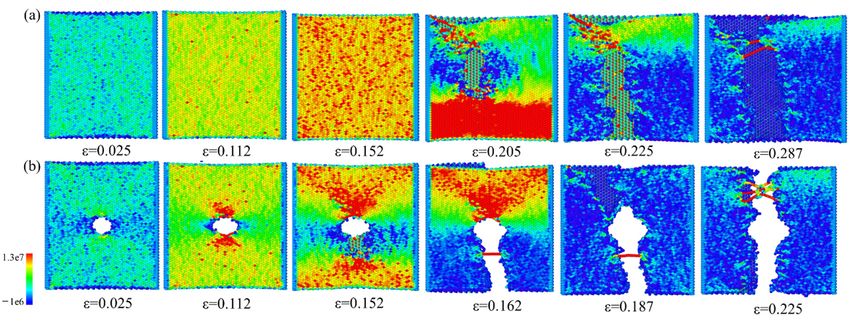
Nanomaterials 2022, 12, 196 6 of 15
Figure 4.
Figure Configurations of
4. Configurations of the
the G/M
G/M heterostructure
heterostructureunder
underion
ionirradiation
irradiationwith
with different
differentionionenergies
ener-
and and
gies ion doses. (a) The
ion doses. (a) influence of ionofenergy
The influence underunder
ion energy a constant ion dose
a constant ion of
dose 1016× /cm
1.27of×1.27 1016 2/cm
. (b)2. The
(b)
The influence
influence ofdose
of ion ion dose
under under a constant
a constant ion energy
ion energy of 200of
eV.200
TheeV.
redThe red colored
colored circle iscircle
used tois used
indicateto
indicate the irradiation
the irradiation area. area.
Figure 55plots
Figure plotsthe thedependence
dependenceofofthe thenumber
number of of sputtered
sputtered atoms
atoms of the
of the G/M G/M het-
hetero-
erostructure
structure on ion
on ion irradiation
irradiation energy
energy andand ioniondose.dose. It clearly
It clearly shows
shows thatthat
withwith
thethe increase
increase of
of ion
ion irradiation
irradiation energy
energy and and dose,
dose, thethe number
number ofofsputtered
sputteredatomsatomsfor forall
allthe
thecases
cases would
would
increase. When
increase. Whenthe theionionirradiation
irradiationenergyenergyisislow low(80(80eVeVand and100
100eV),
eV),thethenumber
numberof ofsput-
sput-
tered atoms is small and increases quickly with the addition of
tered atoms is small and increases quickly with the addition of the irradiation dose. It canthe irradiation dose. It can
be expected that under these two cases, the number of sputtered
be expected that under these two cases, the number of sputtered atoms would be further atoms would be further
16 2 When the
increased if
increased if the ion dose is is raised
raised beyond
beyondthe thestudied
studiedrange (2.54××10
range(2.54 1016 /cm
/cm2).). When the
irradiationenergy
irradiation energyisishigh high(200(200eV,eV, 300
300 eVeV and
and 400 400 eV),
eV), thethe number
number of of sputtered
sputtered atoms
atoms is is
relatively large and a steady status is quickly achieved with the
relatively large and a steady status is quickly achieved with the increase of ion irradiationincrease of ion irradiation
dose. Moreover,
dose. Moreover,the thethree
threecases,
cases,i.e.,
i.e.,200
200eV,eV,300300eVeVandand400 400eV,eV, present
present very
very close
closedata,
data,
indicating that 200 eV irradiation energy is large enough
indicating that 200 eV irradiation energy is large enough to generate the desired pore to generate the desired pore
structure. Further increase of the irradiation energy has limited benefit to the quality the
structure. Further increase of the irradiation energy has limited benefit to the quality of of
nanopore,
the nanopore, while it would
while it wouldintroduce
introducelarge sideside
large effects to the
effects to equipment
the equipment in the
in experiment.
the experi-
Therefore,
ment. 200 eV200
Therefore, is determined
eV is determinedas the optimal ion irradiation
as the optimal energy. As
ion irradiation for theAs
energy. influence
for the
of the ion irradiation
influence of the ion irradiation dose, the number
dose, the of sputtered
number of atoms
sputtered becomes
atoms stable
becomes after reaching
stable after
the ion dose × 10 16 /cm2 , indicating 1.27 × 10¹⁶ /cm2 as the optimal ion irradiation
reaching the ofion1.27
dose of 1.27 × 10¹⁶ /cm2, indicating 1.27 × 10¹⁶ /cm2 as the optimal ion
dose. Therefore,
irradiation the optimalthe
dose. Therefore, parameter pair to obtain
optimal parameter pairato high-quality nanopore nanopore
obtain a high-quality is derived
as 200 eV and 1.27 × 10 16 /cm2 . The detailed nanopore structures generated under ion
is derived as 200 eV and 1.27 × 10 16 /cm2. The detailed nanopore structures generated un-
irradiation of 200 eV, 1.27 × 10¹⁶ /cm 2 and 400 eV, 2.54 × 10¹⁶ /cm2 are also compared
der ion irradiation of 200 eV, 1.27 × 10¹⁶ /cm2 and 400 eV, 2.54 × 10¹⁶ /cm2 are also compared
in Figure 5, which shows that the optimal parameter pair is able to generate the desired
in Figure 5, which shows that the optimal parameter pair is able to generate the desired
structure, while increasing ion energy and dose has limited effect on the improvement of
structure, while increasing ion energy and dose has limited effect on the improvement of
the nanopore quality.
the nanopore quality.
3.3. Influence of the Stacking Order
Graphene and MoS2 have different damage thresholds under ion beam irradiation.
Therefore, there might be distinguishing irradiation phenomena if we switch the stacking
order of the two layers. Figure 6 shows the configuration of M/G heterostructure (MoS2
facing the ion beam) under ion irradiation. It indicates that under a low irradiation energy
(60 eV), the top MoS2 layer is quickly removed in the irradiated area, while the bottom
graphene layer is largely retained with some dangling bonds generated. With the increase of
irradiation energy, the graphene layer with the dangling bonds would be gradually cleared
up, generating the MoS2 /graphene nanopore structure (200 eV). The final configuration
would be stable if the ion energy is large enough (above 300 eV). With the constant ion
energy of 300 eV (Figure 6b), the low ion dose (1.59 × 10¹⁵ /cm2 ) would result in irregular
damage with a lot of dangling molecular chains in the irradiation area, while an increase of
ion dose can lead to the final formation of the desired nanopore structure.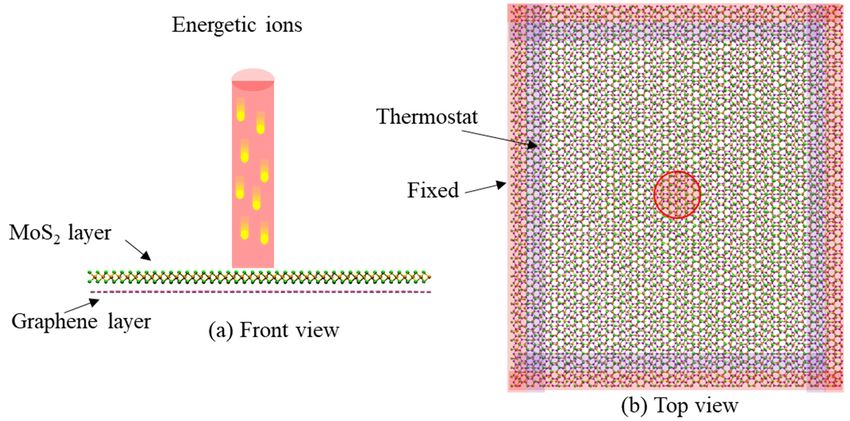
Nanomaterials 2022, 12, x FOR PEER REVIEW                                                                                             7
Nanomaterials 2022, 12, 196                                                                                                           7 of 15

                                  Figure 5. Number
                                                Figure of 5.
                                                          sputtered
                                                             Numberatoms     of the G/M
                                                                        of sputtered      heterostructure
                                                                                      atoms                under ion irradiation
                                                                                             of the G/M heterostructure   under with  different with di
                                                                                                                                 ion irradiation
                                  ion energies and
                                                ent ion
                                                     iondoses.  Theand
                                                          energies     inserted  figures
                                                                           ion doses.    show
                                                                                       The     the configurations
                                                                                           inserted  figures showof  200
                                                                                                                   the   eV, 1.27 × 10¹⁶of/cm
                                                                                                                       configurations      2002eV,
                                                                                                                                               , 1.27 ×
                                                /cm×, 10
                                  and 400 eV, 2.54   2    16
                                                        and 400  2
                                                             /cmeV,   2.54 × 10 /cm , respectively.
                                                                                16
                                                                   , respectively.     2

                                       Compared     to the results
                                               3.3. Influence  of thein Figure Order
                                                                      Stacking  5, the configurations of the M/G heterostructure
                                  in Figure 6 demonstrate a similar phenomenon—that a nanopore structure in both het-
                                                     Graphene and MoS2 have different damage thresholds under ion beam irradiat
                                  erostructures would be gradually generated with the increase of ion irradiation energy
                                               Therefore, there might be distinguishing irradiation phenomena if we switch the stack
                                  and dose, while it seems that the M/G heterostructure requires a higher irradiation energy
                                               order of the two layers. Figure 6 shows the configuration of M/G heterostructure (M
                                  for nanopore formation. The MoS2 and graphene layer in the M/G heterostructure gets
                                               facing the ion beam) under ion irradiation. It indicates that under a low irradiation ene
                                  damaged with an obvious order of precedence, i.e., the MoS2 gets damaged first while the
                                               (60 eV), the top MoS2 layer is quickly removed in the irradiated area, while the bot
                                  damage to the graphene layer depends clearly on the irradiation energy. Therefore, we can
                                               graphene layer is largely retained with some dangling bonds generated. With the incre
                                  suspect that by carefully controlling the ion irradiation energy and dose, a nanopore might
                                               of irradiation energy, the graphene layer with the dangling bonds would be gradu
                                  be generated in the MoS2 layer only, while the graphene layer stays undamaged. Figure 7
                                               cleared up, generating the MoS2/graphene nanopore structure (200 eV). The final con
                                  shows that under the ion parameter pair of 80 eV, 3.18 × 10¹⁵ /cm2 , the nanopore structure
                                               uration would be stable if the ion energy is large enough (above 300 eV). With the cons
                                  can be formed in the top MoS2 layer, with no damage in bottom graphene layer, which
                                               ion energy
                                  cannot be achieved         ofcase
                                                        in the  300 of
                                                                     eVG/M
                                                                         (Figure 6b), the low ion
                                                                              heterostructure. Thedose (1.59 creation
                                                                                                   selective  × 1015/cmof2) awould result in irre
                                                                                                                              nanopore
                                  in a MoS2 layer may have important applications which need experimental validation. while an
                                               lar damage     with   a lot of dangling  molecular  chains  in  the irradiation   area,
                                               crease of ion dose can lead to the final formation of the desired nanopore structure.
                                                     Compared to the results in Figure 5, the configurations of the M/G heterostructur
                                               Figure 6 demonstrate a similar phenomenon—that a nanopore structure in both het
                                               structures would be gradually generated with the increase of ion irradiation energy
                                               dose, while it seems that the M/G heterostructure requires a higher irradiation energy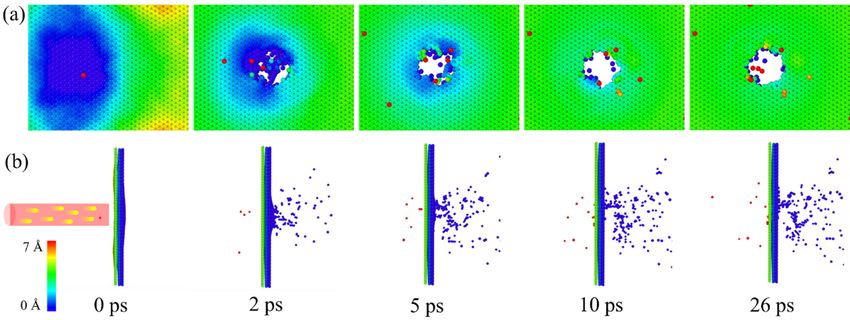
can
cansuspect
suspectthat
thatby
bycarefully
carefullycontrolling
controllingthe theion
ionirradiation
irradiationenergy
energyand anddose,
dose,a ananopore
nanopore
might be generated in the MoS 2 layer only, while the graphene layer stays undamaged.
might be generated in the MoS2 layer only, while the graphene layer stays undamaged.
Figure
Figure7 7shows
showsthat
thatunder
underthe
theion
ionparameter
parameterpair pairofof8080eV, 3.18× ×101015/cm
eV,3.18
15
/cm,2the
2
, thenanopore
nanopore
structure can be formed in the top MoS 2 layer, with no damage in bottom graphene layer,
structure can be formed in the top MoS2 layer, with no damage in bottom graphene layer,
which
whichcannot
cannotbebeachieved
achievedininthethecase
caseofofG/M
G/Mheterostructure.
heterostructure.The Theselective
selectivecreation
creationofofa a
Nanomaterials 2022, 12, 196 nanopore in a MoS 2 layer may have important applications which need experimental val-
8 of 15
nanopore in a MoS2 layer may have important applications which need experimental val-
idation.
idation.
Figure Configurations
Figure6.6.Configurations
Configurations ofof
of the
the M/G
M/G
the M/G heterostructure
heterostructure
heterostructure under
under ion
ion
under irradiation
irradiation
ion with
with
irradiation different
different
with ionion
different ionener-
energies
ener-
gies
and and ion doses. (a) The influence of ion energy under a constant ion dose of
gies and ion doses. (a) The influence of ion energy under a constant ion dose of 1.27 × 10 (b)
ion doses. (a) The influence of ion energy under a constant ion dose of 1.27 × 1.27
1016×/cm
10 162/cm2. (b)
.
16 /cmThe
2. (b)
The
Theinfluence
influence of ionofof
influence ion
doseiondose
doseunder
under aunder a aconstant
constant ion
ionenergy
ion energy
constant of 300 of
energy of300
eV. 300eV.
The eV.The
red Thered
redcolored
colored circle is circle
colored used isisindicate
to
circle used
usedtoto
indicate
indicate
the the
theirradiation
irradiation irradiation
area. area.
area.
Figure
Figure7.
Figure 7.7.Configurations
Configurationsof
Configurations the
ofofthe M/G
M/Gheterostructure
theM/G heterostructureunder
heterostructure underion
under ionirradiation
ion irradiationwith
irradiation withaa aparameter
with parameterpair
parameter pairof
pair ofof
8080eV, 3.18
eV,3.18 × 10
3.18××10
15 /cm2.
15
10 /cm
15 2
/cm ..
2
80 eV,
To derive the optimal ion irradiation parameters for M/G heterostructure, the de-
pendence of the number of sputtered atoms on ion irradiation energies and ion doses is
plotted in Figure 8, from which it can be seen that the number of sputtered atoms would
increase with the increase of ion irradiation energy and ion irradiation dose. For the cases
of 80 eV, 100 eV and 200 eV, the number of sputtered atoms continuously increases within
the studied ion dose range. However, for the cases of 300 eV and 400 eV, the number of
sputtered atoms rises quickly at first and then reaches an equilibrium value at a dose of
around 1.27 × 10¹⁶ /cm2 . Combined with the results in Figure 6, we can determine that the
optimal ion parameter pair for M/G heterostructure to achieve a good-quality nanopore is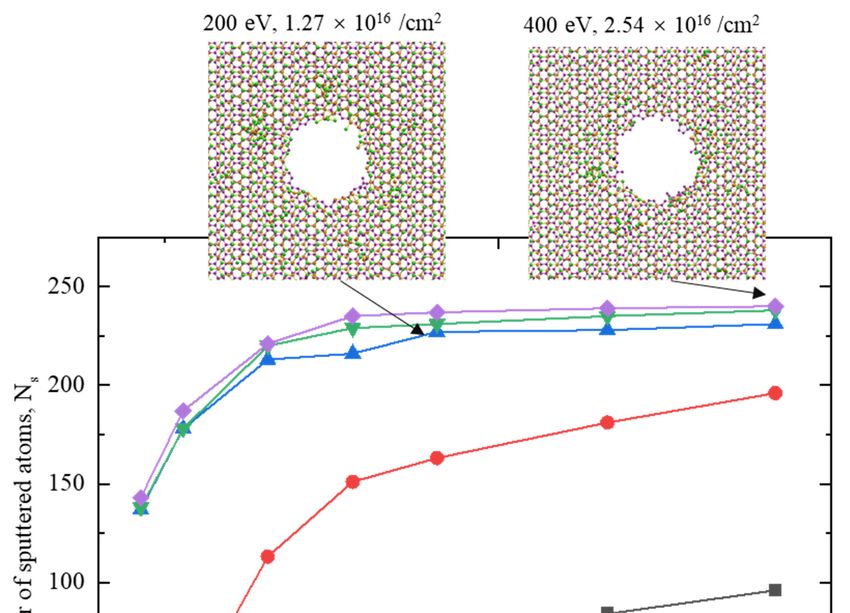
plotted in Figure 8, from which it can be seen that the number of sputtered atoms would
increase with the increase of ion irradiation energy and ion irradiation dose. For the cases
of 80 eV, 100 eV and 200 eV, the number of sputtered atoms continuously increases within
the studied ion dose range. However, for the cases of 300 eV and 400 eV, the number of
Nanomaterials 2022, 12, 196 sputtered atoms rises quickly at first and then reaches an equilibrium value at a dose of
9 of 15
around 1.27 × 10¹⁶ /cm2. Combined with the results in Figure 6, we can determine that the
optimal ion parameter pair for M/G heterostructure to achieve a good-quality nanopore
is 300 eV, 1.27 × 10¹⁶ /cm2, under which condition the influence of redundant ions on the
300 eV, 1.27 × 10¹⁶ /cm2 , under which condition the influence of redundant ions on the
equipment is minimized.
equipment is minimized.
In addition, it is observed that for most of the studied cases, the number of sputtered
In addition, it is observed that for most of the studied cases, the number of sputtered
atoms
atoms for for M/G
M/G heterostructure
heterostructure is is noticeably
noticeably smaller
smaller than
than that
that for
forG/MG/M heterostructure.
heterostructure.
This is because the graphene layer is more resistant to the ion irradiation
This is because the graphene layer is more resistant to the ion irradiation when compared when compared
to the MoS 2 layer [31,43]. For the G/M heterostructure, if the ion energy is high enough to
to the MoS2 layer [31,43]. For the G/M heterostructure, if the ion energy is high enough to
knock out
knock out the
the atoms
atoms in in graphene,
graphene, then then itit is
is highly
highly probable
probable that that the
the irradiated
irradiated ions
ions and
and
sputtered atoms can also sputter the atoms in MoS 2. However, for the M/G heterostruc-
sputtered atoms can also sputter the atoms in MoS2 . However, for the M/G heterostructure,
ture, though
even even though the irradiated
the irradiated ions canions canout
knock knock out the
the atoms atoms
in the MoS in layer
the MoS 2 layer more
more easily, the
2
residual energy of the irradiated ions and the sputtered Mo, S atoms may not bemay
easily, the residual energy of the irradiated ions and the sputtered Mo, S atoms ablenotto
be able to damage the graphene, generating the embedded
damage the graphene, generating the embedded atoms in the interlayer space, as shownatoms in the interlayer space,
as the
in shown in the
inserted inserted
figure figure8.inThe
in Figure Figure
easily 8. The easily embedded
embedded atoms alsoatoms lower also lower the
the efficiency
efficiency
for nanopore forcreation
nanopore in creation
the M/Ginheterostructure,
the M/G heterostructure,
which means which
that means
a higherthat a higher
irradiation
irradiation energy is required for nanopore
energy is required for nanopore formation in the M/G case. formation in the M/G case.
Figure 8.8. Number
Figure Number ofof the
the sputtered
sputtered atoms
atomsofofthe
theM/G
M/G heterostructure
heterostructure under
under ion
ion irradiation
irradiation with
with
different ion energies and ion doses. The inserted figure shows the cross-section enlarged view
different ion energies and ion doses. The inserted figure shows the cross-section enlarged view of the of
the irradiated heterostructure.
irradiated heterostructure.
3.4. Mechanical
3.4. Mechanical Properties
Properties of
of the
the As-Obtained
as-Obtained Heterostructure Nanopore
In actual applications,
In applications,the thenanopore
nanoporeis is
sometimes
sometimes working
workingunder loading
under conditions
loading condi-
[9,47].[9,47].
tions Thus,Thus,
the mechanical properties
the mechanical of the of
properties fabricated nanopore
the fabricated shouldshould
nanopore be investigated.
be inves-
We conducted
tigated. a uniaxiala stretching
We conducted process for
uniaxial stretching the original
process and
for the ion irradiated
original and ion G/M heter-
irradiated
ostructures,
G/M and the results
heterostructures, and theare results
shown are
in Figure
shown9,infor which9,the
Figure forconfigurations are colored
which the configurations
according
are coloredto the per-atom
according to thestress information
per-atom along the stretching
stress information along thedirection.
stretchingItdirection.
is seen that
It
is seen that for the original heterostructure, the stress value for all the atoms would rise
with the increase of tensile strain, and the structure would fracture at a random location
when the stress is large enough. For the case of a heterostructure with a nanopore, the
stress quickly concentrates around the nanopore structure under the stretching condition.
Increase of the concentrated stress leads to the fracture of the heterostructure around the
nanopore. Due to the stress concentration, the nanopore heterostructure gets fractured at a
much smaller strain when compared to the original heterostructure (ε = 0.152 vs. ε = 0.205).
For both cases, the fracture of structure starts from the top graphene layer, and the stress
value is quickly diminished with the expansion of the cracks.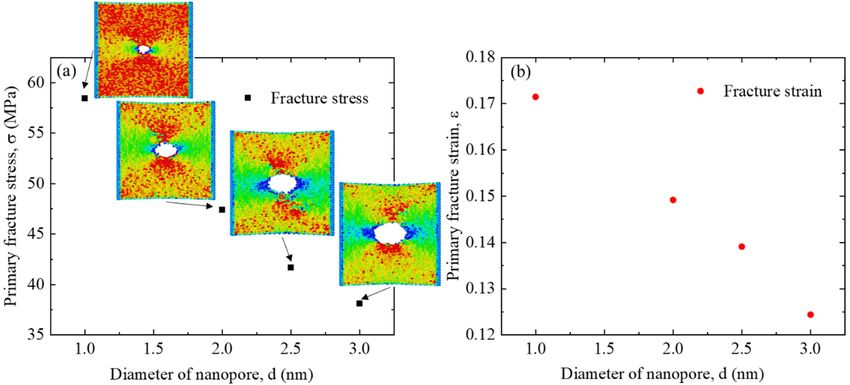
stress is large enough. For the case of a heterostructure with a nanopore, the stress quickly
concentrates
concentrates around
around the the nanopore
nanopore structure
structure under
under thethe stretching
stretching condition.
condition. Increase
Increase of of
the
the concentrated stress leads to the fracture of the heterostructure around the nanopore.
concentrated stress leads to the fracture of the heterostructure around the nanopore.
Due
Due toto the
the stress
stress concentration,
concentration, the the nanopore
nanopore heterostructure
heterostructure gets gets fractured
fractured at at aa much
much
smaller
smaller strain when compared to the original heterostructure (ε = 0.152 vs. ε = 0.205). For
strain when compared to the original heterostructure (ε = 0.152 vs. ε = 0.205). For
Nanomaterials 2022, 12, 196 both
bothcases,
cases,thethefracture
fractureof ofstructure
structurestartsstartsfrom
fromthethetop
topgraphene
graphenelayer,
layer,and andthethestress
stress10value
of 15
value
is
is quickly
quickly diminished
diminished with with the
the expansion
expansion of of the
the cracks.
cracks.
The
The stress-strain relationships of the heterostructureswith
stress-strain relationships of the heterostructures withandandwithout
withoutnanopore
nanoporeare are
plotted
plotted in
in Figure
Figure 10.
10. This
This reveals
reveals aa multi-stage
multi-stage fracture
fracture process
process for
for both
both the
the original
original het-
het-
The stress-strain relationships of the heterostructures with and without nanopore
erostructure
erostructure and the
the heterostructure with aa nanopore. As
As indicated in
in Figure 9,
9, the
the frac-
are plotted inand Figure heterostructure
10. This reveals with nanopore.
a multi-stage fracture indicated
process for Figure
both the frac-
original
ture of the structure
ture of the structure
heterostructure starts
and thestarts from the top graphene
from the top graphene
heterostructure layer, and
layer, andAs
with a nanopore. then
then the crack
the crack
indicated would
Figurestart
inwould start
9, theto
to
initiate
fracture in
initiate in the bottom
of the bottom
structure MoS
MoS 2 with the increase of tensile strain. Due to the existence of na-
2 with
starts from the
theincrease of tensile
top graphene strain.
layer, and Due
thento thethe existence
crack wouldofstartna-
nopore
nopore
to structure,
structure,
initiate the
the primary
in the bottom primary
MoS2 withtensile
tensilethefracture
fracture
increase strain
strain and
and stress
of tensile strain.at
stress the
the first
atDue first
to fracture
thefracture
existence stage
stageof
are much
nanopore smaller
are muchstructure,
smaller forfor the
thethe ion
primary irradiated heterostructure
tensile fracture
ion irradiated (0.149,
strain and(0.149,
heterostructure stress at47.2 GPa
theGPa
47.2 vs.
first vs. 0.202,
fracture 73.8
0.202,stage
73.8
GPa).
are much smaller for the ion irradiated heterostructure (0.149, 47.2 GPa vs. 0.202, 73.8 GPa).
GPa).
Figure
Figure 9.9. Snapshots
Snapshotsof
Snapshots ofofthe
theG/M
the G/M
G/M heterostructure
heterostructure
heterostructure morphology
morphology
morphology at
at different tensile
at different
different strains
tensile
tensile during
strains
strains uni-
during
during uni-
axial stretching
uniaxial stretching
axial stretching process.
process.
process. (a) Pristine
(a)(a) heterostructure.
Pristineheterostructure.
Pristine (b)
heterostructure.(b) Heterostructure
(b)Heterostructure nanopore
Heterostructure nanopore generated
nanopore generated with
generated with
with
an
an irradiation
an irradiationparameter
irradiation parameter pair pairof of200
200eV,
eV, 1.27
1.27×××10
16 /cm2. The
101616
10 /cm
/cm structures
2 . The
2. The are
structures
structures colored
areare colored
colored according to
according
according to the
to
the
per-atom
per-atom stress
stress information
information along
along the horizontal
the the
horizontal direction,
direction, and the
and and value
the value has a unit
has has
a unit of stress/(per-
of stress/(per-
the per-atom stress information along horizontal direction, the value a unit of stress/
atom
atom volume).
volume).
(per-atom volume).
..
10. Stress-strain relationship
Figure 10.
Figure relationship of the G/Mheterostructure
heterostructure with
with and
and without
without the ion
ion irradiation
Figure 10.Stress-strain
Stress-strain relationshipof
ofthe
theG/M
G/M heterostructure
16 /cm 2with and withoutthe
the ionirradiation
irradiation
process.
process. The irradiation parameters are 200 eV, 1.27 × 10 .
process. The
Theirradiation
irradiation parameters
parameters are
are 200
200eV,
eV, 1.27
1.27×× 10
1016 /cm
/cm2..
16 2
Figure 11 depicts the influence of the as-fabricated nanopore size on the mechanical
performance of the heterostructure. The ions have an irradiation parameter pair of 200 eV,
1.27 × 10¹⁶ /cm2 . Figure 11 shows that both the primary fracture stress and fracture strain
would reduce almost linearly with the increase of nanopore size. This is because the larger
size nanopore would result in a higher stress concentration factor for 2D materials [48].
The inserted figures show the stress distribution of the structure just before the fracture
happens. They clearly indicate that for the nanopore structure with a smaller size, a larger
overall stress value is required to initiate the fracture, indicating a larger strain needed at
the fracture point.performance of the heterostructure. The ions have an irradiation parameter pair of 200 eV,
1.27
1.27 ×× 10
1016 /cm
16
/cm2.. Figure
2
Figure 11 11 shows
shows that that both
both the
the primary
primary fracture
fracture stress
stress and
and fracture
fracture strain
strain
would reduce almost linearly with the increase of nanopore size.
would reduce almost linearly with the increase of nanopore size. This is because the larger This is because the larger
size
size nanopore
nanopore would would result
result inin aa higher
higher stress
stress concentration
concentration factor factor forfor 2D
2D materials
materials [48].[48].
The
The inserted figures show the stress distribution of the structure just before the
inserted figures show the stress distribution of the structure just before the fracture
fracture
Nanomaterials 2022, 12, 196 happens.
happens. They They clearly
clearly indicate
indicate thatthat for
for the
the nanopore
nanopore structure
structure withwith aa smaller
smaller size,
size, aa larger
11 of 15
larger
overall
overall stress value is required to initiate the fracture, indicating a larger strain needed at
stress value is required to initiate the fracture, indicating a larger strain needed at
the
the fracture
fracture point.
point.
Figure
Figure 12 12 shows
shows thethe influence
influence of of ion
ion energy
energy andand dose
dose on on the
the mechanical
the mechanical strength
mechanical strength of of
the M/G
the M/G heterostructure.
heterostructure. Both
M/G heterostructure. Both the
Both the increase
the increase
increase ofof ion
ion energy and ion dose would result in
of ion energy and ion dose would result in an
an
overall
overall slight
slight reduction
reduction of of the
the primary
primary fracture
primary fracture strength
strength of
strength of the
of the irradiated
the irradiated structure.
structure. This
irradiated structure. This
indicates
indicates that
that even
even though
though the
the low
low ion
ion energy
energy and
and ion
ion dose
dose only
indicates that even though the low ion energy and ion dose only result in irregular dam-only result
result in in irregular
irregular dam-
damage
age
in in
agethe the
the structure,
instructure, the
the reduction
the reduction
structure, in
in mechanical
in mechanical
reduction mechanical strength
strength is
is similar
is similar
strength to that
similar to that
toof theof
that the
the structure
ofstructure with
structure
with
awith aa nanopore.
nanopore. Therefore,
Therefore, the the influence
influence of of structural
structural damagedamageon on
the
nanopore. Therefore, the influence of structural damage on the mechanical behav- the mechanical
mechanical behav-
behavior of
ior
2D of 2D heterostructures
ior heterostructures
of 2D heterostructures needs
needs needs more
more attention. attention.
more attention.
Figure
Figure 11.11.Influence
11. Influence
Influence of
of the
of G/M
thethe
G/M heterostructure
G/M heterostructure
heterostructure nanopore size
size on
nanopore
nanopore the
size
on theonmechanical properties.
the mechanical
mechanical (a)
(a) Pri-
properties.
properties. Pri-
mary
mary fracture
fracture stress,
stress, and
and (b)
(b) primary
primary fracture
fracture strain.
strain. The
The inserted
inserted figures
figures show
show the
the per-atom
per-atom stress
stress
(a) Primary fracture stress, and (b) primary fracture strain. The inserted figures show the per-atom
distribution
distribution just
just before
before the
the fracture
fracture of
of the first
theof
first stage.
stress distribution just before the fracture thestage.
first stage.
Figure 12.
Figure 12. Influence
Influenceofof
12.Influence of the (a) irradiation energy and (b) ion dose on
on the
the primary mechanical
Figure thethe
(a) (a) irradiation
irradiation energy
energy andion
and (b) (b)dose
ionon dose
the2 primary primary
mechanicalmechanical
strength
strength
strength of
of G/M
G/M heterostructure.
heterostructure. The
The ion
ion dose
dose for
for (a)
(a) is
is 1.27
1.27 ×
× 10
10
16 /cm
16 /cm 2 and
and the
the ion
ion energy
energy for (b)
for200 is
(b)eV,
is
of G/M heterostructure. The ion dose for (a) is 1.27 × 10 16 /cm 2 and the ion energy for (b) is
200 eV, respectively.
200 eV, respectively.
respectively.
Figure 13 shows the dynamics of structural evolution of the M/G heterostructure
nanopore under ion irradiation with different irradiation parameters. It is seen that under
the parameter pair of 80 eV, 3.18 × 10¹⁵ /cm2 , there is nanopore formation only in the top
MoS2 layer, while the bottom graphene layer is undamaged, resulting in the initiation of
the crack in MoS2 layer, different from the case in Figure 9. In contrast, if we use the ion
parameter pair of 400 eV, 1.27 × 10¹⁶ /cm2 , a good-quality nanopore is formed in both the
MoS2 and graphene layers, because of which the initiation of the crack happens in graphene
layer again, similar to the case of G/M heterostructure. The phenomenon demonstratesFigure 13 shows the dynamics of structural evolution of the M/G heterostructure na-
nopore under ion irradiation with different irradiation parameters. It is seen that under
the parameter pair of 80 eV, 3.18 × 10¹⁵ /cm2, there is nanopore formation only in the top
MoS2 layer, while the bottom graphene layer is undamaged, resulting in the initiation of
Nanomaterials 2022, 12, 196 the crack in MoS2 layer, different from the case in Figure 9. In contrast, if we use the 12 ionof 15
parameter pair of 400 eV, 1.27 × 10¹⁶ /cm2, a good-quality nanopore is formed in both the
MoS2 and graphene layers, because of which the initiation of the crack happens in gra-
phene layer again, similar to the case of G/M heterostructure. The phenomenon demon-
that the damage
strates sequencesequence
that the damage of the heterostructure nanopore
of the heterostructure can be controlled
nanopore by adjusting
can be controlled by
the irradiation parameters.
adjusting the irradiation parameters.
Figure
Figure14 14plots
plotsthethestress-strain
stress-strain relationship
relationship of of the
the G/M
G/Mand andM/GM/G heterostructures
heterostructures
with the nanopore structure created by ion irradiation with the
with the nanopore structure created by ion irradiation with the same parameter pair. same parameter pair.
It It
shows that under the irradiation with a parameter pair of 80 eV, 3.18 × 10 15 /cm2 , the
shows that under the irradiation with a parameter pair of 80 eV, 3.18 × 10 /cm , the MoS2 15 2
MoS 2 layer
layer in thein the
M/GM/G heterostructure
heterostructure is severely
is severely damaged,
damaged, generating
generating a mucha much reduced
reduced
strength
strengthvalue
valueforfor the
the first
first fracture stage.However,
fracture stage. However,the thegraphene
graphene layer
layer is well
is well retained,
retained,
leading
leadingto to an increasedfracture
an increased fracture strength
strength for for
the the second
second fracture
fracture stage. stage.
For the ForG/Mthe G/M
heter-
heterostructure,
ostructure, therethereis veryis very
limitedlimited
damage damage
on the on the heterostructure
heterostructure due to thedue to the shielding
shielding effect
effect
of theofgraphene
the graphene structure.
structure. Thus,Thus,
a much a much
higherhigher
fracturefracture
strengthstrength is observed.
is observed. When theWhen
the structure
structure is irradiated
is irradiated with with a parameter
a parameter pairpair of eV,
of 400 400 1.27
eV, 1.27 1016
× 1016×/cm /cm2G/M
2, both , both G/M
and M/Gand
M/G heterostructures
heterostructures showshow similar
similar mechanical
mechanical properties
properties because
because of the
of the similar
similar structural
structural
damage
damageinduced
inducedby bythe
the ion
ion irradiation.
irradiation.
Figure 13.Dynamics
Figure13. Dynamicsof ofstructural
structural evolution of
of the
the M/G
M/Gheterostructure
heterostructurenanopore
nanopore under
under ionion irradia-
irradi-
ation
tion with
with irradiation
irradiation parametersofof(a)
parameters (a)80
80eV,
eV,3.18
3.18× 101515/cm
× 10 /cm 2 and
2 and (b)(b)
400400
eV,eV,
1.27 × 10
1.27 /cm
×1610 162/cm
. 2.You can also read