Exploring Associations Between Children's Obesogenic Behaviors and the Local Environment Using Big Data: Development and Evaluation of the Obesity ...
←
→
Page content transcription
If your browser does not render page correctly, please read the page content below
JMIR MHEALTH AND UHEALTH                                                                                                                       Filos et al

     Original Paper

     Exploring Associations Between Children’s Obesogenic Behaviors
     and the Local Environment Using Big Data: Development and
     Evaluation of the Obesity Prevention Dashboard

     Dimitris Filos1, MSc, PhD; Irini Lekka1, BSc, MSc; Vasileios Kilintzis1, BSc, MSc, PhD; Leandros Stefanopoulos1,
     BSc, MSc; Youla Karavidopoulou1, BSc, MSc; Christos Maramis1, MSc, PhD; Christos Diou2,3, MSc, PhD; Ioannis
     Sarafis3, PHO; Vasileios Papapanagiotou3, PhD; Leonidas Alagialoglou3; Ioannis Ioakeimidis4, PhD; Maria Hassapidou5,
     PhD; Evangelia Charmandari6, MD, PhD; Rachel Heimeier7, PhD; Grace O'Malley8, PhD; Shane O’Donnell9, PhD;
     Gerardine Doyle10, BSc, PhD; Anastasios Delopoulos3, MSc, PhD; Nicos Maglaveras1, MSc, PhD
     1
      Lab of Computing, Medical Informatics and Biomedical Imaging Technologies, Aristotle University, Thessaloniki, Greece
     2
      Department of Informatics and Telematics, Harokopio University of Athens, Athens, Greece
     3
      Multimedia Understanding Group, Aristotle University, Thessaloniki, Greece
     4
      Department of Biosciences and Nutrition, Karolinska University, Stockholm, Sweden
     5
      International Hellenic University, Thessaloniki, Greece
     6
      Biomedical Research Foundation of the Academy of Athens, Athens, Greece
     7
      Internationella Engelska Skolan, Stokholm, Sweden
     8
      School of Physiotherapy, Division of Population Health Sciences, RCSI University of Medicine and Health Sciences, Dublin, Ireland
     9
      Insight Centre for Data Analytics, University College Dublin, Dublin, Ireland
     10
          College of Business, University College Dublin, Dublin, Ireland

     Corresponding Author:
     Nicos Maglaveras, MSc, PhD
     Lab of Computing, Medical Informatics and Biomedical Imaging Technologies
     Aristotle University
     University Campus
     Box 323
     Thessaloniki, 54124
     Greece
     Phone: 30 2310999281
     Fax: 30 2310999263
     Email: nicmag@auth.gr

     Abstract
     Background: Obesity is a major public health problem globally and in Europe. The prevalence of childhood obesity is also
     soaring. Several parameters of the living environment are contributing to this increase, such as the density of fast food retailers,
     and thus, preventive health policies against childhood obesity must focus on the environment to which children are exposed.
     Currently, there are no systems in place to objectively measure the effect of living environment parameters on obesogenic behaviors
     and obesity. The H2020 project “BigO: Big Data Against Childhood Obesity” aims to tackle childhood obesity by creating new
     sources of evidence based on big data.
     Objective: This paper introduces the Obesity Prevention dashboard (OPdashboard), implemented in the context of BigO, which
     offers an interactive data platform for the exploration of objective obesity-related behaviors and local environments based on the
     data recorded using the BigO mHealth (mobile health) app.
     Methods: The OPdashboard, which can be accessed on the web, allows for (1) the real-time monitoring of children’s obesogenic
     behaviors in a city area, (2) the extraction of associations between these behaviors and the local environment, and (3) the evaluation
     of interventions over time. More than 3700 children from 33 schools and 2 clinics in 5 European cities have been monitored using
     a custom-made mobile app created to extract behavioral patterns by capturing accelerometer and geolocation data. Online databases

     https://mhealth.jmir.org/2021/7/e26290                                                             JMIR Mhealth Uhealth 2021 | vol. 9 | iss. 7 | e26290 | p. 1
                                                                                                                      (page number not for citation purposes)
XSL• FO
RenderX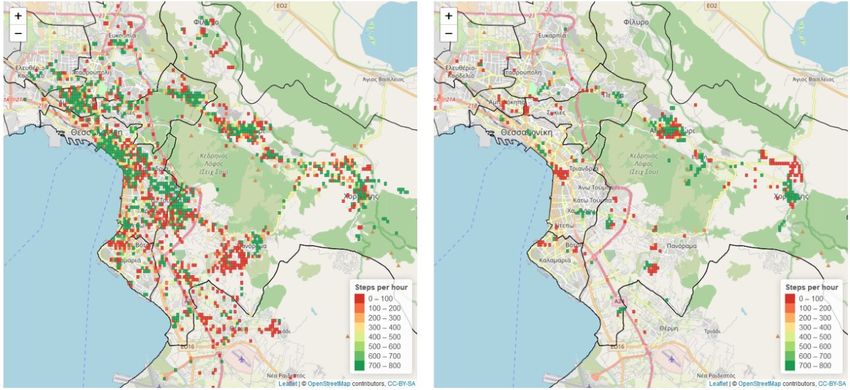
JMIR MHEALTH AND UHEALTH                                                                                                                  Filos et al

     were assessed in order to obtain a description of the environment. The dashboard’s functionality was evaluated during a focus
     group discussion with public health experts.
     Results: The preliminary association outcomes in 2 European cities, namely Thessaloniki, Greece, and Stockholm, Sweden,
     indicated a correlation between children’s eating and physical activity behaviors and the availability of food-related places or
     sports facilities close to schools. In addition, the OPdashboard was used to assess changes to children’s physical activity levels
     as a result of the health policies implemented to decelerate the COVID-19 outbreak. The preliminary outcomes of the analysis
     revealed that in urban areas the decrease in physical activity was statistically significant, while a slight increase was observed in
     the suburbs. These findings indicate the importance of the availability of open spaces for behavioral change in children. Discussions
     with public health experts outlined the dashboard’s potential to aid in a better understanding of the interplay between children’s
     obesogenic behaviors and the environment, and improvements were suggested.
     Conclusions: Our analyses serve as an initial investigation using the OPdashboard. Additional factors must be incorporated in
     order to optimize its use and obtain a clearer understanding of the results. The unique big data that are available through the
     OPdashboard can lead to the implementation of models that are able to predict population behavior. The OPdashboard can be
     considered as a tool that will increase our understanding of the underlying factors in childhood obesity and inform the design of
     regional interventions both for prevention and treatment.

     (JMIR Mhealth Uhealth 2021;9(7):e26290) doi: 10.2196/26290

     KEYWORDS
     public health authorities; childhood obesity; children’s behavior; environment; COVID-19; big data; mHealth; uHealth; intervention

                                                                           However, the local environmental context, including the local
     Introduction                                                          food environment (eg, the proximity to fast foods), and the local
     Obesity remains a major health problem worldwide, increasing          urban characteristics are particularly difficult to quantify, usually
     the risk for the development of noncommunicable diseases,             requiring extensive, expensive, and long-term studies, making
     such as diabetes, coronary heart disease, and cancer [1,2]. Its       it, until recently, extremely difficult to use those results in a
     global prevalence has increased dramatically in the last 40 years,    context-based fashion in society.
     resulting in a great economic burden for health care systems          Fortunately, the widespread adoption and maturation of new
     [3]. A concerning increase in overweight and obesity among            technologies, such as the use of mobile phones or smartwatches
     children has also been noted. In 2013, over 42 million children       [18], especially by youth, allow for the collection of a significant
     were considered overweight or obese, and approximately 70             volume of information under real-life conditions, which can
     million children will be overweight or obese by 2025 [4,5]. In        lead to the extraction of user behavioral patterns [19,20].
     Europe, the prevalence of overweight and obesity in children          Equally, the extensive use of the internet and social media has
     varies across countries [6], peaking at just over 40% [4,7].          led to the creation of open databases, such as Google Maps,
     Children with obesity are more likely to be obese until adulthood     related to the availability of certain type of places in the local
     [8], thereby increasing the risk for chronic disease development      environment. These new technologies, elsewhere referred to as
     [9,10].                                                               “mobile sensing” [21], open new horizons as a source of
     Existing evidence indicates that interventions targeting various      objective information. They allow for the more detailed
     elements of children’s behavioral patterns, such as what and          evaluation of environmental effects, not only of the immediate
     how they eat and how they move [11], in addition to the living        place of residence of the individuals, but also of the areas which
     environmental factors to which they are exposed (elsewhere            they frequent (a data collection challenge previously identified
     referred to as “ecological” parameters), can yield positive           under the term “residential fallacy effect”) [22].
     outcomes [8]. To date, the primary sources of evidence for the        The Big Data Against Childhood Obesity program [23] is a
     evaluation of childhood obesity in a given area are self-reporting    European-funded research project aiming to tackle the problem
     questionnaires, patient electronic health records, as well as a       of childhood obesity using big data collected by children using
     limited number of focused studies that use objective                  their smartphones. BigO collects and analyzes big data on
     measurements reflecting children’s behavioral patterns [8].           children’s behavior and their environment to enable public
     On a social level, certain environmental factors and                  health authorities to plan and execute effective programs
     socioeconomic parameters have been shown to be associated             addressing obesity. The BigO system has been developed as a
     with obesity in children, such as (1) the ethnicity of the            tool for public health authorities to evaluate localized obesogenic
     population [12] (pointing to a generalized genetic effect on a        behaviors at the population level and to facilitate decision
     population level but mostly toward specific socioeconomic             making as well as intervention planning through a powerful
     conditions and cultural effects [13], (2) the immediate               analytical framework and a purpose-built dashboard.
     socioeconomic environment (eg, the “neighborhood” [14],               This paper presents the Obesity Prevention Dashboard
     including the immediate proximity to fast food restaurants [15]       (OPdashboard), which has been developed in the context of the
     and the availability of exercise facilities [16]), and (3) exposure   BigO study and can be used to visually explore aggregated
     to food-related advertising [17].                                     children’s localized behaviors and environment characteristics

     https://mhealth.jmir.org/2021/7/e26290                                                        JMIR Mhealth Uhealth 2021 | vol. 9 | iss. 7 | e26290 | p. 2
                                                                                                                 (page number not for citation purposes)
XSL• FO
RenderX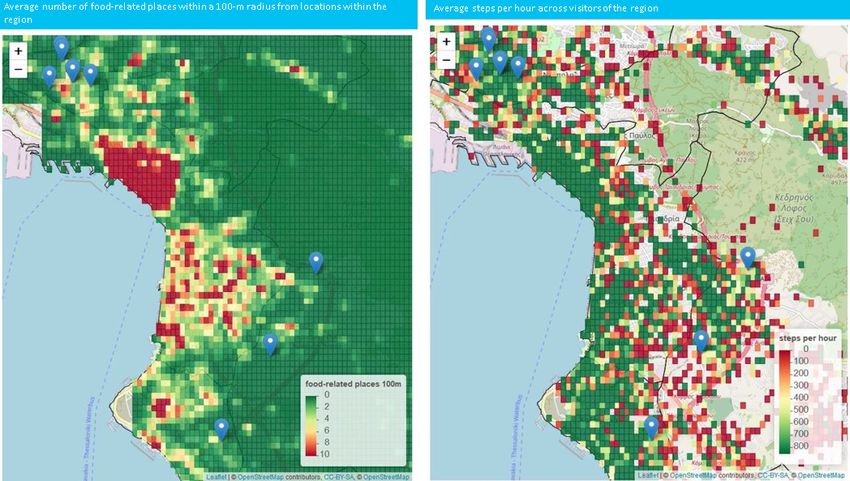
JMIR MHEALTH AND UHEALTH                                                                                                               Filos et al

     and to automatically extract associations among them. The           The geohash geocoding system [27] was adopted as a spatial
     potential users of the OPdashboard are health researchers in the    structure describing a broader geographical area, the size of
     domains of epidemiology and childhood obesity, as well as any       which varies according to the length of the codes considered.
     relevant public health agency or authority. A custom-made           In the OPdashboard, geohashes of 6 and 7 digits were used to
     mobile app was used to collect big data from participating          reflect an area of 1.22 km × 610 m and 153 m × 153 m on the
     children and adolescents in 5 different European countries (see     equator, respectively, with a reduction in width the further away
     the Data section); the extracted information has been visualized    from the equator. The aggregation to geohash level was done
     in the OPdashboard. In brief, the functionality includes: (1)       as a privacy preservation measure in order to avoid potential
     real-time monitoring and visualization of children’s behavior,      subject identification from GPS data.
     (2) extraction of associations between behavior and environment
                                                                         Per Diou et al [20], personal sensory data, such as GPS and
     in the areas close to schools, (3) evaluation of interventions as
                                                                         accelerometry, were used to extract individual indicators. The
     well as (4) the design of interventions using behavioral
                                                                         aggregated behaviors were calculated either based on the unique
     prediction models. Each of the functionalities are described in
                                                                         individuals visiting a geohash, or based on all values across the
     more detail in the OPdashboard Functionality section. In the
                                                                         visits, even if they are visits from the same individual, while
     Results section, the effect of the living environment close to
                                                                         various geohash sizes are supported through the OPdashboard.
     schools on children’s behavior is described.
                                                                         Furthermore, aggregations are also performed based on the
     Lastly, we also explored the impact of COVID-19. The                individuals living in a geohash. The rationale behind this
     emergence of the COVID-19 pandemic resulted in the adoption         approach is the “residential fallacy” effect [22], which underlines
     of measures, at a national level, to decelerate disease spread in   the importance of the nonresidential places visited in order to
     the population. Those interventions varied across countries,        estimate residential effects.
     ranging from social distancing recommendations to partial or
                                                                         In order to have a more reliable estimation of a behavior in a
     total lockdown. Data analysis based on wearable activity trackers
                                                                         geohash area, the aggregation was performed only in case more
     has shown that home confinement policies affected physical
                                                                         than 5 values were recorded there (ie, from unique visits or
     activity levels in the general population [24]. An evaluation of
                                                                         unique visitors, respectively). All data were transmitted with
     these measures, in terms of behavioral changes associated with
                                                                         end-to-end encryption and stored on secure servers. The stored
     characteristics of the local environment, may reveal additional
                                                                         data did not contain any directly identifiable information (eg,
     information to health authorities.
                                                                         names or emails).
     In addition, the effect of COVID-19–related measures
                                                                         In keeping with co-design principles, a Delphi panel was carried
     implemented in Greece on the children’s behavior is presented
                                                                         out with public health experts across Europe with a remit in
     in the Results section. The evaluation of the OPdashboard’s
                                                                         obesity prevention in order to prioritize the elements of interest
     functionality and usefulness was performed by experts in the
                                                                         (behavior and environmental and socioeconomic parameters)
     field of childhood obesity and public health policy, as described
                                                                         that should be measured and visualized as part of the
     in the Evaluation section. The OPdashboard will be made freely
                                                                         OPdashboard [28]. Proposals were then assessed based on the
     available to the scientific community via a web interface after
                                                                         feasibility of the measurements during the BigO project, and
     the conclusion of the BigO program. The expected impact of
                                                                         finally 38 behavior indicators, 40 environmental parameters,
     the OPdashboard, as well as its limitations, are discussed in the
                                                                         and 6 socioeconomic parameters were defined.
     final section.
                                                                         Behavior indicators were distinguished into two main categories.
     Methods                                                             The first category was related to eating behavior and addressed
                                                                         food consumption and frequency of visitations to food-related
     Data                                                                locations, whereas the second category was related to physical
     Within BigO, the cornerstone of the data collection process is      activity behavior and addressed the frequency of visits to
     citizen science, which is a relatively new scientific approach to   sports-related places and measurements of physical activity,
     gather big data, where the general population actively              such as number of steps per day. More information related to
     contributes to scientific research [25]. In that vein, school       the methodology adopted for the extraction of the behavioral
     students, aged 9 to 18 years, were recruited and following an       indicators based on the raw accelerometry and geolocation data
     informed parental consent process, agreed to participate in data    can be found in Papapanagiotou et al [29]. Table 1 provides a
     collection as part of citizen science projects, using a custom      subset of the behavioral indicators that have been calculated in
     mHealth (mobile health) app available for both Android and          the context of BigO. Through the OPdashboard, only aggregated
     iOS devices [26]. Several questions related to children’s daily     behaviors are presented and no individual data are available.
     mood and sleeping behavior are asked through the myBigO             Similarly, 40 environment characteristics of interest were
     app. In addition, the app allows the users to submit photos         identified and included in the BigO system (Table 2). These
     related to eating behavior. Awards, in terms of virtual badges,     broadly describe the availability of diverse type of places in a
     are provided to frequent users in order to maximize adherence       geographical region of a geohash and were collected through
     to data collection. Furthermore, objectively collected GPS and      open and online data sources [20].
     accelerometer data, via the myBigO app, were analyzed in order
     to extract aggregated population-level obesogenic behavioral        Finally, the socioeconomic characteristics of the local area were
     indicators identified within a specific geographical region [20].   also highlighted by public health obesity experts as being crucial

     https://mhealth.jmir.org/2021/7/e26290                                                     JMIR Mhealth Uhealth 2021 | vol. 9 | iss. 7 | e26290 | p. 3
                                                                                                              (page number not for citation purposes)
XSL• FO
RenderX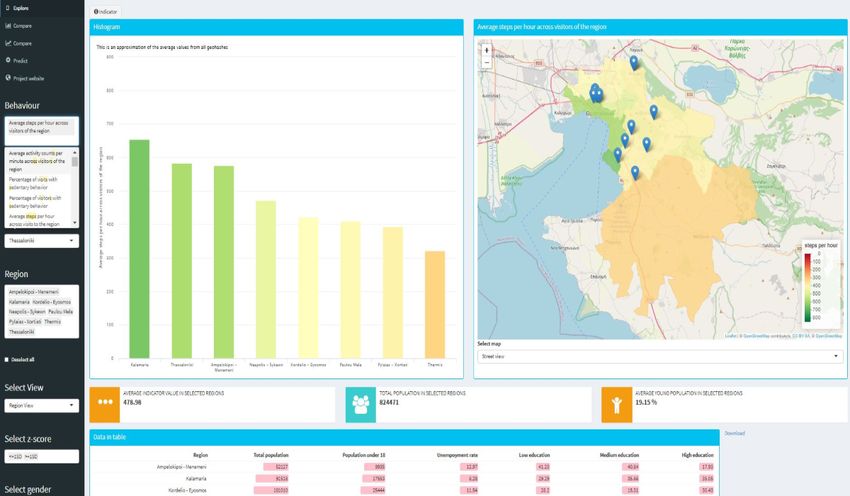
JMIR MHEALTH AND UHEALTH                                                                                                                                Filos et al

     for the evaluation of childhood obesity [13]. In this respect,                   socioeconomic factors were also considered. However, this
     taking also into account the availability of the data in a regional              information is not available at the geohash level and was thus
     level from national databases and Eurostat, a number of                          measured in the broader geographical area of a municipality.

     Table 1. A subset of the behaviors used in BigO.
      Behavior                                       How it was computed
      Average steps per hour across visits to the    For each visit to the region, take the total number of steps during the visit, as well as the duration of the
      region                                         visit and compute the average steps/hour. This behavior is the average of these values across visits (even
                                                     if they are visits from the same individual). For the computation of this indicator, only visits that last 1
                                                     minute or more are considered.
      Average steps per hour across visitors of      For each unique visitor of the region, take the total number of steps during his or her visits, as well as
      the region                                     the total time he or she spent in the region, and compute the average steps/hour. This indicator is the
                                                     average of these values across unique visitors. For the computation of this indicator, only visits that last
                                                     1 minute or more are considered.
      Percentage of visits to the region that in-    Compute the percentage of visits to the region that include at least one visit to a food-related place. For
      clude at least one visit to a food-related lo- the computation of this indicator, only visits that last 1 minute or more are considered.
      cation
      Percentage of visits that include at least one For each visit to the region, take the number of visits to an athletics or sports facility. This indicator is
      visit to an athletics or sports facility       the average across visits. For the computation of this indicator, only visits that last 10 minutes or more
                                                     are considered.
      Average daily number of steps for residents For each resident of the region, compute his or her steps using the recorded data across all the areas that
      of the region                               the resident visited. Based on this, compute his or her daily average number of steps for days with more
                                                  than 60 minutes of recorded data (days with fewer data points are discarded). This indicator is the average
                                                  of this value across the residents of the region but corresponds to the behaviors that might have happened
                                                  anywhere on the map.

     Table 2. A subset of the environmental characteristics used in BigO.
      Environmental characteristic                   How it was computed
      Number of athletics or sports facilities in    Using publicly available data sources, compute the number of athletics or sports facilities in the region.
      the region
      Number of fast food outlets in the region      Using publicly available data sources, compute the number of fast food outlets in the region.
      Average number of restaurants within a     Create a 30-meter point grid inside the region. For each point, compute the number of restaurants within
      100-meter radius from locations within the a 100-meter radius. This value is the average across all points inside the region.
      region

                                                                                      requirements were defined reflecting both the functionality
     OPdashboard                                                                      requirements and requirements relevant to the developed
     The OPdashboard is a web application for public health                           interface design.
     scientists and policy makers, which supports decision making
     and planning of localized interventions to reduce the prevalence                 According to the feedback from the focus groups, the following
     of childhood obesity. The OPdashboard is freely available and                    functionalities were recommended for integration into the
     the beta version can be accessed online [30].                                    OPdashboard:
                                                                                      •    Explore: description of aggregated local data on children’s
     Requirements
                                                                                           behaviors, socioeconomics, and environment;
     Methodologically, the development of the OPdashboard has                         •    Explain: visual comparisons between behaviors and the
     taken jointly into account (1) expert-driven predevelopment                           environment in a given area, as well as the extraction of
     requirements and (2) mid-development expert evaluation with                           associations;
     regards to relevance within the childhood obesity and public                     •    Compare: comparison of behaviors across time, which can
     health domains.                                                                       be used to monitor and evaluate an intervention;
     Based on public health experts’ knowledge, a set of mock-ups                     •    Predict: simulation of behavioral change upon changes in
     were designed. In order to ensure that the specific functionality                     an environment characteristic.
     of the OPdashboard meets the practical needs of public health                    The first version of the OPdashboard focused on the first three
     authorities, focus groups and interviews with experts in nutrition,              of these functionalities. In the future, it is anticipated that
     obesity, behavior, and public health were arranged to                            predictive models of high accuracy will be developed based on
     demonstrate and elicit feedback on the proposed functionality                    the ongoing big data collection, supporting the design of future
     of the system. Based on the presented methodology and through                    interventions.
     systematic evaluation of the collected feedback, a list of

     https://mhealth.jmir.org/2021/7/e26290                                                                      JMIR Mhealth Uhealth 2021 | vol. 9 | iss. 7 | e26290 | p. 4
                                                                                                                               (page number not for citation purposes)
XSL• FO
RenderX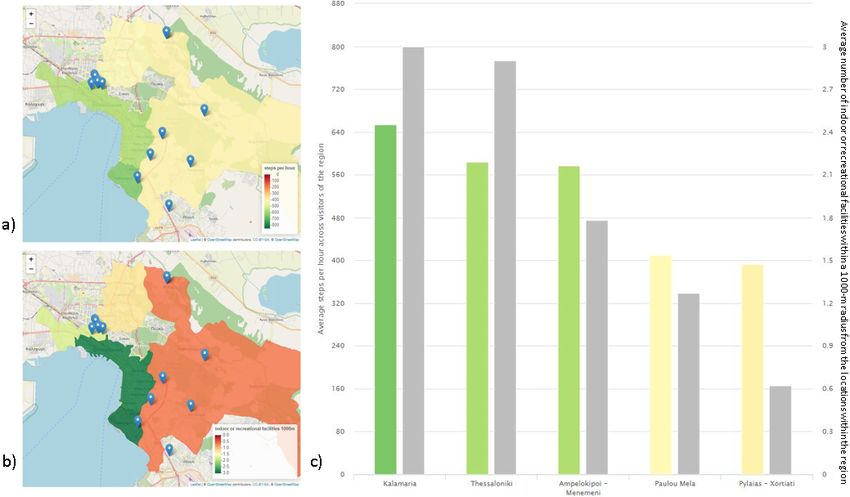
JMIR MHEALTH AND UHEALTH                                                                                                                  Filos et al

     Technical Implementation                                               Comparison in Time: The COVID-19 Paradigm
     All the data required by the OPdashboard are stored in a Mongo         The compare functionality of the OPdashboard allows for the
     database (MongoDB), which is a cross-platform                          comparison of obesogenic behaviors in different time frames.
     document-oriented database management system. A number of              These time frames represent the period before and after
     RESTful web services [31] have been developed using the Jersey         interventions that focus on the modification of obesogenic
     framework [32]. These services access the MongoDB with the             behaviors or exposure to obesogenic environments to support
     help of the MongoDB Java Driver [33], using a Mongo account            a healthier lifestyle. Due to the lack of typical obesity-related
     defined specifically for the service that is granted with the proper   interventions in the before period, mainly because of the
     set of permissions (only read/select access on specific Mongo          COVID-19 pandemic, the paradigm presented here was based
     collections). The endpoints offered by the service require             on a scenario that monitored children’s behavioral change as a
     authorization via a valid, BigO-generated, JSON (JavaScript            result of the nation-wide measures undertaken to limit the spread
     Object Notation) web token (JWT) [34].                                 of COVID-19 in Greece [38].
     The interactive web application was implemented using the R            Greece adopted strict measures to restrain the pandemic, leading
     Studio Shiny server [35]. Shiny allows simple HTML pages to            to the closure of schools on March 11, 2020, while a lockdown
     interactively execute R scripts and takes advantage of R’s             was implemented on March 23. Since the goal of the analysis
     visualizing capabilities to graphically present the analysis results   was to investigate the effect of the adopted policies on children’s
     on the webpage. In order to consolidate the user experience,           behavior, the analysis was carried out on the Greek population,
     Shiny applications can be further extended by using JavaScript         and in the city of Thessaloniki in particular, where the majority
     and jQuery. The R-script execution and the use of the analysis         of the data were collected. The target behavior was steps per
     and visualization mechanisms inside the HTML pages are                 hour since visits to specific places were prohibited during the
     controlled via the user interface–rendering engine of the Shiny        lockdown and only outdoor activity was allowed for all citizens.
     web server.
                                                                            The analysis was made for all 8 municipalities of Thessaloniki,
     Extraction of Associations                                             while the behavior for each municipality was calculated as the
     Regarding the extraction of associations between the behaviors         aggregation of all the geohashes within the boundaries of each
     and the environment, a number of studies propose that the              municipality where the behavior from at least one user was
     proximity of fast food outlets to schools may have an effect on        identified. For this analysis, 7-digit geohashes were considered.
     adolescent eating patterns and may contribute to obesity [15,36].      In this respect, the aggregated steps per hour in each
     In this respect, the analysis was based on the extraction of           municipality of Thessaloniki, before and after school closure,
     associations between the population behavior and the                   were compared. The period before was defined as ranging from
     environment close to schools. For the definition of this area,         January 8, 2020, when schools in Greece opened after the
     only the geohashes where the distance between the center of            Christmas holidays, to March 10, 2020. The after period was
     the geohash and the location of the school is less than 1000 m         defined as March 11-31, 2020. Recruitment was low after this
     were considered. For this analysis, a 7-digit geohash was used.        date, and data for the post–March 31 period was not considered
     For these areas, each behavior detected within a geohash area          in the analysis. The two-sample t test was used to investigate
     was correlated with the environmental characteristics of the           the existence of statistically significant differences in behavior
     respective geohash in order to investigate the existence of a          across time.
     correlation between them. The Pearson correlation coefficient          Predictive Models
     was computed which is defined as:
                                                                            The OPdashboard allows for the downloading of the aggregated
                                                                            behaviors at the geohash level of detail. This functionality offers
                                                                            the possibility to further analyze the data and to implement
                                                                            models that are able to predict the behavior of the population
     where X and Y denote the 2 variables, cov is the covariance, and       based on the environment. Initial works carried out by the BigO
     σ the standard deviation of a variable. The P values for the           team have used such data in order to predict children’s physical
     estimation of the statistical significance of the correlation          activity, achieving a prediction accuracy of 81% [39]. However,
     coefficients are also computed. The linear correlation analysis        the implementation of such models as well as the investigation
     is made available on the dashboard in order to provide a               of their accuracy is beyond the scope of this work. Nonetheless,
     preliminary understanding of the data.                                 such models have been integrated in the OPdashboard, offering
     It is worthy to mention that cultural and ethnic backgrounds           a visual interpretation of behavior in a city when no behavioral
     also have the potential to affect users’ behavior and their            data are available in specific regions.
     association with the environment [37], especially considering          In addition, the OPdashboard offers the possibility to design
     the case of BigO where data are distributed across different           specific interventions in a region and predict their effect on
     countries. In order to minimize the effect of possible                 certain obesogenic behaviors in children. The design of the
     confounders that can bias the results, the analysis was performed      interventions can be made graphically by modifying the
     separately for each city.                                              characteristics of the environment (eg, adding or removing
                                                                            public parks in a region), while the effect of the intervention
                                                                            can be assessed using the map view.

     https://mhealth.jmir.org/2021/7/e26290                                                        JMIR Mhealth Uhealth 2021 | vol. 9 | iss. 7 | e26290 | p. 5
                                                                                                                 (page number not for citation purposes)
XSL• FO
RenderX
JMIR MHEALTH AND UHEALTH Filos et al
OPdashboard Evaluation
Results
The OPdashboard was demonstrated to a wide audience during
the European Childhood Obesity Group Conference while a Data Overview
focus group comprising experts in public health, statistical The OPdashboard constitutes a live system, where more and
epidemiology, and clinical endocrinology was organized in more schools are added over time. By April 2020, BigO was
order to obtain feedback on the dashboard’s usability. deployed in 33 schools and 2 pediatric clinics in 5 different
After the live demonstration of the OPdashboard, the following European cities (Athens, Thessaloniki, and Larissa from Greece;
questions were posed to the experts: Stockholm from Sweden; and Dublin from Ireland) [40]. Ethical
approval was received from each country separately. Each child
• In your opinion, what is the value of the BigO system for was asked to use the myBigO app for at least 2 weeks. A steady
local population behavioral assessment? flow of recruitment was followed; however, an expected
• In your opinion, what is the value of the BigO system in decrease occurred during the summer because of the summer
discovering associations between localized behaviors and holidays and school closure. Most of the children used the app
environments? What additional steps would be necessary during the 2-week period, while a small minority continued to
to discover causal relationships? use it for more than 2 weeks
• In your opinion, which users/public authorities would most
benefit from BigO? (eg, epidemiologists, population health More than 3700 children, aged 9 to 18 years, participated in
consultants, local governments, educational policy makers) data collection, between the start of March 2018 until the end
• In your opinion, what are the main barriers for the adoption of March 2020, providing approximately 107 years of
of BigO by public health authorities? accelerometry data and 73 years of GPS data [40]. This was the
first time such an amount of big data has been collected
This discussion was recorded using a microphone, and a report contemporaneously, on an individual basis within a region,
was produced. The outcome of this focus group helped define allowing for the extraction of childhood obesogenic behavior
the improvements needed and are described in the Evaluation accurately. The majority of the schools included in the analysis
section. are located in the city of Thessaloniki, Greece, and Stockholm,
Sweden, and thus the analysis in the following sections will be
based on the schools from these cities only, as seen in Table 3.
Table 3. Details on the collected data from Thessaloniki, Greece, and Stockholm, Sweden.
Characteristic Location
Thessaloniki Stockholm
Children, n 839 671
Age (years), mean (SD) 13.5 (2.2) 15.3 (1.8)
Sex, n
Male 454 375
Female 380 265
Not available 5 31
Z-score >1 (%) 26.1 18.3
Schools, n 24 5
Accelerometer (hours) 179,969.48 78,903.17
GPS (hours) 112,624.13 225,337.67
Data Exploration Overview
OPdashboard Functionality
The main screen of the web interface is shown in Figure 1. It
In this section, the current version of the OPdashboard is
is divided into two main areas, one focusing on the selection of
presented. It focused on the data exploration (“explore”) and
the variables to be analyzed (control panel), whereas in the
the extraction of associations (“explain”) between children’s
second area the results are visualized (main panel). The available
behavior and the environment close to schools. Regarding the
selections include behavior and environmental characteristics
“compare” functionality, the analysis focused on the comparison
as well as the city of interest, in terms of the broader
of the population’s steps per hour before and after the
metropolitan area, which can be further divided into the level
implementation of national health policies due to COVID-19.
of available municipalities.
The “predict” functionality was not presented here for the
reasons made clear earlier.
https://mhealth.jmir.org/2021/7/e26290 JMIR Mhealth Uhealth 2021 | vol. 9 | iss. 7 | e26290 | p. 6
(page number not for citation purposes)
XSL• FO
RenderXJMIR MHEALTH AND UHEALTH Filos et al
Figure 1. The OPdashboard main page with the control panel (left) and the main panel (right).
Furthermore, the user can select the representation level, variables across several municipalities of the city, as well as
including the region view, where the population-aggregated between each municipality and the average value across the
value of the variable is depicted for the selected municipalities selected regions.
of the city, and the geohash view, where the aggregation is made
The map view allows user to quantify the value of each variable
at the geohash level. Filters related to the BMI z-score and
within a geographical area. This information can be depicted
gender can also be applied in order to focus on specific groups
as an aggregation of the behavior across the municipality, or it
of children. Finally, a list of regional socioeconomic information
can be represented in more detail using the geohash visualization
related to (1) the total population, (2) their educational level,
(Figure 2). Blue pins on the map highlight the location of the
(3) the percentage of young people, and (4) the unemployment
schools that have been included in the BigO pilots.
rate is also provided in a tabular format.
The coloring format used in the aforementioned visualizations
At the top of the analysis panel, the button serves as a tool ranges from red to green or vice versa, according to the type of
to provide additional information regarding the selected behavior indicator. In other words, the coloring changes from red to green
or environment characteristic, highlighting its importance as as the number of steps per hour increases. On the other hand,
well as describing how it was measured. when the small value represents a healthy state (eg, low number
of visits to fast food restaurants, low number of food outlets in
The dashboards are provided within the analysis panel, allowing
the region), then the coloring changes from green to red to
the user to have a clear overview of the indicators and their
indicate an increase in the number of food outlets in the region.
distribution across the regions. For data exploration, both bar
The maximum value for each variable was extracted either by
charts and map views are provided to the user. A tabular
a review of the literature, or derived as the 95th percentile based
representation of the socioeconomic data for the selected regions
on the collected data. In addition, the OPdashboard allows for
is provided as this information can be considered as a
a visual comparison between behaviors and/or the environment
confounder contributing to a specific behavior or environmental
through bar charts (Figure 3). The user can extract the data, in
characteristic.
a JSON format, in order to perform further analysis.
The bar charts provide in a sorted format the aggregated value
The visualization of a behavior at the geohash level of detail
in each municipality of the city. This comprehensive
was made only for those geohashes where a behavior was
visualization allows for the direct comparison of different
observed.
https://mhealth.jmir.org/2021/7/e26290 JMIR Mhealth Uhealth 2021 | vol. 9 | iss. 7 | e26290 | p. 7
(page number not for citation purposes)
XSL• FO
RenderXJMIR MHEALTH AND UHEALTH Filos et al
Figure 2. Geohash distribution of food-related locations within a 100-meter radius from each geohash (left) and the steps per hour (right) for the city
of Thessaloniki. Using mouseover, the user can access more information related to the number of contributors and the actual value in each geohash.
Note: the geohash is visible only in cases where the aggregation was based on more than 5 contributions. The visual exploration reveals the high density
of food-related places in the downtown of Thessaloniki and high activity among the children near the coastline of the city. The blue pins denote the
location of schools. Source: OpenStreetMap [41].
Figure 3. Regional representation of the steps per hour in the regions where schools are located (A) and the number of indoor recreational or sports
facilities in those areas (B). The visual comparison between the two variables reveals an association between them (C). In (C), the color of the second
indicator is set to gray in order to avoid any confusion to the user.
https://mhealth.jmir.org/2021/7/e26290 JMIR Mhealth Uhealth 2021 | vol. 9 | iss. 7 | e26290 | p. 8
(page number not for citation purposes)
XSL• FO
RenderXJMIR MHEALTH AND UHEALTH Filos et al
Associations Between the Environment and Behaviors characteristics either reflecting the availability of food stores
Close to Schools or sports-related facilities. For the second group, the analysis
was focused on the extraction of associations between the
The analysis performed here was based on the data collected in
behavior and the density of the respective places (eg, % of fast
Thessaloniki and Stockholm, where the majority of schools are
food or takeaway visits with the density of fast food or takeaway
located. In order to increase the reliability of the results, only
shops in the geohash).
the geohashes visited by more than 5 unique users or visited
more than 5 times were analyzed. Figure 4 provides a visual The OPdashboard offers automated analysis for Stockholm and
representation of the behaviors identified close to schools and Thessaloniki. The results of the Pearson correlation analysis
the respective environment in the city of Thessaloniki. Through are provided in Table 4. The results for Thessaloniki reveal the
the OPdashboard, the user can select a subset of schools in order existence of statistically significant correlations between
to focus the analysis on a specific population. physical activity levels and the availability of food stores and
sports facilities close to schools—that the higher the density of
In total, 12 behavioral indicators were analyzed. Those behaviors
these shops or facilities in an area, the greater the chances a
were categorized into two groups—the first one reflects the
child will visit them (Table 4). In other words, in Thessaloniki,
activity (eg, steps/minute or % of sedentary behavior) while the
the use of resources in the areas close to schools was high. In
second reflects the visits to a specific place (eg, % of visits to
order to explain this difference, additional confounders must
fast food places). For the first group of behaviors, the
be taken into account, such as the total population in these areas,
associations were computed based on environmental
the age of the children, and psychological factors [16].
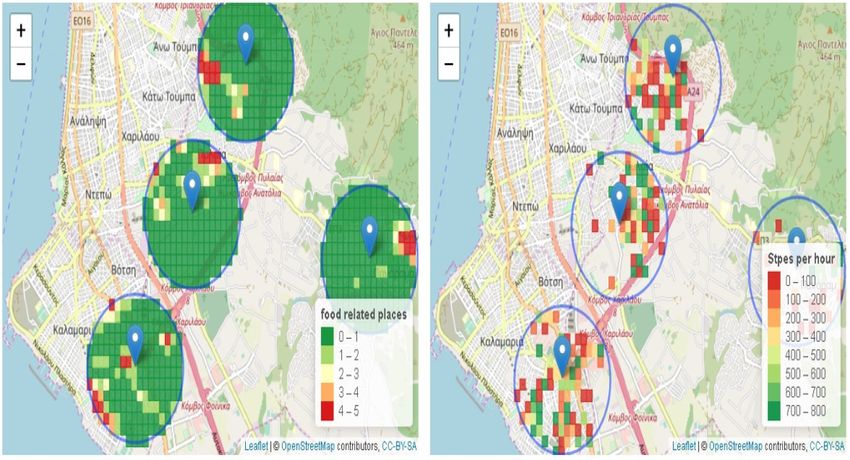
Figure 4. An area of Thessaloniki where 4 schools are located (blue pins). The blue circles (1000-meter radius) define the regions under analysis close
to schools. In the right image, the steps per hour for each geohash are depicted, whereas the density of food-related places for the same region is depicted
on the left. Visual observation of the images revealed that there should exist a correlation between the density of food-related places close to schools
and the steps per hour performed by the children in those areas. Source: OpenStreetMap [41].
https://mhealth.jmir.org/2021/7/e26290 JMIR Mhealth Uhealth 2021 | vol. 9 | iss. 7 | e26290 | p. 9
(page number not for citation purposes)
XSL• FO
RenderXJMIR MHEALTH AND UHEALTH Filos et al
Table 4. Correlation analysis for each behavior and the most relevant environmental characteristic within a 1-km radius from a school for students in
Thessaloniki (24 schools). “Food” and “Sports” are computed as the summation of all relevant environmental characteristics reflecting the availability
of food places or sports-related facilities. “Visitors” indicate the aggregation of behaviors from unique children visiting a geohash, while “visits” indicate
aggregation from all the visits to a geohash even when performed by the same children. For the areas close to schools, 281 geohashes with more than
5 unique visitors and 523 geohashes with more than 5 visits were analyzed.
Behavior and environment Thessaloniki
Correlation (CI) P value
Steps/hour (visitors)
Food 0.123 (0.006-0.237) .04
Sports 0.128 (0.011-0.241) .03
Steps/hour (visits)
Food 0.129 (0.043-0.212) .003
Sports 0.141 (0.056-0.224) .001
% visits to
Food places 0.221 (0.138-0.301)JMIR MHEALTH AND UHEALTH Filos et al
Figure 5. Effect of school closure due to COVID-19 on children’s physical activity levels. The steps per hour for the period between January 8, 2020
(opening of schools after the Christmas holidays) and March 10, 2020 (school closure) are depicted on the left, while on the right, the steps per hour
for the period between March 11 and 31 (end of data collection) is depicted. The black lines define the boundaries of each municipality in the city of
Thessaloniki. Source: OpenStreetMap [41].
Table 5. Effect of school closures on the aggregated number of steps per hour in Thessaloniki as a measure to restrain the COVID-19 pandemic.
Municipality Before After P value
Geohashes, n Average steps per hour Geohashes, n Average steps per hour
Thermis 132 163.09 7 206.07 .74
Pylaia-Chortiatis 793 379.32 275 401.90 .37
Kalamaria 81 304.20 15 160.85 .09
Thessaloniki 421 468.90 60 358.62 .03
Ampelokipoi-Menemeni 87 561.37 14 46.45JMIR MHEALTH AND UHEALTH Filos et al
One additional aspect that may affect the analysis is the who develop and deliver actions to change obesogenic factors
estimation of the lack of standardization for the characterization and reduce obesity, (2) researchers focusing on understanding
of the environment. In the BigO system, environmental obesity and the factors that influence it (eg, data scientists,
parameters such as points of interest use the data from GIS and epidemiologists), and (3) public and local educational and social
online data sources, such as Google Maps, Foursquare, and services. In addition, citizens who are interested in exploring
OpenStreetMap. However, there are big differences in this the data of their region and/or country can also benefit from the
terminology between countries. For example, fast food stores provided tools. The OPdashboard was implemented in the
offer different types of foods in Greece (healthy foods can also context of the BigO program [23], which aims to tackle the
be available in Greek fast food stores) and Sweden. If problem of childhood obesity.
international comparisons are made, the analysis that is made
Over 3700 children from more than 33 schools and 2 clinics in
through the OPdashboard must take into account the
5 European cities used a custom-made mHealth app, through
heterogeneity of classifications in environmental variables.
which accelerometry and geolocation data were recorded. The
The OPdashboard can be used for the evaluation of big data collected led to the extraction of population behaviors
interventions, through analysis made longitudinally with time, in specific geographical areas while online databases were used
or for the design of health policies through the application of for the collection of data related to the characteristics of the
predictive models. In this respect, during the focus group, it environment.
was mentioned that the users who would benefit most from the
The web interface of the OPdashboard was implemented in R
OPdashboard will be local authorities, central governments,
while RESTful web services were developed in order to access
educational policy makers, and researchers (eg, epidemiologists)
data stored in the MongoDB database. The data exploration
since these user groups play an important role in the
functionality was evaluated by a focus group, where experts in
development of effective interventions or actions to address
the field of public health, statistical epidemiology, and clinical
local childhood obesity–related issues. Finally, engaged citizens
endocrinology participated, highlighting the usefulness of such
may also find the system valuable due to high interest in
a tool for the understanding of obesity in association with the
exploring data from their region and country.
environment.
It was identified that confidentiality and privacy of data may
Our findings indicated that the greater the density of food- or
be the main barrier against the adoption of the OPdashboard,
sports-related places in the areas proximal to schools, the greater
and BigO in general, by health authorities.
the probability that children will visit them. These results
In conclusion, it was underlined that BigO, and the OPdashboard highlight the effect of the local environmental factors on
in particular, can be very helpful to public health authorities for children’s behavior, as previously documented in several studies
planning interventions and observing their effect in the local [15,16].
population.
The outbreak of the COVID-19 pandemic triggered an
assessment of children’s behavioral change as a result of the
Discussion health-related policies implemented. In this respect, the effect
Principal Findings of school closure in Greece on children’s physical activity was
studied. It was found that school closure led to an expected
The increased prevalence of obesity and overweight in children decrease in children’s physical activity in the city of
in European countries has been identified as a major public Thessaloniki. However, the decrease was statistically significant
health issue that must be addressed. Child and adolescent obesity in urban areas, while in the suburbs, the decrease was not so
can occur into adulthood and is associated with increased apparent. On the contrary, in some municipalities, an increase
morbidity and mortality. Modern technologies and their in children’s physical activity levels was observed. This finding
widespread adoption by children and adolescents can facilitate might be the result of a different mix of underlying
a better understanding of children’s obesogenic behavior, socioeconomic, cultural, and environmental factors related to
particularly those that increase the likelihood of developing obesogenic behaviors among children that was not addressed
obesity early in life. In addition, the characteristics of the in the design of this study.
environment in which children move, eat, and live can promote
obesogenic behaviors, and these must be considered in order to A recent systematic review on the use of telehealth for the
design effective localized interventions at the population level. treatment of childhood obesity was shown to be promising,
particularly for reaching rural and less accessible patients, and
In this paper, we presented the OPdashboard, which is an carefully designed mHealth interventions have the potential for
interactive tool that may be used for the extraction of improving this reach, given the increasing popularity of mobile
associations between children’s obesogenic behaviors and the devices [42]. However, the prevention of obesity, or nutritional
local environment using big data. The OPdashboard is freely disorders in general, using mHealth apps is still under
available and the beta version can be accessed online [30]. The development, with some studies evaluating the feasibility of
main functionalities of the OPdashboard include data using such apps for the prevention of nutritional disorders using
exploration, extraction of associations, evaluation of food intake metrics, activity level metrics, and questionnaires
interventions, and prediction of a behavior after an intervention. [43]. The impact of preventive interventions through advanced
The OPdashboard was implemented as a web interface for mHealth systems is expected to increase due to a lack of
potential users like (1) local health authorities and policy makers large-scale databases, a gap that our OPdashboard system tries
https://mhealth.jmir.org/2021/7/e26290 JMIR Mhealth Uhealth 2021 | vol. 9 | iss. 7 | e26290 | p. 12
(page number not for citation purposes)
XSL• FO
RenderXJMIR MHEALTH AND UHEALTH Filos et al
to close. Furthermore, given that pediatricians and other health by children. Sports activities are usually missed. In some
professionals involved in the management of childhood obesity countries such as Greece, students may not be allowed to use
appear inclined to incorporate mHealth systems into their their smartphones in school, further limiting the collection of
practice [44], we expect the OPdashboard to be adopted by the accelerometry data during the day.
medical community as is the case with the educational
Furthermore, to ensure completeness of the analysis, additional
community.
confounders affecting children’s behaviors must be studied,
The unique big data that are available through the OPdashboard which were not considered here. These cofounders include,
can lead to the implementation of models that are able to predict among others, psychological, socioeconomical, or cultural
population behavior, allowing for the design of localized factors. Additionally, the age, gender, and BMI z-score of the
interventions. The OPdashboard can be considered as a tool children was not considered in the analysis. An analysis of the
that will increase our understanding of the underlying factors type of meals based on photos taken by the children using the
in childhood obesity and the design of regional interventions myBigO app could provide more insights on children’s
both for prevention and treatment. obesogenic behaviors; however, this was out of the scope of
this study.
Limitations
Limitations include problems regarding data sparseness such Finally, another limitation of the study was the high
as missing data; lack of continuous monitoring at the individual administrative load due to the exclusive use of paper-based
level; and variations in the accuracy of the estimates, which parental consent for children’s participation, which resulted in
may lead to bias or inaccurate correlation estimates. Overcoming low participant numbers in some schools. Following the decision
these limitations is in progress. of the ethics review boards in Greece and Sweden, electronic
consent via the mHealth app, which could facilitate user
There is also an underestimation of daily physical activity as registration, was deemed inappropriate due to the young age of
the dashboard relies on smartphone-based accelerometry the participants and the sensitive nature of the collected data.
measurements, and smartphones are not carried continuously
Acknowledgments
The authors would like to thank the participating researchers of the International Hellenic University, the teachers and headmasters
of the participating schools (Internationella Engelska Gymnasiet, Ellinogermaniki Agogi Scholi Panagea Savva SA, Ekpaideftiria
N Mpakogianni, Ekpaideftiria Vassiliadi, and 23 public schools in Thessaloniki) as well as the researchers at the Biomedical
Research Foundation, Academy of Athens, for their hard work in recruiting users and assisting with data collection. In addition,
we acknowledge the pediatric obesity and public health experts from Temple Street Children’s Hospital in Dublin and Wageningen
University for their valuable feedback during the design stages of the BigO project. Finally, the authors would like to thank the
BigO consortium for their support and for addressing technical issues.
The work leading to these results was part of the European Union (EU) H2020 project, BigO: Big Data Against Childhood Obesity
(grant 727688). This project was part of the European Community's Health, Demographic Change and Well-being Programme
of EU H2020.
Conflicts of Interest
None declared.
References
1. Damasceno A. Chapter 5 Noncommunicable Disease. In: Stewart S, Sliwa K, Mocumbi A, Damasceno A, Ntsekhe M,
editors. The Heart of Africa: Clinical Profile of an Evolving Burden of Heart Disease in Africa. Hoboken, NJ: John Wiley
& Sons, Ltd; 2016.
2. Berrington de Gonzalez A, Hartge P, Cerhan JR, Flint AJ, Hannan L, MacInnis RJ, et al. Body-mass index and mortality
among 1.46 million white adults. N Engl J Med 2010 Dec 02;363(23):2211-2219 [FREE Full text] [doi:
10.1056/NEJMoa1000367] [Medline: 21121834]
3. Wang YC, McPherson K, Marsh T, Gortmaker SL, Brown M. Health and economic burden of the projected obesity trends
in the USA and the UK. The Lancet 2011 Aug 27;378(9793):815-825. [doi: 10.1016/S0140-6736(11)60814-3] [Medline:
21872750]
4. Report of the commission on ending childhood obesity. World Health Organization. 2016. URL: https://apps.who.int/iris/
bitstream/handle/10665/204176/9789241510066_eng.pdf?sequence=1 [accessed 2021-06-17]
5. Cuschieri S, Grech S. COVID-19: a one-way ticket to a global childhood obesity crisis? J Diabetes Metab Disord 2020
Nov 06:1-4 [FREE Full text] [doi: 10.1007/s40200-020-00682-2] [Medline: 33173756]
6. Lissner L, Wijnhoven TMA, Mehlig K, Sjöberg A, Kunesova M, Yngve A, et al. Socioeconomic inequalities in childhood
overweight: heterogeneity across five countries in the WHO European Childhood Obesity Surveillance Initiative (COSI-2008).
Int J Obes (Lond) 2016 May;40(5):796-802 [FREE Full text] [doi: 10.1038/ijo.2016.12] [Medline: 27136760]
https://mhealth.jmir.org/2021/7/e26290 JMIR Mhealth Uhealth 2021 | vol. 9 | iss. 7 | e26290 | p. 13
(page number not for citation purposes)
XSL• FO
RenderXJMIR MHEALTH AND UHEALTH Filos et al
7. Wijnhoven TMA, van Raaij JMA, Spinelli A, Rito AI, Hovengen R, Kunesova M, et al. WHO European Childhood Obesity
Surveillance Initiative 2008: weight, height and body mass index in 6-9-year-old children. Pediatr Obes 2013 Apr
21;8(2):79-97. [doi: 10.1111/j.2047-6310.2012.00090.x] [Medline: 23001989]
8. Lobstein T, Jackson-Leach R, Moodie ML, Hall KD, Gortmaker SL, Swinburn BA, et al. Child and adolescent obesity:
part of a bigger picture. The Lancet 2015 Jun 20;385(9986):2510-2520 [FREE Full text] [doi:
10.1016/S0140-6736(14)61746-3] [Medline: 25703114]
9. Juonala M, Magnussen CG, Berenson GS, Venn A, Burns TL, Sabin MA, et al. Childhood adiposity, adult adiposity, and
cardiovascular risk factors. N Engl J Med 2011 Nov 17;365(20):1876-1885. [doi: 10.1056/NEJMoa1010112] [Medline:
22087679]
10. Twig G, Afek A, Shamiss A, Derazne E, Landau Rabbi M, Tzur D, et al. Adolescence BMI and trends in adulthood mortality:
a study of 2.16 million adolescents. J Clin Endocrinol Metab 2014 Jun;99(6):2095-2103 [FREE Full text] [doi:
10.1210/jc.2014-1213] [Medline: 24601695]
11. Wang W, Yu Y, Wilson R, Bleich S, Cheskin L, Weston C, et al. Childhood Obesity Prevention Programs: Comparative
Effectiveness Review and Meta-Analysis. Report No.: 13-EHC081-EF. Rockville, MD: Agency for Healthcare Research
and Quality (US); 2013.
12. Ogden CL, Carroll MD, Kit BK, Flegal KM. Prevalence of obesity and trends in body mass index among US children and
adolescents, 1999-2010. JAMA 2012 Feb 01;307(5):483-490 [FREE Full text] [doi: 10.1001/jama.2012.40] [Medline:
22253364]
13. Petrauskienė A, Žaltauskė V, Albavičiūtė E. Family socioeconomic status and nutrition habits of 7-8 year old children:
cross-sectional Lithuanian COSI study. Ital J Pediatr 2015 Apr 23;41:34 [FREE Full text] [doi: 10.1186/s13052-015-0139-1]
[Medline: 25903745]
14. Ludwig J, Sanbonmatsu L, Gennetian L, Adam E, Duncan GJ, Katz LF, et al. Neighborhoods, obesity, and diabetes--a
randomized social experiment. N Engl J Med 2011 Oct 20;365(16):1509-1519 [FREE Full text] [doi:
10.1056/NEJMsa1103216] [Medline: 22010917]
15. Davis B, Carpenter C. Proximity of Fast-Food Restaurants to Schools and Adolescent Obesity. Am J Public Health 2009
Mar;99(3):505-510. [doi: 10.2105/ajph.2008.137638]
16. Gordon-Larsen P, Nelson MC, Page P, Popkin BM. Inequality in the built environment underlies key health disparities in
physical activity and obesity. Pediatrics 2006 Feb;117(2):417-424. [doi: 10.1542/peds.2005-0058] [Medline: 16452361]
17. Folkvord F, Anschütz DJ, Boyland E, Kelly B, Buijzen M. Food advertising and eating behaviour in children. Appetite
2016 Dec;107:681. [doi: 10.1016/j.appet.2016.08.038]
18. Katz RL, Felix M, Gubernick M. Technology and adolescents: Perspectives on the things to come. Educ Inf Technol 2013
May 4;19(4):863-886. [doi: 10.1007/s10639-013-9258-8]
19. Zandian M, Ioakimidis I, Bergström J, Brodin U, Bergh C, Leon M, et al. Children eat their school lunch too quickly: an
exploratory study of the effect on food intake. BMC Public Health 2012 May 14;12(1):351 [FREE Full text] [doi:
10.1186/1471-2458-12-351] [Medline: 22583917]
20. Diou C, Sarafis I, Papapanagiotou V, Ioakimidis I, Delopoulos A. A methodology for obtaining objective measurements
of population obesogenic behaviors in relation to the environment. SJI 2019 Dec 10;35(4):677-690. [doi: 10.3233/sji-190537]
21. Chaix B. Mobile Sensing in Environmental Health and Neighborhood Research. Annu Rev Public Health 2018 Apr
01;39:367-384. [doi: 10.1146/annurev-publhealth-040617-013731] [Medline: 29608869]
22. Chaix B, Duncan D, Vallée J, Vernez-Moudon A, Benmarhnia T, Kestens Y. The "Residential" Effect Fallacy in
Neighborhood and Health Studies: Formal Definition, Empirical Identification, and Correction. Epidemiology 2017
Nov;28(6):789-797. [doi: 10.1097/EDE.0000000000000726] [Medline: 28767516]
23. BigO. URL: https://bigoprogram.eu/ [accessed 2021-06-07]
24. Pépin JL, Bruno RM, Yang R, Vercamer V, Jouhaud P, Escourrou P, et al. Wearable Activity Trackers for Monitoring
Adherence to Home Confinement During the COVID-19 Pandemic Worldwide: Data Aggregation and Analysis. J Med
Internet Res 2020 Jun 19;22(6):e19787 [FREE Full text] [doi: 10.2196/19787] [Medline: 32501803]
25. Socientize Consortium. Green paper on Citizen Science for Europe: Towards a society of empowered citizens and enhanced
research. European Commission. URL: https://digital-strategy.ec.europa.eu/en/library/
green-paper-citizen-science-europe-towards-society-empowered-citizens-and-enhanced-research [accessed 2021-06-04]
26. Maramis C, Ioakimidis I, Kilintzis V, Stefanopoulos L, Lekka E, Papapanagiotou V, et al. Developing a Novel
Citizen-Scientist Smartphone App for Collecting BehavioralAffective Data from Children Populations. In: O'Hare G,
O'Grady M, O’Donoghue J, Henn P, editors. Wireless Mobile Communication and Healthcare. MobiHealth 2019. Lecture
Notes of the Institute for Computer Sciences, Social Informatics and Telecommunications Engineering, vol 320. Cham:
Springer International Publishing; 2020.
27. Geohash. URL: http://geohash.org [accessed 2021-06-07]
28. O'Donnell S, Doyle G, O'Malley G, Browne S, O'Connor J, Mars M, et al. Establishing consensus on key public health
indicators for the monitoring and evaluating childhood obesity interventions: a Delphi panel study. BMC Public Health
2020 Nov 17;20(1):1733 [FREE Full text] [doi: 10.1186/s12889-020-09814-y] [Medline: 33203390]
https://mhealth.jmir.org/2021/7/e26290 JMIR Mhealth Uhealth 2021 | vol. 9 | iss. 7 | e26290 | p. 14
(page number not for citation purposes)
XSL• FO
RenderXYou can also read


