EXPERIENCE is the difference - Dicker Data
←
→
Page content transcription
If your browser does not render page correctly, please read the page content below

EXPERIENCE
                                                                                     is the difference
                                                                                          PH: 1800 688 586
                                                                                     www.dickerdata.com.au
                                                                               investors@dickerdata.com.au
ASX ANNOUNCEMENT

25 February 2021

INVESTOR PRESENTATION

Further to the Company’s announcement to the market today on its results for the year ended 31 December 2020,
please find attached the presentation to be delivered to investors and analysts this afternoon.

Authorised for release by the Board of Dicker Data Limited.

David Dicker
Chairman and CEO

For further information please contact:

Investor Relations
1800 688 586
investors@dickerdata.com.au
https://www.dickerdata.com.au/investor
About Dicker Data

Dicker Data (ASX: DDR) is an Australian-owned and operated, ASX-listed technology hardware, software, and cloud
distributor with over 42 years of experience. Our sales and presales teams are experienced product specialists who are
dedicated to helping you tailor solutions to suit your client’s needs.

As a distributor, we sell exclusively to our valued partner base of over 6,000 resellers. We pride ourselves on developing
strong long-term relationships with our customers, and helping them grow. This customer-first approach means we are
proactive in engaging with our resellers and allows us to dynamically shift with changing market conditions, in turn
helping to increase profitability.

Dicker Data distributes a wide portfolio of products from the world’s leading technology vendors,
including Cisco, Citrix, Dell Technologies, Hewlett Packard Enterprise, HP, Lenovo, Microsoft, and other Tier 1 global
brands. As the leading Australian distributor for many of these vendors, Dicker Data is dedicated to helping our
partners deliver industry-leading solutions built on the world’s best technologies. https://www.dickerdata.com.au/

EXPERIENCE                                                                                      PH: 1800 688 586
                                                                                           www.dickerdata.com.au
is the difference                                                                    investors@dickerdata.com.au
FY20 RESULTS
PRESENTATION

               1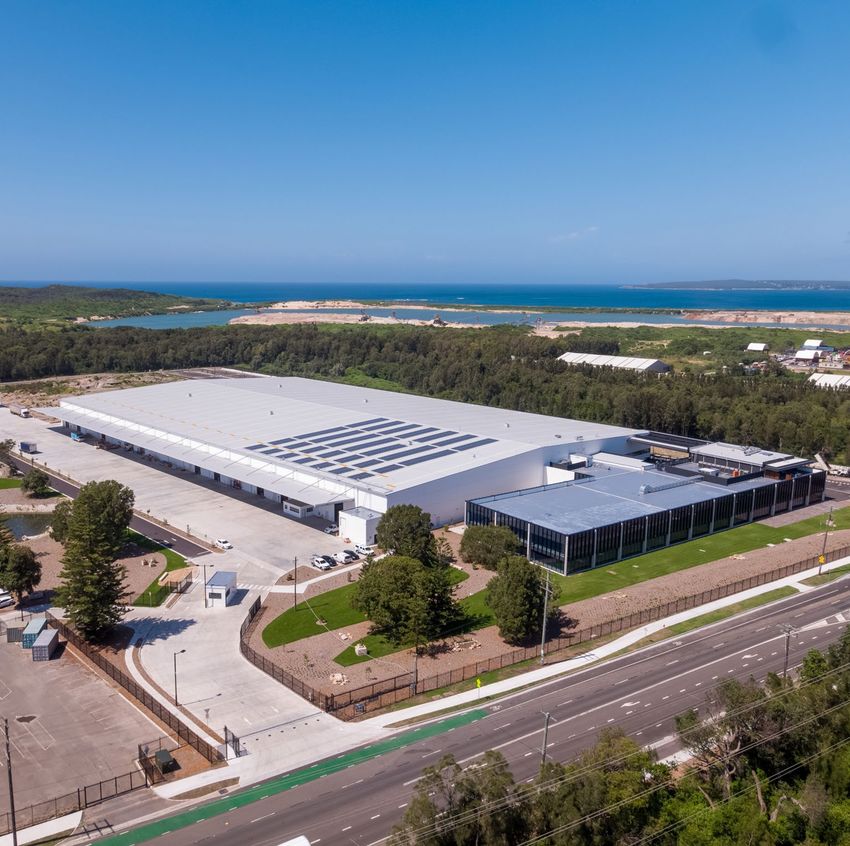
OVERVIEW
                                     #1 Corporate and Commercial IT Distributor

    ASX                  REVENUE                  CONSISTENT                  NIMBLE                 525 STAFF
   LISTED                  $2B                     GROWTH                     & AGILE                 IN ANZ

  Dicker Data       Largest Australian owned     Top and bottom-line     Our success is built on     Strong focus
Limited listed on      distributor with $2B       growth consistently    our ability to adapt &    on people, culture
  ASX in 2011            revenue in 2020           for over 20 years        change quickly.          and diversity

                                                                                                                        2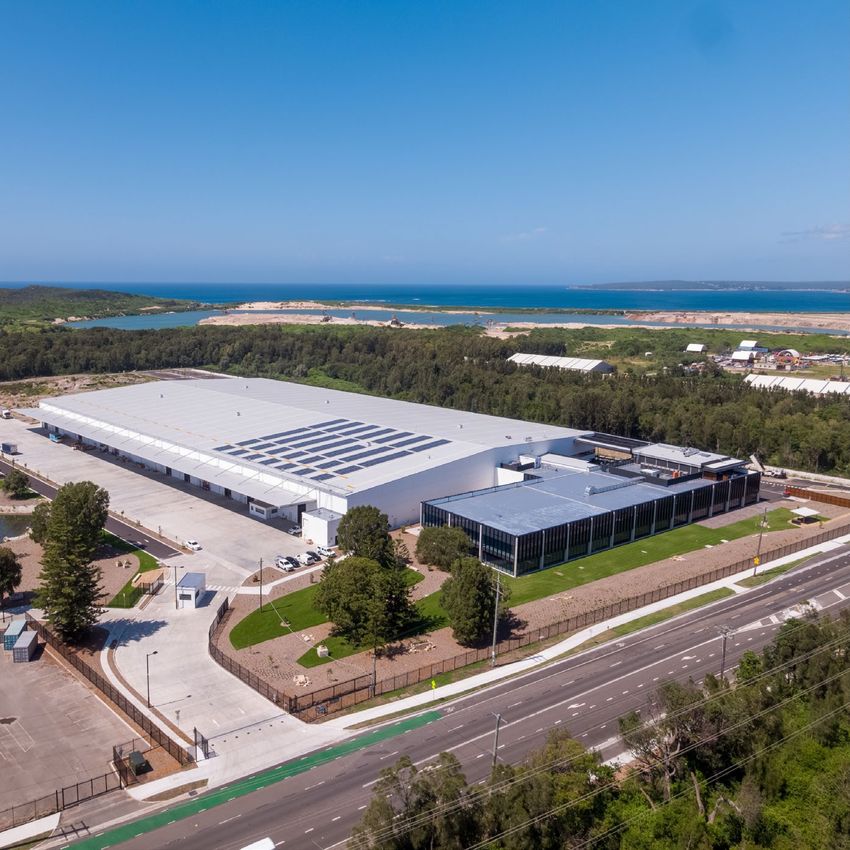
FINANCIAL
RESULTS
FY 2020
3
RESULTS
HIGHLIGHTS 27.7%
• Strong revenue growth of 13.6%, with total revenue
for the year breaking through the $2 billion
23.9%
milestone and finishing at $2,000.1m. 13.6%
• At a country level, Australia grew revenues at 12.9%
and New Zealand grew revenues at 23.3%.**
• The 8 new vendors added during FY20 accounted
for incremental revenue of $9.8m in FY20.
• Existing vendors (FY19 and prior) grew at 13.1% on
pcp, driven by increase in demand for remote
working solutions, surge in demand for virtual
capabilities and accelerated digital transformation
of businesses. REVENUE NPBT
EBITDA*
INCREASE* INCREASE*
* Excluding the impact of the sale of property and cost for the employee share scheme in 2019.
** In AUD equivalent.
4
FINANCIAL TRENDS
FY 2020
GROSS PROFIT ($m) &
REVENUE ($m)* GROSS PROFIT MARGIN (%)
9.3% 9.0% 8.9% 9.0% 9.6%
9.0%
200.0
7.0%
150.0 5.0%
1,761.3 2,000.1 100.0
191.4
3.0%
1,306.0 1,493.6 132.4 158.4 1.0%
1,185.5 50.0 109.7 117.8
-1.0%
– -3.0%
FY16A FY17A FY18A FY19A FY20A FY16A FY17A FY18A FY19A FY20A
EBITDA* ($m) NET PROFIT BEFORE TAX** ($M)
110.0
& NPBT MARGIN (%) 5.0%
4.1%
90.0 3.6% 4.0%
3.1% 3.1% 3.1%
70.0
3.0%
91.4 50.0
73.8 81.9 2.0%
45.3 48.1 54.4 30.0 64.1
36.6 40.2 46.6 1.0%
10.0
-10.0 FY16A FY17A FY18A FY19A FY20A –
FY16A FY17A FY18A FY19A FY20A
*Excludes profit on sale of property in 2019 **Excludes profit on sale of property and cost of the employee share scheme in 2019 5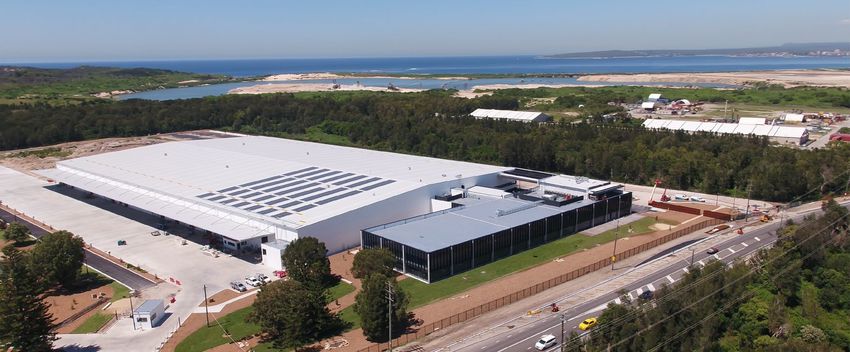
FY20 GROUP RESULTS
• Revenue growth for the group of 13.6%.
• Recurring software revenue grew 18.7%
to $435m for the full year.
12 months ($m) Dec-20 Dec-19 Increase
• Gross profit increased by 20.8% driven by
Total Revenue 2,000.10 1,761.30 13.6% growth in revenue and improved margin
as a result of increased focus on mid-
Gross Profit 191.4 158.4 20.8% market and SMB business.
• Operating costs have increased as a
Gross Margin 9.60% 9.00%
proportion of revenue to 5.1%, up from
4.9% driven mainly by increased
EBITDA* 91.4 73.8 23.9% employee costs as a result of
performance-based payments and
Operating Profit investment in new headcount.
81.9 64.1 27.7%
before tax*
• Profit before tax increased by 27.7% over
PBT margin 4.10% 3.60% the FY19 result, excluding the impact of
the sale of property and the costs of the
employee share scheme.
Net profit after tax 57.2 54.3 5.3%
*Excluding Profit on sale of property and the cost of the employee share scheme in 2019
6
FY20 RESULTS NZ
12 months ($NZD) Dec-20 Dec-19 Increase • Revenue growth of 24.0% as new
vendor relationships continue to
Total Revenue 151.8 122.4 24.0% develop.
Gross Profit 13.3 10.8 22.8% • Gross profit increased by 22.8% with
margin quality being maintained.
Gross Margin 8.8% 8.9% • Operating costs have fallen as a
proportion of revenue as the company
EBITDA 3.1 1.9 63.4% shows the benefit of increased scale
and improved operational efficiency.
Profit before tax 2.1 1.2 70.4% • Profit before tax increased 70.4% to
$2.1m.
PBT margin 1.4% 1.0%
Net profit after tax 1.4 0.9 65.4%
7
FY20 Net Assets (in $m)
Cash and equivalents
Dec-20
30.4
Dec-19
22.6
BALANCE 12 months ($m) Dec-20 Dec-19
Accounts receivable
Inventory
327.0
113.2
295.9
120.4
SHEET
Total current assets 470.6 438.9
PP&E, net 78.0 32.0
Net Working Capital ($m) 167.0 165.4 Goodwill & Intangibles 24.9 26.3
Other assets 8.4 10.3
The company has
Total assets 581.9 507.5
maintained strict Net Working Capital Days 27.3 31.3
Accounts payable 273.2 250.9
working capital discipline
through this growth Borrowings 120.0 129.9
phase whilst it onboards Debt to Equity 0.74x 1.37x Other current liabilities 20.6 22.0
new vendors and Total current liabilities 413.8 402.9
develops new business. Other long-term liabilities 6.5 9.6
Debt Service Cover Ratio 27.09x 12.59x Total Liabilities 420.3 412.5
The company’s leverage TOTAL NET ASSETS 161.6 95.1
has improved markedly
Net Tangible Assets ($m) 136.7 68.8 Shareholders' Equity
as a result of the recent
capital raising allowing Share Capital 131.8 62.5
further improvement to Reserves 0.3 0.6
the company's capital Retained earnings 29.6 31.9
structure and capacity. TOTAL EQUITY 161.6 95.1
8CAPITAL RAISING
$70.0
Debt Repayment
$60.0
SPP
• On 7 May 2020 the company completed a $50m
share placement, followed by a further $15m in a
Working Capital
Placement Fees
share purchase plan (SPP) on 5 June 2020. $50.0
• The net proceeds have been invested in the
construction of our new facility, to support the
growth of Dicker Data Financial Services, and to $40.0
paydown short term debt.
• The capital raising increased the public float in the
Capital Raising
company to approximately 33% and provides $30.0
Building Works
financing headroom to facilitate the future growth
of the company.
$20.0
Fully paid ordinary shares % 172.0m
Founder - David Dicker 35% 60.7m $10.0
Founder - Fiona Brown 32% 55.2m
DDFS
Free Float 33% 56.1m
$-
9FY20 CASH FLOW
OPEN CASH $22.6m
EBITDA $91.4m
NET INTEREST & TAX -$27.8m
WORKING CAPITAL MOVEMENT -$1.6m
OTHER -$13.7m
BUILDING COSTS -$46.0m
PAYMENT OF DIVIDENDS -$53.9m
DRAWDOWN FROM FINANCING FACILITIES $30.1m
BOND REPAYMENT -$40.0m
CAPITAL RAISED (NET) $69.3m
CLOSE CASH $30.4m
APPLICATION SOURCE
10FY20 DIVIDENDS
• Excluding the special dividend paid in
FY19, the FY20 dividend paid of 33
Payment Dividend Amount cps represents an increase from 28 cps
Record Date Type in FY19, an increase of 17.9%
Date (CPS) Franked
• Dividends include a final dividend for
15-May-20 1-Jun-20 0.0750 Interim 100% FY20 to be paid on 1 March 2021 at
10.5cps.
17-Aug-20 1-Sep-20 0.0750 Interim 100%
• In FY21 the company intends maintain
its 100% dividend policy and to
16-Nov-20 1-Dec-20 0.0750 Interim 100%
continue paying interim dividends in
quarterly instalments
15-Feb-21 1-Mar-21 0.1050 Final 100%
• The DRP will be retained for FY21.
Total 0.3300
11NEW BUILDING UPDATE
• New facility at 238 Captain Cook Drive, Kurnell NSW was completed in
February 2021.
• Warehouse space increased by over 80% to 22,965 sqm, providing space for
increased inventory holding and future technology portfolio diversification.
• Office, amenities and circulating space doubled to over 5,960 sqm.
• Dedicated configuration and staging rooms for Dicker Data’s resellers to hire.
• Dedicated training rooms and collaboration zones for use by staff, vendors
and partners.
• Dedicated spaces for showcasing our vendor technologies.
• Sustainability items include solar panels, 8 electric vehicle chargers, recycled
water systems, 30,000 new seedlings and trees planted, and large concrete
structures found during excavation have been repurposed into large outdoor
planters, adding to the overall landscaping.
• Stage two warehouse and office expansion is approved for development.
12BUSINESS
UPDATE
13COVID-19
RESPOND
• World’s biggest WFH movement.
IMPACT
• Short term panic buying.
• Internet serving humanity – personal and business.
RECOVER
• Assessing and evaluating.
• Mid-term – planning for potential 2nd wave.
MOVING INTO NEW WORLD
• Hybrid world.
• Long term sustainability and predictability.
14AUSTRALIAN IT
IT MARKET AND DISTRIBUTION MARKET SHARE
OUR STRATEGY
Consumer, Large National Retail, Corporate, Commercial, Enterprise
Other 10%
Westcon 6%
Dicker Data
• Dicker Data is the leading Value-Added Technology Distributor, selling Tech Data 4% 22%
to over 6,900 active reseller partners and MSPs who supported Arrow 4%
hundreds of thousands of Australian businesses in FY20.
• Our specialty is servicing the mid-market and SMB communities with Ingram Synnex
a specific focus on pre-sales capabilities, value-added services and Micro 28%
26%
emerging hybrid end-to-end technology solutions.
• In recent years the company has targeted distribution agreements in
software, high-end enterprise products and those that address the
cloud computing environment. Corporate, Commercial, Enterprise only
Other 13%
• The industry is going through major transformation and evolving faster
than ever. We are evolving to differentiate and offer a unique value
proposition to both vendors and reseller partners. Westcon 7%
Dicker Data
29%
• Dicker Data is perfectly positioned to assist all of it partners through the Tech Data 5%
journey of digital transformation.
Arrow 5%
Source: Publicly available 2019 financial statements and company estimates.
Ingram Synnex
Micro 18%
23%
15Dicker Data
ANZ VENDOR PORTFOLIO
16INDUSTRY RECOGNITION
Distributor of the year 2020
APC Aruba Cisco Dell Technologies HP Print
Australia & NZ Australia Australia & NZ Australia Australia
Lenovo DCG Lenovo PCG Telstra Trend Micro
Australia Australia Australia APAC
17INDUSTRY RECOGNITION
Homegrown Hardware Software Cisco Global
Distributor Distributor Distributor Distributor
of the Year of the Year of the Year of the Year
182020 VENDOR ADDITIONS
Blu Peak Cohesity Commbox Heimdal Security
Manufacturer of premium mobile Developer of back up, data Manufacturer of commercial displays Unified cyber security software
accessories including powerbanks, management and analytics software for use in a variety of business solutions for small, medium and large
IT peripherals and cabling solutions environments organisations
Signage Live Synology Tosibox Veeam
Developer of digital signage Manufacturer of specialised Manufacturer of solutions Developer of back up, disaster
management software and Network Attached Storage for secure OT networks, recovery and intelligent data
services to enable businesses to (NAS) appliances remote maintenance and management software for
get the most out of their digital network management virtual, physical and multi-cloud
display investments environments
19LONG-TERM VENDOR Major Vendor Concentration
% of Sales
RELATIONSHIPS 100.0%
10% 11%
90.0%
Vendor 5 23% 24%
Vendor 5
31%
• Dicker Data has continued to
Vendor 4
80.0% Vendor 4 39%
43% 43%
introduce new vendors to reduce Vendor 3
Vendor 3
Vendor 5 Vendor 5 49%
reliance on any single vendor. 70.0%
Vendor 2
Vendor 4 Vendor 4
Vendor 5
Vendor 2
• 8 new vendors in key strategic
Vendor 3 Vendor 3
60.0%
Vendor 4
segments were added in FY20.
Vendor 5
Vendor 5 Vendor 5
50.0%
• Top 5 vendors overall contribution
Vendor 3 Vendor 4 Vendor 5
Vendor 2 Vendor 2 Vendor 4 Vendor 4
has reduced from 90% in FY12 to 40.0%
Vendor 3
Vendor 4
51% in FY20. Vendor 1
Vendor 2 Vendor 3 Vendor 3
30.0% Vendor 1 Vendor 3
• Dicker Data will continue to assess
Vendor 2
Vendor 2 Vendor 2
technology channel market trends 20.0% Vendor 2
Vendor 1
and derive growth through strategic
Vendor 1 Vendor 1
10.0% Vendor 1
partnerships with new and existing Vendor 1 Vendor 1
Vendor 1
vendors. 0.0%
FY12 FY13 FY14 FY15 FY16 FY17 FY18 FY19 FY20
Other Vendors
20REVENUE CATEGORY
Splits and growth
HARDWARE Services SOFTWARE
by product category $11m by billing method
+39% YoY
AV/UC
$77M
+31% YoY
Networking
$244m Perpetual
$61m
-13% YoY
Peripherals Hardware &
Servers &
Virtual Services Software
$1999m*
Storage & Other -3% YoY Renewable
$226m $1492m $496m $252m
$374m $1492m +13% YoY
+7% YoY +29% YoY
+16% YoY $496m +10% YoY
Subscription
PCS
$183m
Print
$542M +34% YoY
$29m +25% YoY
+25% YoY
*Revenue from the sale of goods and services
212021 OPPORTUNITIES
INTERNET DATA DATA DATACENTRE PHYSICAL
OF THINGS MANAGEMENT SECURITY SECURITY
WFH
MOVEMENT
NETWORKING EDGE PRO AV AUTOMATED FINANCIAL
COMPUTING CLOUD SERVICES
222021 FOCUS
DICKER DATA FINANCIAL SERVICES (DDFS)
Launched in H119 to address the growing demand for as-a-
Service solutions. In FY21 we are working to accelerate the
uptake of our DDFS offerings and in turn create long-term
renewable contract-based revenues. We are assisting our
partners to win more business by differentiating their offerings
through financial services. DDFS has supported the business
with $14m in originations across 112 transactions to date,
comprised of PC (44%), Server & Storage (22%),Networking
(19%) and Software and Other (15%).
WORK FROM HOME MOVEMENT
The shift to working from home as a result of COVID-19 has
seen the digital transformation of businesses rapidly
accelerate. There is a now a large opportunity as IT
departments no longer have to secure just office
environments, but home user environments as well. These
opportunities were always on the horizon but have been
brought forward as businesses seek to thrive in the new world.
232021 FOCUS
5G
The rollout of 5G networking is accelerating the proliferation
of compute technology at the Edge, or endpoint. This is in
turn driving the next wave of data creation and presents an
opportunity for the company to capitalise on the new devices
and infrastructure required. The company is also well-
positioned to assist its customers in managing, protecting and
analysing this data. 5G will also usher in the next era of cloud
solutions that enable real-time decision making at the Edge,
further driving the consumption of cloud and the company’s
recurring revenues.
Hybrid Cloud
Organisations are adapting multi-cloud and embracing hybrid
IT strategies to enable them to move applications between
public, private and on-premise environments to increase
scalability and resiliency. However, multi-cloud, automation
and AI are complex and many of our customers will leverage
our expertise to support their projects.
242021 FOCUS
Managed Service Providers (MSP)
MSP’s are our fastest growing partner segment. We will
continue to work with our vendors to address the needs of
these partners through the delivery of cloud, storage,
infrastructure, migration, analytics and backup solutions that
suit their cyclical billing arrangements. Our role is to enable
them to own more of their customers’ IT environment and
deliver tangible business outcomes through digital
transformation.
UC/AV
Establishing a new division to become the leading distributor
for the unified communications (UC), audio visual (AV),
automatic identification and data capture (AIDC), electrical
and physical security markets. Digital signage, digital
workspaces, smart offices, collaboration and video
conferencing solutions are all areas that intersect with IT,
presenting cross-selling opportunities into these markets.
25QUESTIONS?
26THANK
YOU
27DISCLAIMER
This presentation has been prepared by Dicker Data Ltd (ACN 000 969 362). All information and statistics in this presentation
are current as at 24 February 2021 unless otherwise specified. It contains selected summary information and does not purport
to be all-inclusive or to contain all of the information that may be relevant, or which a prospective investor may require in
evaluations for a possible investment in Dicker Data Ltd. It should be read in conjunction with Dicker Data’s other periodic and
continuous disclosure announcements which are available at www.dickerdata.com.au. The recipient acknowledges that
circumstances may change and that this presentation may become outdated as a result. This presentation and the information
in it are subject to change without notice and Dicker Data is not obliged to update this presentation. This presentation is
provided for general information purposes only. It is not a product disclosure statement, pathfinder document or any other
disclosure document for the purposes of the Corporations Act and has not been, and is not required to be, lodged with the
Australian Securities & Investments Commission. It should not be relied upon by the recipient in considering the merits of Dicker
Data Ltd or the acquisition of securities in Dicker Data Ltd . Nothing in this presentation constitutes investment, legal, tax,
accounting or other advice and it is not to be relied upon in substitution for the recipient’s own exercise of independent
judgment with regard to the operations, financial condition and prospects of Dicker Data . The information contained in this
presentation does not constitute financial product advice. Before making an investment decision, the recipient should consider
its own financial situation, objectives and needs, and conduct its own independent investigation and assessment of the contents
of this presentation, including obtaining investment, legal, tax, accounting and such other advice as it considers necessary or
appropriate. This presentation has been prepared without taking account of any person’s individual investment objectives,
financial situation or particular needs. It is not an invitation or offer to buy or sell, or a solicitation to invest in or refrain from
investing in, securities in Dicker Data Ltd or any other investment product. The information in this presentation has been
obtained from and based on sources believed by Dicker Data to be reliable. To the maximum extent permitted by law, Dicker
Data Ltd makes no representation or warranty, express or implied, as to the accuracy, completeness, timeliness or reliability of
the contents of this presentation. To the maximum extent permitted by law, Dicker Data does not accept any liability (including,
without limitation, any liability arising from fault or negligence) for any loss whatsoever arising from the use of this presentation
or its contents or otherwise arising in connection with it. This presentation may contain forward-looking statements, guidance,
forecasts, estimates , prospects, projections or statements in relation to future matters (‘Forward Statements’). Forward
Statements can generally be identified by the use of forward looking words such as “anticipate”, “estimates”, “will”, “should”,
“could”, “may”, “expects”, “plans”, “forecast”, “target” or similar expressions. Forward Statements including indications, guidance
or outlook on future revenues, distributions or financial position and performance or return or growth in underlying investments
are provided as a general guide only and should not be relied upon as an indication or guarantee of future performance. No
independent third party has reviewed the reasonableness of any such statements or assumptions. No member of Dicker Data
Ltd warrants that such Forward Statements will be achieved or will prove to be correct or gives any warranty, express or implied,
as to the accuracy, completeness, likelihood of achievement or reasonableness of any Forward Statement contained in this
presentation. Except as required by law or regulation, Dicker Data assumes no obligation to release updates or revisions to
Forward Statements to reflect any changes. All dollar values are in Australian dollars ($ or A$) unless stated otherwise. The
recipient should note that this presentation contains pro forma financial information, including a pro forma balance sheet.
Contact Information:
CEO: David Dicker – David.Dicker@dickerdata.com.au
CFO: Mary Stojcevski – Mary.Stojcevski@dickerdata.com.au
COO: Vladimir Mitnovetski – Vlad.Mitnovetski@dickerdata.com.au
28You can also read