Excellent results across all businesses Guidance raised again - Roland Busch, CEO Siemens AG Ralf P. Thomas, CFO Siemens AG
←
→
Page content transcription
If your browser does not render page correctly, please read the page content below

Excellent results across all businesses
        Guidance raised again

Roland Busch, CEO Siemens AG
Ralf P. Thomas, CFO Siemens AG

Unrestricted | © Siemens 2021 | Investor Relations | Q2 Analyst Call | 2021-05-07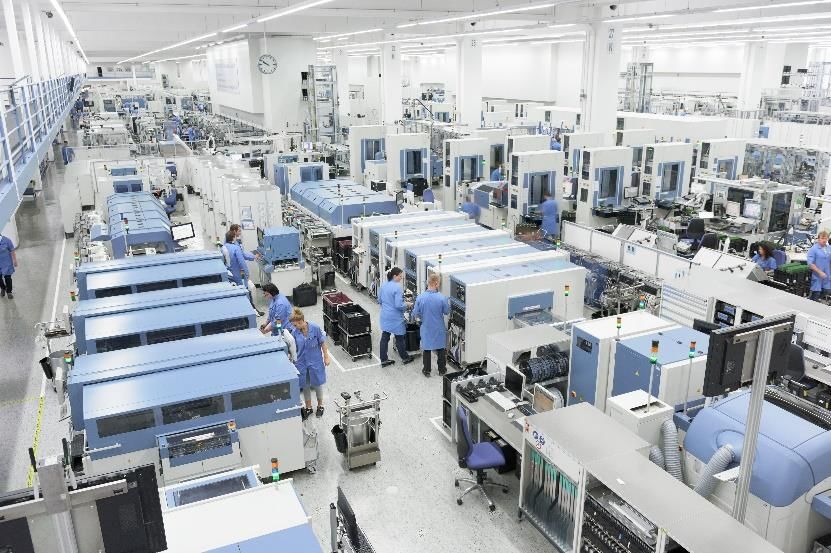
Notes and forward-looking statements

This document contains statements related to our future business and financial performance and future events or developments involving
Siemens that may constitute forward-looking statements. These statements may be identified by words such as “expect,” “look forward to,”
“anticipate,” “intend,” “plan,” “believe,” “seek,” “estimate,” “will,” “project” or words of similar meaning. We may also make forward-looking
statements in other reports, in prospectuses, in presentations, in material delivered to shareholders and in press releases. In addition, our
representatives may from time to time make oral forward-looking statements. Such statements are based on the current expectations and certain
assumptions of Siemens’ management, of which many are beyond Siemens’ control. These are subject to a number of risks, uncertainties and
factors, including, but not limited to, those described in disclosures, in particular in the chapter Report on expected developments and associated
material opportunities and risks of the Annual Report, and in the Half-year Financial Report, which should be read in conjunction with the Annual
Report. Should one or more of these risks or uncertainties materialize, events of force majeure, such as pandemics, occur or should underlying
expectations including future events occur at a later date or not at all or assumptions prove incorrect, actual results, performance or
achievements of Siemens may (negatively or positively) vary materially from those described explicitly or implicitly in the relevant forward-looking
statement. Siemens neither intends, nor assumes any obligation, to update or revise these forward-looking statements in light of developments
which differ from those anticipated.
This document includes – in the applicable financial reporting framework not clearly defined – supplemental financial measures that are or may
be alternative performance measures (non-GAAP-measures). These supplemental financial measures should not be viewed in isolation or as
alternatives to measures of Siemens’ net assets and financial positions or results of operations as presented in accordance with the applicable
financial reporting framework in its Consolidated Financial Statements. Other companies that report or describe similarly titled alternative
performance measures may calculate them differently.
Due to rounding, numbers presented throughout this and other documents may not add up precisely to the totals provided and percentages may
not precisely reflect the absolute figures.

Page 2   Unrestricted | © Siemens 2021 | Investor Relations | Q2 Analyst Call | 2021-05-07

Successful strategy execution and sustainable high performance

         While recovery from pandemic gains traction…                                                  … stringent execution is key priority

                                                                                              •   Portfolio substantially strengthened
                  Industrial production, Index: Dec 2019 = 100
            120                                                                               •   Competitiveness programs fully on track
            110                                                                +53%           •   Superior customer value by uniquely combining
            100                                                                +35%               real and digital worlds

             90
                                                                                              •   Sustainability offers excellent opportunities

             80
                                                           World          EU                  •   Pandemic as catalyst to accelerate digital
                                                           US             CN                      transformation
             70
                    01/20 03/20 05/20 07/20 09/20 11/20 01/21 03/21                           •   Excellent Q2-performance across all metrics

   •     Strong industry rebound also benefitting from re-                                    •   Maintain strong operational momentum
         stocking and focus on supply chain resilience
                                                                                              •   Prudent management of investments and risks
   •     Fiscal stimulus and accelerating vaccination to
         further boost broad based recovery                                                   •   Outlook raised again

Page 3    Unrestricted | © Siemens 2021 | Investor Relations | Q2 Analyst Call | 2021-05-07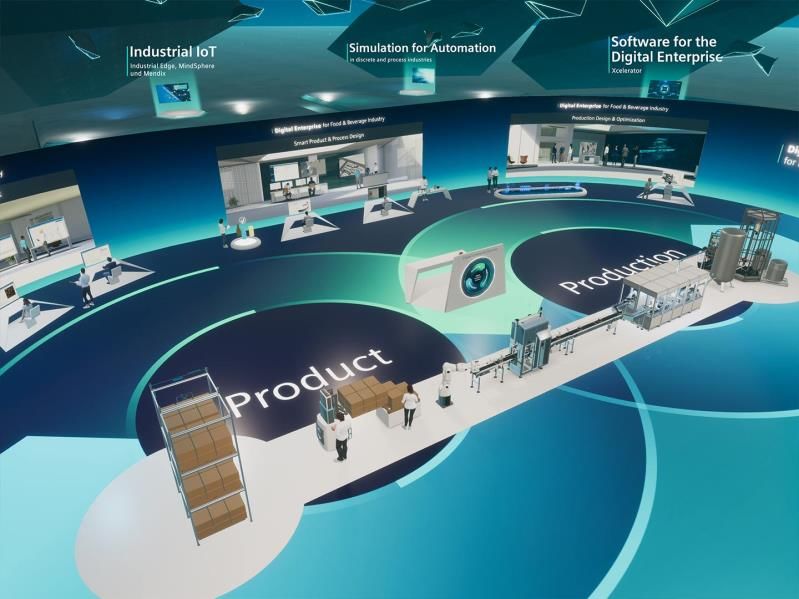
Decisive steps to shape and strengthen our portfolio

                                    Acquisition of                                                              good progress

                                               •     Closing as of April 15, 2021                          •    Both Next47 portfolio
                                               •     US$ 16.4bn purchase price                                  companies listed at NYSE
                                               •     After equity raises Siemens                           •    Continuing collaboration in
                                                     stake at 75%                                               partner ecosystem
                                               •     Strong strategic rationale                            •    Material capital gain of €0.2bn
                                               •     Synergies of at least €300m                                related to ChargePoint
                                                     p.a. in FY 2025

  Smart Infrastructure: C&S Electric acquisition in India                                    Portfolio Companies: Flender divest

                                               •     Closing as of March 1, 2021
                                                                                                            •   Closing as of March 10, 2021
                                               •     99.22% acquired for Rs. 21bn
                                                                                                            •   Sold to The Carlyle Group
                                               •     Rising LV power distribution
                                                                                                            •   Enterprise Value of €2.0bn
                                                     demand in India
                                                                                                            •   Substantial gain of €0.9bn
                                               •     Creating an export hub

Page 4   Unrestricted | © Siemens 2021 | Investor Relations | Q2 Analyst Call | 2021-05-07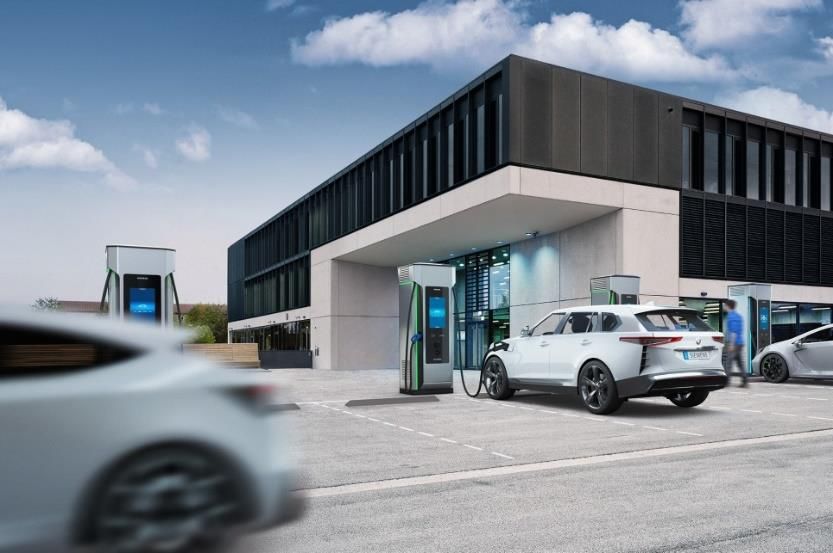
Digitalization offers tremendous opportunities – Siemens is setting the pace

  Hanover Fair – Infinite opportunities from infinite data                                         DI Software – Teamcenter is leader in PLM space

   •     Unmatched virtual experience Digital Enterprise
   •     > 22,000 visiting participants
   •     > 70 auditorium presentations
   •     > 300 tech group presentations
   •     > 90 guided live tours

                                                                                              Source: Forrester Research , Q1/2021 Report
Page 5    Unrestricted | © Siemens 2021 | Investor Relations | Q2 Analyst Call | 2021-05-07
Sustainability is core to our business – Technology with purpose

          ESG – New commitments                                               WEF Lighthouse factory Amberg       Strategic partnership

                                                                                   Leading edge               Sustainable automotive
         Sustainability at the
                                                                              technologies for growth           production through
          core of how we do
                                                                               while consuming less           digitalization & energy
              business
                                                                                     resources                       efficiency

Page 6   Unrestricted | © Siemens 2021 | Investor Relations | Q2 Analyst Call | 2021-05-07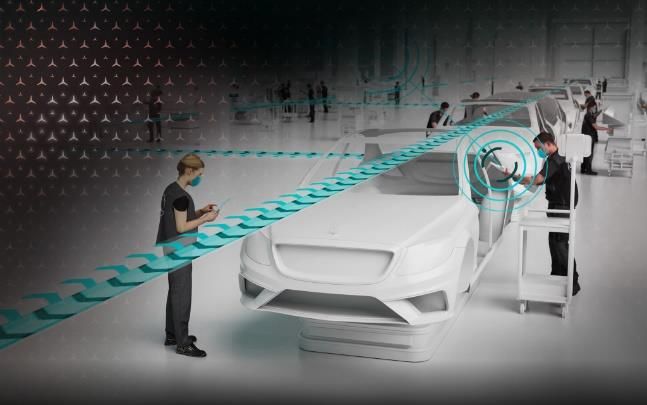
Siemens technologies deliver unique customer value

                      DI - BioNTech                                                     SI - Charging solutions   MO – New South Wales, Australia

         Accelerated production                                                 Infrastructure for zero-           Higher capacity, more
           setup for Covid-19                                                    emission public and               reliability for Sydney
                vaccine                                                           individual transport                 train network

Page 7    Unrestricted | © Siemens 2021 | Investor Relations | Q2 Analyst Call | 2021-05-07
Q2 – Excellent results across all businesses

  Orders                                                                  Revenue            IB Adj. EBITA
                                                                                             margin

         +11%                                                                +9%             15.1%
  EPS (all in)                                                            Free Cash Flow     Indust. ND/EBITDA
                                                                          (all in)

         €2.82                                                              €1.2bn             0.6x
   Note: Orders and Revenue growth comparable
Page 8   Unrestricted | © Siemens 2021 | Investor Relations | Q2 Analyst Call | 2021-05-07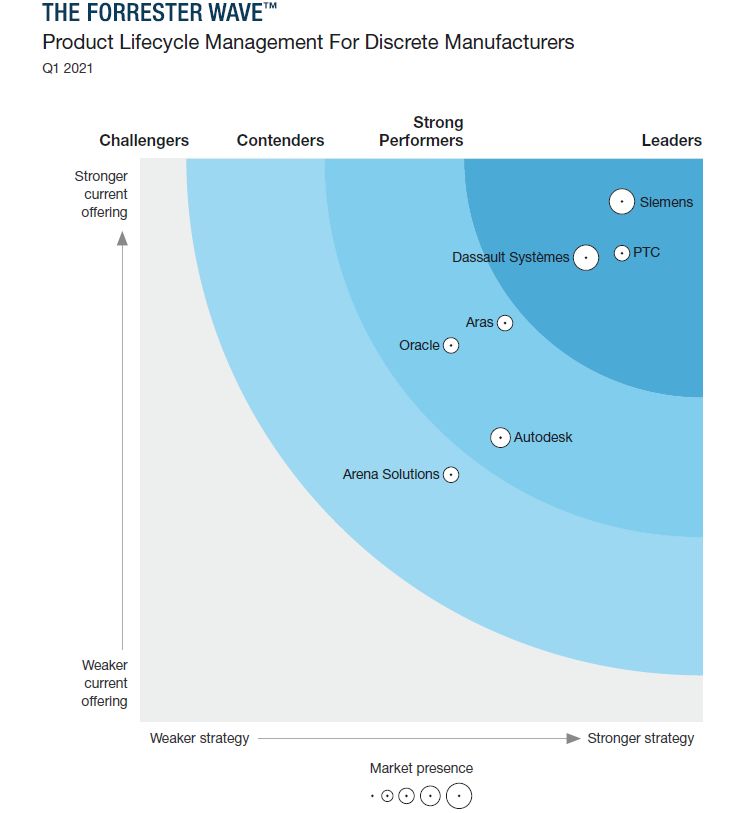
Digital Industries (DI)
Excellent performance and market share gains

                 Orders                                                Revenue                                 Orders:
 €bn                                                                                                           Ongoing recovery in key end markets
                  +8%1)                                                  +14%1)
          4.2                    4.3                                                                           Strength in short cycle automation
                                                                 3.7                     4.0
                                                                 1.0                     1.1                   Revenue:
                                                                 2.7                     2.9                   Broad based growth across all businesses
                                                                                                               China and U.S. sharply up
     Q2 FY 20               Q2 FY 21                        Q2 FY 20                Q2 FY 21
                                                                                                               EDA standing out in Software
         Adj. EBITA Margin                                      Free Cash Flow                                 Margin:
                                                         €m                                                    Strong conversion on substantial revenue growth
                                                                           +56%
                 +420bps                   17-23%                                                              Discretionary spending still on low level
                                                                                       1,015
                       22.1%                                                                                   Structural improvements ongoing
                                                                 652
 16.9%                                                                                  1.25                  Free cash flow:
         15.9%                20.1%                              1.11
                                                                                                              Extraordinary performance
    Q2 FY 20                Q2 FY 21                        Q2 FY 20                Q2 FY 21                  Effective working capital management
¹) Comparable      therein Software x.x% Adj. EBITA margin excl. severance              x.x    Cash Conversion Rate
Page 9     Unrestricted | © Siemens 2021 | Investor Relations | Q2 Analyst Call | 2021-05-07
Digital Industries (DI)
China continues to be growth driver, while Europe & US clearly catching up

            DI revenue exposure in vertical end markets                                                         Q2 FY 2021 - Key regions Automation (excl. Software)
                                                                                 Market trend1)
                                                                        As of Q1/21 As of Q2/21                         Orders +45% | Revenue +61%
          20%              Automotive                                                                                   Continued growth, PYQ easy comps (Covid-19)

                                                                                                                        Orders -3% | Revenue -3%
          15%
                          Machine Building                                                                              Ongoing recovery visible, down on tough comps

                                                                                                                        Orders +23% | Revenue -1%
          10%             Pharma & Chemicals                                                                            Recovery in orders signaling positive momentum

                                                                                                                        Orders +34% | Revenue +38%
          10%              Food & Beverage                                                                              Order growth driven by Discrete & Process

                           Electronics &                                                                                       Q2 FY 2021 - Software
          10%
                           Semiconductors
                                                                                                                        Revenue Q2 FY 2021 +11%
           5%             Aerospace & Defense                                                                           FY 2021 expected w/ clear growth vs PY

1 Y-o-Y industry revenue development based on industry production data from statistical office sources (e. g.
NBoS, US Fed, Eurostat)
Page 10     Unrestricted | © Siemens 2021 | Investor Relations | Q2 Analyst Call | 2021-05-07
Smart Infrastructure (SI)
Continuing strength in product businesses drives profitable growth
Orders Revenue
€bn Orders:
+10%1) +6%1) Products and systems significantly up
3.8 4.0 Solutions and services return to moderate growth
3.5 3.6
1.3 1.4
2.2 2.2
Revenue:
All regions up, China stands out
Q2 FY 20 Q2 FY 21 Q2 FY 20 Q2 FY 21
Products and systems businesses main driver
Adj. EBITA Margin Free Cash Flow Margin:
€m Higher capacity utilization drives profit conversion
+580bps +65%
Sustainable savings from competitiveness
463
10-15% program
11.5% 280
8.2%
11.0% 1.19 Free cash flow:
5.2% 1.52
Strong working capital management
Q2 FY 20 Q2 FY 21 Q2 FY 20 Q2 FY 21
¹) Comparable therein Products x.x% Adj. EBITA margin excl. severance x.x Cash Conversion Rate
Page 11 Unrestricted | © Siemens 2021 | Investor Relations | Q2 Analyst Call | 2021-05-07Mobility (MO)
Solid performance, expect acceleration in H2
Orders Revenue Orders:
€bn Lower volume of large orders
3%1) Pandemic related shift of projects into H2 FY 21
-8%1)
2.4 2.3 2.3 Massive acceleration in H2 expected
2.1
0.4 0.4
Revenue:
1.9 1.9
Clear growth in Rail Infrastructure
Q2 FY 20 Q2 FY 21 Q2 FY 20 Q2 FY 21 Customer Service business moderately up
Rolling Stock soft
Adj. EBITA Margin Free Cash Flow Margin:
€m Stringent execution despite pandemic related
n/a
-10bps 9-12%
7
restraints
9.5% 9.4%
-0.38
0.03 Free cash flow:
9.3% 9.2%
Shift of order related down-payments into H2
-80
Unfavorable milestone payments in Rolling Stock
Q2 FY 20 Q2 FY 21 Q2 FY 20 Q2 FY 21
¹) Comparable therein Service x.x% Adj. EBITA margin excl. severance x.x Cash Conversion Rate
Page 12 Unrestricted | © Siemens 2021 | Investor Relations | Q2 Analyst Call | 2021-05-07Below Industrial Businesses benefitting from portfolio gains
Q2 FY 21 – Performance Below Industrial Businesses Expectations for FY 2021 excl. Varian
€m Minorities • SFS: significant improvement over FY 2020, however, not at
€125m
pre-COVID-19 levels
874 2,390 • POC: positive contribution from fully owned businesses;
156 -68 -37
2,088 11 -9 -145 overcompensated by negative result of equity investment,
-12 -468 which remains volatile.
• Siemens Energy Investment: significant PPA-effects of
Therein: 1,516 ~€0.2bn still overcompensate positive operational results
-€45m Pensions
€222m ChargePoint gain
• SRE: below prior year, dependent on disposal gains
2,265 • Corporate Items & Pensions: on FY 2020 level, H2>H1
Tax Rate
@ 23.6% Flender • PPA: ~0.6bn
gain
€0.9bn • Eliminat., Corp. Treasury, Others: Lower cost versus FY
2020 level
• Tax rate: expect range of 24% to 28%
• Disc. Operations (D/O): high-triple-digit €m positive result,
IB SFS POC SE SRE Corp. PPA Elim., Tax Inc. Disc. Net
Investment Items, Corp. Cont. Ops. Income
mainly from Flender divestment
Pensions Treasury, Ops
Others
Page 13 Unrestricted | © Siemens 2021 | Investor Relations | Q2 Analyst Call | 2021-05-07Free cash flow
Sharp improvement towards consistent cash conversion
Free Cash Flow – Industrial Businesses
€m +91%
Excellent cash performance on higher profit and
3,612
improved operating working capital management
1,891 2,144
1,468 0.86
0.61 0.69 1.03 All businesses with cash conversion ahead of
H1 FY 20 Q1 FY 21 Q2 FY 21 H1 FY 21 1-growth target, except Mobility
Free Cash Flow – All in
€m
Strong cash focus across Siemens yields results
>100%
0.65 0.51 2,187 Substantial tax payments in Q2
0.10 972 1,215
0.56
178
H1 FY 20 Q1 FY 21 Q2 FY 21 H1 FY 21
Page 14 Unrestricted | © Siemens 2021 | Investor Relations | Q2 Analyst Call | 2021-05-07Siemens Healthineers completed acquisition of Varian on April 15, 2021
• Accelerating Healthineers' impact on global healthcare
Transformative
• Establishing a strong player along the entire cancer care continuum
Combination
• Supporting Healthineers “Upgrading” strategy
• As indicated, financed through a combination of debt and equity
Deal
• Siemens Healthineers equity raise of in total €5bn
Financing
• Siemens placed bonds of $10bn at very favorable conditions; intercomp. loan at arms length
• Siemens’ shareholding in Siemens Healthineers diluted from 85% to 75%
• Clear commitment to current rating and deleveraging actions
Impact on Siemens
• Mid-term value accretion based on strong strategic rationale and financial profile
• At least €300m synergies in FY 2025
Page 15 Unrestricted | © Siemens 2021 | Investor Relations | Q2 Analyst Call | 2021-05-07Outlook FY 2021 raised again
FY 2021 Siemens Group FY 2021 Framework Businesses
• Book-to-bill >1
Comparable Adj. EBITA margin
• Comparable revenue growth revenue growth expectation
of 9 – 11% (previous mid to high-single digit)
• Net income of €5.7 – €6.2bn Digital Industries 9 – 11% 20 – 21%
(previous: Clear) (previous: 19 – 20%)
(previous €5.0 – €5.5bn)
€bn 6.2 Smart Infrastructure 5 – 7% 11 – 12%
(previous: Moderate) (previous: 10.5 – 11.5%)
5.7
4.2 Mobility Mid-single digit 9.5 – 10.5%
As previously, this outlook excludes burdens from legal and regulatory issues and
effects in connection with Siemens Healthineers’ acquisition of Varian Medical
FY 2020 FY 2021
Systems, Inc.
Net Income Net Income
Page 16 Unrestricted | © Siemens 2021 | Investor Relations | Q2 Analyst Call | 2021-05-07Appendix Page 17 Unrestricted | © Siemens 2021 | Investor Relations | Q2 Analyst Call | 2021-05-07
Siemens Financial Services (SFS)
Outstanding SFS profitability given still uncertain market environment

                          Earnings before taxes (EBT)

  €m
                           FY 2020:                                           H1 FY 2021:                Continuing recovery of SFS profitability
                          RoE: 11.7%                                          RoE: 17.0%
                                                                                                         Extraordinarily strong performance of Debt
                                                                                                         Business
       212                                36                                                    156
                                                                                                         Solid contribution from Equity Business (€26m)
                        93                                   4               117
    Q1 FY20        Q2 FY 20          Q3 FY 20          Q4 FY 20          Q1 FY 21             Q2 FY 21

                                         Total assets

  €bn

                                                                                                         Increase in total assets compared to prior
      29.7            30.1              29.2              28.9              28.4               29.1
                                                                                                         quarter, driven by FX effects

    Q1 FY20        Q2 FY 20          Q3 FY 20          Q4 FY 20          Q1 FY 21             Q2 FY 21

Page 18   Unrestricted | © Siemens 2021 | Investor Relations | Q2 Analyst Call | 2021-05-07
Net debt bridge
Q2 FY 2021
Ind. Net Debt/
EBITDA (c/o)
in €bn Operating Activities 0.6x
(Q1 FY21: 1.1x)
therein:
• ∆ Inventories -0.0 therein:
27.5 • ∆ Trade and other receivables -0.0 • Payout Dividends -2.8
26.4 4.9
• ∆ Trade payables +0.4 • FX revaluation from debt
21.6
• ∆ Contract Assets/Liabilities -0.2 denom. in foreign currency -1.1
• SHS capital increase +2.3
• Flender +1.6
1.5 0.2 -0.5 -0.1
Net Debt Cash flows from ∆ Working Capital Cash flows from Financing and Net Debt Net Debt Ind. Net Debt
Q1 2021 operating activities investing activities other topics Q2 2021 adjustments Q2 2021
(w/o ∆ working capital)
Q2 ΔQ1
Cash & • SFS Debt +25.4 +0.6
cash equiv. Cash &
cash equiv. • Post emp. Benefits -3.3 +1.7
€15.21) • Credit guarantees -0.5 +0.1
€24.9bn2)
Note: Fair value adj. (hedge accounting) as of Q2 2021 reported within Net Debt. Therefore, Net Debt Q1 2021 restated.
1) Sum Cash & cash equivalents of €14.0bn and current interest bearing debt securities of €1.2bn
2) Sum Cash & cash equivalents of €23.7bn and current interest bearing debt securities of €1.2bn
Page 19 Unrestricted | © Siemens 2021 | Investor Relations | Q2 Analyst Call | 2021-05-07Provisions for pensions further improved in Q2, mainly due to increase of discount
rate and extraordinary fundings
Q FY 2020 – Pensions and similar obligations
FY FY Q1 FY Q2 FY Q3 FY Q4 FY Q1 FY Q2 FY
in €bn¹
2018 2019 2020 2020 2020 2020 2021 2021
Defined benefit obligation (DBO)² -35.9 -40.3 -39.2 -33.4 -35.7 -35.8 -37.1 -35.6
Fair value of plan assets² 28.7 31.3 31.2 26.7 28.4 30.0 32.5 32.7
Provisions for pensions and similar
-7.7 -9.9 -8.6 -7.5 -7.9 -6.4 -5.0 -3.3
obligations
Discount rate 2.4% 1.3% 1.5% 1.8% 1.3% 1.1% 0.7% 1.2%
Interest income 0.5 0.6 0.1 0.1 0.1 0.1 0.1 0.1
Actual return on plan assets 0.4 3.2 -0.5 -1.6 2.3 0.1 1.7 -0.3
1) All figures are reported on a continuing basis
2) Difference between DBO and fair value of plan assets additionally resulted in net defined benefit assets (Q2 2021: +€0.5bn); DBO including other post-
employment benefit plans (OPEB) of -€0.4bn
Page 20 Unrestricted | © Siemens 2021 | Investor Relations | Q2 Analyst Call | 2021-05-07Q2 FY 2021 Profit Bridge from SHS disclosure to SAG disclosure
Different profit definitions at SHS and SAG to be considered in models
in €m
disclosure (as of May 3, 2021) disclosure (as of May 7, 2021)
17.8%
16.8% 17.1%
704
666 15.0%
679 25
-19 14
-25 42
-27 595 27
EBIT Transaction, Severance Amortization, EBIT PPA effects Financial Consolidation Adj. EBITA Severance Adj. EBITA
(adjusted) integration, depreciation (as reported) Income and accounting (as reported) (excl. severance)
retention and other differences
and carve- effects from
out costs IFRS 3 PPA
Margin adjustments
Page 21 Unrestricted | © Siemens 2021 | Investor Relations | Q2 Analyst Call | 2021-05-07H1 FY 2021 (YTD) Profit Bridge from SHS disclosure to SAG disclosure
Different profit definitions at SHS and SAG to be considered in models
in €m
disclosure (as of May 3, 2021) disclosure (as of May 7, 2021)
17.9%
17.2% 17.7%
16.3%
1,404 1,386
-23 1,349
-37 1,278 -20 24 37
-66 66
EBIT Transaction, Severance Amortization, EBIT PPA effects Financial Consolidation Adj. EBITA Severance Adj. EBITA
(adjusted) integration, depreciation (as reported) Income and accounting (as reported) (excl. severance)
retention and other differences
and carve- effects from
out costs IFRS 3 PPA
Margin adjustments
Page 22 Unrestricted | © Siemens 2021 | Investor Relations | Q2 Analyst Call | 2021-05-07Outlook as presented by Siemens
Healthineers on May 3, 2021
Outlook 2021 raised due to stronger operational business,
updated rapid antigen assumption and H2 Varian contribution
Comparable revenue growth 1,3 Adj. basic EPS2,3 (€)
Comp. 4 adj. Adj. EPS
14% to 17% EPS growth: ~16% to ~28% growth ex-FX: ~24% to ~34%
1.90 to 2.05
8% to 12% 1.63 to 1.82
2021E Old 2021E New 2021E Old 2021E New
• Higher growth from updated revenue assumption for rapid antigen tests, • Higher EPS from higher revenue growth and H2 Varian contribution
and improved outlook for Imaging and Advanced Therapies • Diagnostics margin to exceed 10% (before: >7%)
o Imaging to grow above 8% (before: ≥7%) • Unchanged assumptions vs. previous outlook: Imaging to improve
o Diagnostics to grow above 25% (before: at least mid-teens), adj. EBIT margin ~100 bps y-o-y, Advanced Therapies to keep
assumption for rapid antigen test sales updated to ~€750m industry leading margins and tax-rate at 27% to 29%
o Advanced Therapies to grow above 7% (before: ≥6%)
• Expected Varian adj. EBIT margin in H25 of 12% to 14%
• Expected Varian revenue contribution in H25 of €1.2bn to €1.4bn • Adj. financial income net 6 for the group expected at -€50m to -€70m
• Varian revenue contribution not included in comparable growth rate • Varian transaction EPS-accretive within FY21 vs. previous outlook7
1 Year-over-year on a comparable basis, excluding currency translation and portfolio effects as well as effects in line with reva luation of contract liabilities from IFRS 3 PPA |
2 Adjusted for expenses for portfolio-related measures, and severance charges, for EPS net of tax and calculated for FY2021 with 1,100m av. shares outstanding | 3 The outlook
is based on certain assumptions , see Half-year Financial Report 2021 | 4 Excl. y-o-y effects from FX and from share count dilution | 5 Preliminary estimates due to Q2 FY2021
uncertainties from harmonization of accounting methods | 6 Adjusted for transaction-related costs within financial income net | 7 Share count in previous outlook at 1,072m, Unrestricted © Siemens Healthineers AG, 2021 l 15
new outlook for FY21 at 1,100m av shares outstanding; share count as of March 25 th at 1,128m, Varian expected to be EPS-accretive within 12 months on 1,128m shares
Page 23 Unrestricted | © Siemens 2021 | Investor Relations | Q2 Analyst Call | 2021-05-07Varian transaction effects as reported by Siemens Healthineers on May 3rd
Post-closing transaction details
Post-closing transaction details
▪ Reporting as a new segment, fully transparent to capital markets
Reporting & ▪ Harmonization of accounting methods, e.g. in revenue recognition
Outlook ▪ H2 FY21 (Apr 15 - Sep 30) incorporated into outlook for FY21, view on FY22 and beyond at capital market
▪ Reporting as a new segment, fully transparent to capital markets
day in autumn
Reporting & ▪ Harmonization of accounting methods, e.g. in revenue recognition
Outlook ▪ H2 FY21 (Apr 15 - Sep 30)1incorporated into outlook for FY21, view on FY22 and beyond at capital market
▪ Transaction-related
day in autumn costs in H2 FY21 expected at ~€0.2bn to ~€0.3bn (to be eliminated in adj. EBIT 2 and
Transaction- in adj. EPS2)
related costs ▪ Therein ~€0.1bn from the valuation of a deal contingent forward, expected to negatively impact financial
& PPA ▪ Transaction-related
income net in Q3 FY21 (to1 be
costs in H2 FY21 expected
eliminated in adj. at
EPS~€0.2bn
2) to ~€0.3bn (to be eliminated in adj. EBIT 2 and
Transaction- ▪
in
PPAadj. EPS2)3 estimated at ~€0.5bn to ~€0.7bn p.a.
effects
related costs ▪ Therein ~€0.1bn from the valuation of a deal contingent forward, expected to negatively impact financial
& PPA income net in Q3 FY21 (to be eliminated in adj. EPS2 )
▪▪ PPA effects 3 estimated at ~€0.5bn to ~€0.7bn p.a.
Impact on tax-rate for FY21 expected to be not material
Tax &
Financing ▪ Financial income net expected to be impacted by ~€25m to ~€30m interest expenses p.a. in the coming
fiscal years (~0.3% p.a. on a total loan volume of $10bn) 4
▪ Impact on tax-rate for FY21 expected to be not material
Tax &
▪ Financial income net expected to be impacted by ~€25m to ~€30m interest expenses p.a. in the coming
Financing
1 Includes transaction, integration, retention, severance charges and transaction -related costs within financial income | 2 Further explanations4regarding our financial key
fiscal
performance indicators see chapter “A.2 Financial yearssystem“
performance (~0.3% p.a. on
in the Annual a2020
Report total | 3 loan volume
Amortization, of $10bn)
depreciation and other effects from IFRS 3 purchase price Q2 FY2021
allocation adjustments | 4 Volume-weighted average interest rate, for further explanations see Note 4 “Financial instruments” in the Half- year Financial Report 2021 Unrestricted © Siemens Healthineers AG, 2021 l 14
Page 24 1 Includes transaction,
Unrestricted | © Siemens integration,
2021 |retention,
Investorseverance charges
Relations | Q2and transaction
Analyst Call-related costs within financial income | 2 Further explanations regarding our financial key
| 2021-05-07
performance indicators see chapter “A.2 Financial performance system“ in the Annual Report 2020 | 3 Amortization, depreciation and other effects from IFRS 3 purchase price Q2 FY2021
allocation adjustments | 4 Volume-weighted average interest rate, for further explanations see Note 4 “Financial instruments” in the Half- year Financial Report 2021 Unrestricted © Siemens Healthineers AG, 2021 l 14Financial calendar
May 10-12, 2021 June 10, 2021 June 25 - 30, 2021
Virtual Q2 JP Morgan Post CMD
Roadshow Conference roadshow
May 7, 2021 June 24, 2021 August 5, 2021
Q2 Earnings Capital Market Q3 Earnings
Release Day Release
Page 25 Unrestricted | © Siemens 2021 | Investor Relations | Q2 Analyst Call | 2021-05-07Investor Relations
Internet: www.siemens.com/investorrelations
E-Mail: investorrelations@siemens.com
Telephone: +49 89 636-32474
Fax: +49 89 636-1332474
Page 26 Unrestricted | © Siemens 2021 | Investor Relations | Q2 Analyst Call | 2021-05-07You can also read


