Evaluation on the phenotypic diversity of Calamansi (Citrus microcarpa) germplasm in Hainan island
←
→
Page content transcription
If your browser does not render page correctly, please read the page content below
www.nature.com/scientificreports
OPEN Evaluation on the phenotypic
diversity of Calamansi (Citrus
microcarpa) germplasm in Hainan
island
Yong‑Hui Xin1,2, Yuan‑Xin Wu1,2, Bin Qiao3, Long Su3, Shang‑Qian Xie1,2* & Peng Ling1,2*
Calamansi or Philippine lime (Citrofortunella macrocarpa) is an important crop for local economic in
Hainan Island. There is no study about Calamansi germplasm evaluation and cultivar development.
In this study, Calamansi data were collected from 151 of Calamansi seedling trees, and 37 phenotypic
traits were analyzed to investigate their genetic diversities. The cluster analysis and principal
component analysis were conducted aiming to provide a theoretical basis for the Calamansi genetic
improvement. The results of the diversity analysis revealed: (1) the diversity indexes for qualitative
traits were ranged from 0.46–1.39, and the traits with the highest genetic diversity level were fruit
shaped and pulp colored (H′ > 1.20); and the diversity indexes for quantitative traits ranged from
0.67–2.10, with the exception of a lower in fruit juice rate (1.08) and lower in number of petals (0.67).
(2) The clustering analysis of phenotypic traits have arranged the samples into 4 categories: the first
group characterized by fewer flesh Segment number per fruit (SNF) and more Oil cell number (OCN);
the second group had 7 samples, all characterized with larger Crown breadth (CB), higher Yield per
tree (YPT), the lager leaf, the higher Ascorbic acid (AA), and less Seed number per fruit (SNPF); the
third group had 25 samples characterized by smaller Tree foot diameter (TFD),smaller Fruit shape
index (FSI) and higher Total soluble solids (TSS) contain; the fourth group had 87 samples, they
were characterized by shorter Petiole length (PEL), larger fruit, higher Juice ratio (JR), multiple
Stamen number (SN) and longer Pistil length (PIL). (3) The principal component analysis showed the
values of the first 9 major components characteristic vectors were all greater than 3, the cumulative
contribution rate reach 72.20%, including the traits of single fruit weight, fruit diameter, tree height,
tree canopy width etc. Finally, based on the comprehensive main component value of all samples,
the Calamansi individuals with higher testing scores were selected for further observation. This study
concludes that Calamansi seedling populations in the Hainan Island holds great genetic diversity in
varies traits, and can be useful for the Calamansi variety improvements.
Calamansi (Citrus microcarpa) or Philippine lime, is an important local economic crop in Hainan China. It
originated in Southeast Asia, mainly grow in Southeast Asia and tropical regions of China, and it had a long
history of cultivation in Hainan Island. Calamansi fruit is rich in vitamins C, aromatic oils, carotenoids and
other natural substances which have lots of health benefits for human, such as beneficial effects for human eyes,
good for treating cough, asthma, high blood pressure and preventing arteriosclerosis e tc1–3. Calamansi fruit
had a fine texture and sour taste. Calamansi juice is widely loved as a delicious fresh condiment. However, the
commercially cultivated Calamansi were mostly seedling trees, and their genetic diversity and improvement had
not been studied, which causing a series of problems such as no stable commodity supply period and uneven
fruit quality. Hainan island is the main growing area of Calamansi in China. The investigations and evaluations
of the germplasm of Calamansi in Hainan Island hold great significance for Calamansi genetic improvement
with fruit quality.
Phenotypic traits were intuitive manifestations of the quality of germplasm resources and an important
indicator of genetic improvement. The diversity of phenotypic traits was the comprehensive performance of the
1
Key Laboratory of Genetics and Germplasm Innovation of Tropical Special Forest Trees and Ornamental
Plants, Ministry of Education, Haikou 570228, China. 2College of Forestry, Hainan University, Haikou 570228,
China. 3Ming Bo Scientific Technology Co., Ltd., Haikou 571142, China. *email: sqianxie@foxmail.com;
18389807612@163.com
Scientific Reports | (2022) 12:371 | https://doi.org/10.1038/s41598-021-03775-x 1
Vol.:(0123456789)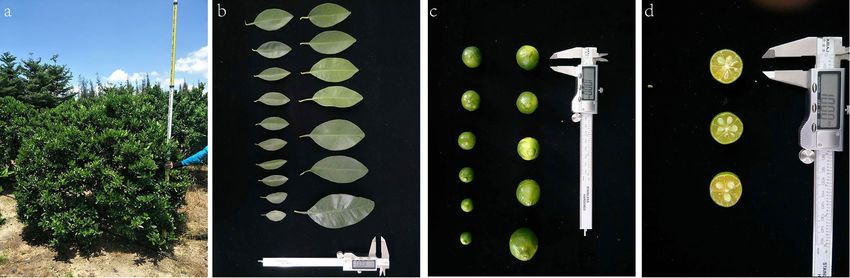
www.nature.com/scientificreports/
genetic diversity of germplasm and environmental effects. It had both stability and v ariability4. The evaluation of
germplasm phenotypic traits were important for identifying traits with high economic value and high ecological
value, and could help to identify excellent genetic resources for the subsequent variety d evelopment5,6.
At present, the methods frequently used for phenotypic trait evaluation included diversity analysis, correla-
tion analysis, cluster analysis and principal component a nalysis7,8. Wang4 used principal component analysis,
cluster analysis and other methods to analyze 312 safflower germplasm materials from all over the world, and
separated them into 7 groups, provided scientific basis for the effective use of safflower germplasm for breeding
of new varieties; Zhao9 used the same methods and analyzed the 20 traits of 257 Jerusalem artichoke germplasm,
and separated Jerusalem artichoke germplasm into 5 categories, which provided reference for utilization of
Jerusalem artichoke germplasm resources. Currently, most researches on Calamansi were mainly focused on
the processing and utilization of Calamansi fruit-related products. F ang10 used Calamansi juice and bread as
the main raw materials to ferment and prepare Calamansi kvass drink; Sun11 used Calamansi as raw material,
extracted pigments and studied its physical and chemical properties which broadened the production market
for Calamansi related products. However, the research and evaluation of the phenotypic traits of Calamansi
was relatively lagging behind. In this study, diversity analysis, correlation analysis, cluster analysis and principal
component analysis were conducted to evaluate the phenotypic traits of Calamansi germplasm resources from
Hainan Island. This study is intended to lay the foundation for breed selection of Calamansi in Hainan Island.
Results
Genetic diversity. A total of 8,511,230 SNP loci were obtained and based on these SNP loci the phyloge-
netic tree was constructed by using Phylip software. The phylogenetic tree showed that those 100 individuals can
be divided into 5 groups. Among them, most of them were related to each other in different level, except 2 indi-
viduals (L-N6R62C6 and L-N3R19C10) presented a very simple relationship to their common ancestor (Fig. 1).
The result indicated that the current existing Calamansi populations in Hainan Island have quite high levels the
genetic diversity, despite of high level of polyembryony nature of the Calamansi seeds.
Phenotypic traits diversity. Quality traits. The names, abbreviations and units of all traits are shown in
Table 1, and the detailed scoring criteria are shown in Supplementary Table 1. The 8 quality traits were divided
into 39 levels (Table 2), 34 of which have the frequency ranged from 0.66 to 84.11% of samples distributions.
There were 5 traits have weak frequency of distribution, they were TGV (Tree growth vigor), OFS (Oval fruit
shape), DCFBS (Deep concave fruit base shape), DCFTS (deep concave fruit top shape), and CFTS (convex fruit
top shape). There were 9 traits with an effective percentage less than 5%, only a few individuals in the popula-
tion exhibited their phenotypes, including TP (Tree performance), LB (Leaf base), OFS (Oblate fruit shape),
ObvFS (Obviate fruit shape), PFS (pyriform fruit shape), LNFBS (long neck fruit base shape), FFBS (flat fruit
base shape), NCFBS (neck collar fruit base shape) and RFTS (round Fruit top shape). Traits with an effective
percentage greater than 80% include DTP (draped Tree performance) and LNFBS (long neck fruit base shape),
indicating these traits are relatively stable.
The Shannon–Wiener diversity index (H′) showed different traits had range between 0.46–1.39. These traits
included Fruit shape (FS) and Pulp color (PC) (H′ > 1.20), consider being high genetic diversity4. The traits
included Tree shape (TS) and Tree performance (TP) with lower genetic diversity (H′ < 0.60). The total value
of these 8 quality traits diversity were 6.53; there were 4 types of fruit traits with diversity value of 4.29, which
accounting for 65.7% of the total traits diversity value.
Quantitative traits. Among 29 quantitative traits, the traits like Fruit weight (FW) had the range between
6.15 to 17.02 g, Seed number per fruit (SNPF) ranged between 3 to 11, and the Peel thickness (PT) ranged
between 0.66 to 1.52 mm. The values of all the quantitative traits were indicated in Table 3, the coefficient of
variation of all traits were distributed between 3.09 and 44.00%. The trait with largest variation was Yield per
tree (YPT) (CV > 40%)4 indicating this trait had rich breeding potential. There were 14 traits with small varia-
tion (CV < 10%), including Branch width(BW) (6.51%), Branch node length (BNL) (8.26%), Leaf lamina length
(LLL) (6.76%), Leaf lamina width (LLW) (7.50%), Leaf shape index (LSI) (4.54%), Fruit diameter (FD) (3.86%),
Fruit length (FL) (5.60%), Fruit shape index (FSI) (4.05%), Total soluble solids (TSS) (5.18%), Titratable acid-
ity (TA) (8.16%), Total soluble solids/Titratable acidity (TSS/TA) (8.34%), Segment number per fruit (SNF)
(6.64%), Peel thickness (PT) (9.57%) and Petal number (PN) (3.09%). These results indicated that these traits
hold relatively good genetic stability.
The Shannon–Wiener diversity indexes (H′) of 29 quantitative traits were in the range of 0.67–2.10, traits like
Juice ratio (JR) (1.08), Petal number (PN) (0.67)and others with lower indexes, indicated that the phenotypic
variants of these traits were relatively small, or the distribution of each phenotype was uneven. In this study,
except the Juice ratio (JR) and Petal number (PN) these two traits had relatively lower diversity index (H′),
other traits all had H′ greater than 1.2, reflecting the rich phenotypes of these traits, and the distribution of each
phenotype was relatively uniform.
Correlation analysis of quantitative traits. Correlation analysis of quantitative traits showed a total of
149 pairs of traits were significantly correlated, of which 84 pairs were positively correlated and 65 pairs were
negative correlated (Supplementary Table 2). Among them, like Tree Foot diameter (TFD), Branch node length
(BNL), Tree height (TH), Crown breadth (CB), Petiole length (PEL), Leaf lamina length (LLL), Leaf lamina
width (LLW) and were significantly correlated with each other. Fruit traits, like Fruit weight (FW), Fruit diam-
eter (FD), Fruit length (FL), Total soluble solids (TSS), Oil cell number (OCN) and Pistil length (PIL), were also
significantly correlated with other. The important trait, like Seed number per fruit (SNPF) were found negatively
Scientific Reports | (2022) 12:371 | https://doi.org/10.1038/s41598-021-03775-x 2
Vol:.(1234567890)
www.nature.com/scientificreports/
Figure 1. Population with 100 individuals were divided into 5 groups, separated by different colors.
Phylogenetic tree of Calamansi constructed by SNPs genotypes extracted from a seedling population with 100
individual’s (figure is generated by iTOL software, Version iTOL 6.0, https://itol.embl.de/).
correlated with Tree height (TH), Crown breadth (CB), Fruit length (FL), Leaf shape index (LSI) at significant
level, while positively correlated with traits like Ascorbic acid (AA), Stamen number (SN), Total soluble solids
(TSS) and Total soluble solids/Titratable acidity (TSS/TA) at significant level (Fig. 2).
Cluster analysis. The Ward method was used for conducting cluster analysis of 29 quantitative traits of the 151
individuals. The 151 individuals were divided into 4 categories (Fig. 3). A statistical analysis resulted in 4 groups:
the first group containing 32 individuals; the main characteristics of this group were: fewer flesh segment num-
ber per fruit (SNF) and more oil cell number (OCN) in the fruit peel; the second group include 7 individuals, the
main characteristics of this group were: larger crown breadth (CB), higher yield per tree (YPT), the lager leaf, the
higher ascorbic acid (AA) and less seed number per fruit (SNPF); there were 25 individuals in the third group,
the main characteristics of this group were: smaller tree foot diameter (TFD),smaller fruit shape index (FSI) and
higher total soluble solids (TSS); the fourth group had 87 individuals, and characterized by shorter petiole length
(PEL), larger fruit, higher Juice ratio (JR), multiple stamen number (SN) and longer pistil length.
Principal component analysis and comprehensive evaluation. In this study, principal component analysis was
performed on 29 quantitative traits. Among the 29 quantitative traits, the eigenvalues of the first 9 principal
components were greater than 1 (Fig. 4), and the cumulative contribution rate reach 72.20%, indicating that
the first 9 principal components can represent most of the trait information about the 27 phenotypic traits of
Calamansi (Table 4).
Scientific Reports | (2022) 12:371 | https://doi.org/10.1038/s41598-021-03775-x 3
Vol.:(0123456789)www.nature.com/scientificreports/
Traits name Abbreviations Unit Traits name Abbreviations Unit
Tree shape TS – Petiole length PEL Mm
Tree growth vigor TGV – Leaf lamina length LLL Mm
Tree performance TP – Leaf lamina width LLW Mm
Leaf base LB – Leaf shape index LSI –
Fruit shape FS – Fruit weight FW G
Fruit top shape FTS – Fruit diameter FD Mm
Fruit base shape FBS – Fruit length FL Mm
Pulp color PC – Total soluble solids TSS %
Tree foot diameter TFD Mm Titratable acidity TA %
Tree height/crown width TH/CB – Total soluble solids/titratable acidity TSS/TA –
Branch width BW Mm Ascorbic acid AA mg/100 mg
Branch node length BNL Mm Segment number per fruit SNF Number
Yield per tree YPT Number Seed number per fruit SNPF Number
Tree height TH Cm Fruit shape index FSI –
Crown breadth CB Cm Petal number PN Number
Juice ratio JR % Stamen number SN Number
Peel thickness PT Mm Pistil length PIL Mm
Petal length PL Mm Oil cell number OCN Number
Petal width PW Mm
Table 1. Traits abbreviations and units.
Classification and frequency(%)
Traits 1 2 3 4 5 6 7 8 Diversity index H′
TS 9.27 84.11 6.62 – – – – – 0.47
TP 23.00 68.33 8.67 – – – – – 0.69
TGV 0.00 23.33 76.67 – – – – – 0.46
LB 69.54 29.80 0.66 – – – – – 0.62
FS 0.66 12.58 28.48 0.00 0.66 14.57 3.31 39.74 1.39
FBS 0.66 80.79 14.57 1.32 1.99 0.00 0.66 – 0.90
FTS 0.00 59.60 32.45 1.32 0.00 6.62 – – 0.63
PC 5.30 17.51 33.63 37.23 6.33 – – – 1.37
Table 2. Diversity analysis of qualitative traits. “–”: this item does not exist.
The PC1 had the largest contribution rate of 22.66%. The larger characteristic vectors were Fruit weight (FW),
Fruit length (FL) and Pistil length (PIL), indicated that the first principal component was mainly affected by
traits related to pistil length and fruit size. The contribution rate of the PC2 was 12.97%, and the larger eigenvec-
tor values were Tree height (TH) and Crown breadth (CB), indicated that the second principal component was
mainly affected by the traits related to the tree. The contribution rate of the PC3 was 7.06%, and the larger eigen-
vector value was the Titratable acidity (TA), indicated that the third principal component was mainly affected
by the titratable acid content. The contribution rate of the PC4 was 6.24%, and the larger eigenvector value was
Ascorbic acid (AA). The contribution rate of the PC5 was 5.40%, and the trait with the largest eigenvector value
was Branch width (BW). The contribution rate of the PC6 was 4.57%, and the trait with the largest eigenvector
value was Branch node length (BNL). The contribution rate of the PC7 was 4.49%, and the traits with the largest
eigenvector values were Petal number (PN) and Juice ratio (JR). The contribution rate of the PC8 was 4.03%,
and the traits with the largest eigenvector values were Petiole length (PEL). The contribution rate of the PC9 was
3.78%, and the trait with the largest eigenvector value was Leaf shape index (LSI).
Comprehensive evaluation results showed that the comprehensive PC values of all samples were distributed
between 38.63 and 97.41 (Supplementary Table 3), with a median of 68.02. There were 33 samples with compre-
hensive PC values greater than the median (Table 5), occupying all samples 21.85% of the total value.
Discussion
Phenotypic traits are the reflection of the comprehensive effects of the plant genotype and the environmental
effects. Phenotype is an important manifestation of genetic variation, and it can directly indicate the abundance
of specific genes. Phenotype is the basis for the germplasm innovative and variety improvement14. In this study,
the phenotypic traits of 151 Calamansi samples from Hainan Island were statistically analyzed and evaluated.
Scientific Reports | (2022) 12:371 | https://doi.org/10.1038/s41598-021-03775-x 4
Vol:.(1234567890)www.nature.com/scientificreports/
Traits Minimum Maximum Mean SD CV Diversity index H′
TH 122.00 332.50 205.41 35.24 17.16 2.08
CB 165.73 361.78 247.85 40.82 16.47 2.04
TH/CB 0.90 1.69 1.22 0.16 13.52 1.97
TFD 14.61 119.06 73.28 17.81 24.30 2.04
BW 2.21 3.05 2.59 0.17 6.51 2.08
BNL 8.10 13.53 11.16 0.92 8.26 1.99
YPT 25.00 690.00 234.52 103.19 44.00 1.96
PEL 6.47 23.83 9.49 1.60 16.89 1.76
LLL 47.35 66.25 57.37 3.88 6.76 2.10
LLW 22.71 36.90 27.95 2.10 7.50 2.01
LSI 1.53 2.33 2.06 0.09 4.54 1.98
FW 6.15 17.02 12.54 1.57 12.48 2.03
FD 23.97 30.57 28.26 1.09 3.86 2.00
FL 23.47 32.00 28.88 1.62 5.60 2.03
FSI 0.91 1.16 1.02 0.04 4.05 2.05
AA 19.84 44.39 32.29 3.62 11.20 1.97
TSS 6.69 8.94 7.56 0.39 5.18 2.05
TA 6.04 10.44 8.10 0.70 8.61 2.00
TSS/TA 0.75 1.17 0.94 0.08 8.34 2.08
SNF 5.25 7.50 6.42 0.43 6.64 2.00
SNPF 3.92 10.50 7.17 1.14 15.87 2.03
JR 0.21 0.55 0.45 0.08 18.56 1.08
PT 0.66 1.52 1.22 0.12 9.57 2.01
OCN 15.72 30.56 21.10 2.97 14.07 2.05
PN 3.67 5.50 4.99 0.15 3.09 0.67
PL 7.04 16.87 11.07 1.64 14.82 2.08
PW 2.35 4.81 3.72 0.51 13.82 2.07
SN 0.00 28.00 21.85 2.19 10.02 1.50
PIL 3.12 8.92 6.39 1.26 19.71 1.99
Table 3. Diversity analysis of quantitative traits.
Figure 2. Correlation of quantitative traits among individuals. The blue area indicates a negative correlation
between the two traits, and the red area indicates a positive correlation between the two traits. The darker the
color the higher the level of correlation (figure is generated by EXCEL software, Version Microsoft Office 2020,
https://www.office.com/).
Scientific Reports | (2022) 12:371 | https://doi.org/10.1038/s41598-021-03775-x 5
Vol.:(0123456789)www.nature.com/scientificreports/
Figure 3. Sample cluster map. The figure shows the cluster analysis results of 151 individuals based on
phenotypic traits. The results show that the populations were divided into 4 categories, which was indicated by
blue, green, orange and dark green colors The number, proportion and characteristics of each category were
showed in the figure (figure is generated by R software, Version R 4.1.1, https://www.r-project.org/).
Figure 4. The principle component analysis showed eigenvalues of the first 9 principal components were
greater than 1. The first 9 principal components had the cumulative contribution rate reach 72.20%, indicating
the first 9 principal components represent most of the trait information from the phenotypic traits of Calamansi
(figure is generated by SPSS software, Version SPSS 25.0, https://www.ibm.com/support/pages/node/589145).
Scientific Reports | (2022) 12:371 | https://doi.org/10.1038/s41598-021-03775-x 6
Vol:.(1234567890)www.nature.com/scientificreports/
Traits PC1 PC2 PC3 PC4 PC5 PC6 PC7 PC8 PC9
TH − 0.042 0.810 − 0.180 − 0.142 0.232 0.078 0.169 0.272 − 0.126
CB − 0.339 0.752 − 0.185 0.137 − 0.127 0.142 0.222 0.083 − 0.019
TS/CB − 0.395 − 0.151 0.033 0.369 − 0.491 0.072 0.050 − 0.284 0.156
TFD − 0.284 0.691 0.034 0.021 0.015 0.025 0.287 − 0.091 0.206
BW − 0.079 − 0.135 0.180 − 0.158 0.669 − 0.031 − 0.174 − 0.298 0.254
BNL 0.086 0.249 0.234 − 0.098 0.435 0.520 − 0.161 − 0.140 0.115
YPT − 0.259 0.603 − 0.051 0.367 0.088 − 0.077 − 0.022 0.255 0.059
PEL − 0.470 0.205 0.356 0.138 0.088 0.013 0.099 − 0.353 0.034
LLL − 0.689 0.382 0.164 0.138 0.037 0.042 0.088 − 0.080 0.225
LLW − 0.678 0.188 0.420 0.100 0.175 0.003 0.300 0.012 − 0.226
LSI 0.097 0.240 − 0.429 0.042 − 0.214 0.059 − 0.329 − 0.127 0.670
FW 0.776 0.202 0.177 0.219 0.019 0.210 − 0.205 0.111 − 0.009
FD 0.687 0.079 0.259 0.363 0.140 0.285 − 0.060 0.204 0.059
FL 0.774 0.450 0.039 0.049 0.036 0.054 − 0.095 0.091 − 0.063
FSI 0.415 0.564 − 0.192 − 0.279 − 0.091 − 0.183 − 0.081 − 0.066 − 0.140
AA − 0.110 − 0.283 − 0.303 0.425 − 0.019 0.330 0.254 0.188 0.016
TSS − 0.194 − 0.550 − 0.381 − 0.299 0.246 0.270 0.178 0.090 − 0.059
TA 0.440 − 0.130 − 0.653 0.218 0.316 0.105 0.207 − 0.291 − 0.115
TSS/TA − 0.558 − 0.226 0.423 − 0.397 − 0.186 0.072 − 0.116 0.358 0.085
SNF 0.059 − 0.465 − 0.020 0.373 0.293 − 0.205 0.042 0.256 0.147
SNPF − 0.089 − 0.484 0.246 0.290 0.092 0.117 0.226 0.225 0.235
JR 0.425 − 0.060 0.305 0.370 − 0.077 0.037 − 0.369 − 0.126 − 0.306
PT 0.371 − 0.064 − 0.065 − 0.381 − 0.093 0.142 0.078 0.355 0.263
OCN − 0.571 − 0.234 − 0.316 0.172 0.117 − 0.253 − 0.028 0.017 − 0.085
PN 0.304 − 0.169 0.183 − 0.357 − 0.126 0.312 0.375 − 0.278 0.029
PL 0.738 0.023 0.232 − 0.014 − 0.013 − 0.315 0.358 − 0.013 0.181
PW 0.681 − 0.065 0.214 0.071 0.086 − 0.447 0.281 − 0.009 0.209
SN 0.367 − 0.181 0.066 0.098 − 0.392 0.331 0.180 − 0.105 − 0.073
PIL 0.824 0.072 0.037 − 0.051 − 0.023 − 0.072 0.278 − 0.089 − 0.017
Eigenvalue (E) 6.570 4.051 2.048 1.810 1.566 1.326 1.302 1.169 1.097
Contribution (%) 22.655 13.969 7.064 6.240 5.400 4.573 4.491 4.031 3.783
Cumulative Percent (%) 22.655 36.624 43.687 49.927 55.327 59.900 64.390 68.421 72.204
Table 4. Principal component analysis of quantitative traits.
The results showed that the diversity indexes of the Calamansi phenotypic traits ranged from 0.46 to 2.10, with
an average value of 1.72, indicating there were rich genetic diversity among the phenotypic traits of seedling
Calamansi, and the Calamansi population could be selected and used in Calamansi genetic improvements. The
coefficient of variation in genetic parameters could reflect the degree of dispersion of a trait to a certain extent.
The larger the coefficient of variation, the higher the degree of dispersion15,16. In general, if the coefficient of
variation was greater than 10%, indicating that the trait varies among different germplasm individuals were
diversified17. The coefficient of variation of 14 phenotypic traits, Branch width (BW), Branch node length (BNL),
Leaf lamina length (LLL), Leaf lamina width (LLW), Leaf shape index (LSI), Fruit diameter (FD), Fruit length
(FL), Fruit shape index (FSI), Total soluble solids (TSS), Titratable acidity (TA), Total soluble solids/Titratable
acidity (TSS/TA), Segment number per fruit (SNF), Peel thickness (PT) and Petal number (PN) were less than
10%, means the genetic performance was relatively stable. Among the quantitative traits, the variation coefficient
of the Yield per tree (YPT) was relatively larger; others were distributed between 10.02 and 21.30. The variation
of quantitative traits of Calamansi were distributed between 3.09 and 44.00%, indicated that there were large
diversity in the quantitative traits among the individual samples, and implied that there was a good breeding
potential in the Calamansi population studied. The cluster analysis results had separated the samples into 4 cat-
egories: (1) fewer Segment number per fruit (SNF) and more oil cell number (OCN); (2) larger crown breadth
(CB), higher yield per tree (YPT), fewer seed number per fruit (SNPF); (3) lower tree foot diameter (TFD)
and fruit shape index (FSI), but higher total soluble solids (TSS) and (4) higher titratable acidity (TA), shorter
petiole length (PEL), larger fruit diameter (FD) and fruit length (FL), higher juice ratio (JR). This analysis could
provide elite individual plant materials to support the Calamansi breeding development. This study was based
on the phenotypic traits of Calamansi, using Principal component analysis (PCA), it was found that the cumula-
tive contribution rate of the first nine principal components of Calamansi was 72.20%, which could represent
most of the Calamansi, and perhaps implied that those phenotypic traits could be integrated at the same time.
Through this analysis, those individuals with higher scores from comprehensive evaluation were selected. This
Scientific Reports | (2022) 12:371 | https://doi.org/10.1038/s41598-021-03775-x 7
Vol.:(0123456789)www.nature.com/scientificreports/
Sample ID F1 F2 F3 F4 F5 F6 F7 F8 F9 F
L-N5R2C5 − 304.11 951.20 − 128.02 246.84 99.26 66.99 178.71 251.41 13.02 97.41
L-N6R40C6 − 283.18 856.75 − 104.29 237.67 88.04 58.49 164.87 220.40 25.73 87.68
L-N4R20C9 − 268.57 831.38 − 109.73 234.44 84.80 64.91 157.97 224.49 14.11 86.39
L-N4R18C1 − 255.92 811.74 − 99.26 203.19 81.81 69.71 168.93 198.50 20.40 85.05
L-N5R5C6 − 304.41 839.58 − 101.05 306.83 100.08 29.88 122.21 253.05 33.63 84.06
L-N6R24C7 − 281.11 823.62 − 104.12 238.00 83.60 61.09 155.16 215.59 23.31 82.71
L-N4R8C4 − 264.90 791.44 − 96.18 236.81 79.78 56.37 146.46 212.17 22.71 81.40
L-N3R32C8 − 281.31 812.43 − 103.10 249.60 72.38 55.01 152.08 211.32 26.79 80.84
L-N6R60C6 − 241.13 763.69 − 104.22 172.98 69.11 76.94 171.09 181.75 7.58 78.03
L-N5R15C2 − 235.20 738.22 − 93.22 170.92 65.56 80.95 173.20 165.96 16.14 76.24
L-N6R34C6 − 218.11 711.35 − 91.23 170.66 71.12 70.89 158.19 172.21 11.11 75.71
L-N3R15C7 − 250.63 754.71 − 105.46 189.08 61.45 78.30 164.78 182.85 9.33 75.02
L-N4R6C7 − 240.95 728.20 − 89.01 195.65 71.55 66.93 154.21 178.13 20.92 74.88
L-N5R7C5 − 232.80 724.32 − 94.75 159.55 64.25 77.52 166.74 161.21 12.57 73.18
L-N6R29C7 − 222.45 694.62 − 90.16 190.43 69.42 62.79 144.85 179.07 11.91 72.94
L-N4R17C10 − 263.34 746.01 − 99.00 214.97 65.64 67.03 154.40 186.55 19.13 72.76
L-N4R3C3 − 211.37 682.59 − 82.07 155.47 70.96 72.49 156.07 158.11 15.31 72.48
L-N5R48C8 − 228.83 711.13 − 94.85 163.46 66.20 73.30 163.87 163.94 12.64 72.37
L-N4R9C1 − 237.14 711.43 − 94.10 187.73 65.94 68.33 157.11 170.91 18.57 72.06
L-N6R19C3 − 221.84 693.31 − 94.46 184.54 69.31 65.86 140.75 177.68 9.90 72.04
L-N4R11C4 − 231.25 700.90 − 89.98 191.44 66.97 63.06 146.57 173.50 18.03 71.87
L-N6R48C7 − 242.82 718.27 − 93.64 177.48 65.29 74.26 167.72 167.33 16.49 71.61
L-N5R34C5 − 220.54 677.76 − 72.66 179.08 66.55 62.46 148.34 153.50 22.60 70.91
L-N4R23C6 − 180.17 643.82 − 89.77 117.96 60.13 85.52 158.95 143.20 − 0.81 70.18
L-N5R26C8 − 169.77 614.46 − 76.78 140.27 65.76 66.01 142.89 146.68 10.20 69.99
L-N5R47C1 − 171.42 614.78 − 77.28 143.97 62.33 67.58 143.00 146.33 10.47 69.74
L-N5R25C3 − 217.80 668.99 − 82.65 173.07 71.21 62.62 146.01 164.47 14.11 69.50
L-N5R33C2 − 212.85 669.55 − 88.10 159.06 60.09 72.26 156.07 154.70 11.08 69.22
L-N4R26C5 − 231.20 694.80 − 91.08 161.52 59.82 72.95 163.14 155.55 15.08 69.06
L-N3R39C4 − 229.97 671.25 − 79.75 201.18 65.15 55.44 136.79 171.89 23.11 68.59
L-N4R12C6 − 213.49 658.58 − 78.61 159.92 82.98 52.33 139.81 161.65 18.40 68.42
L-N6R32C3 − 206.03 653.62 − 80.30 154.49 57.49 72.88 151.39 149.10 12.26 68.31
P-N1R6C18 − 172.04 603.65 − 74.71 149.23 63.49 63.30 138.06 147.87 10.42 68.26
Table 5. Principal component values of 33 samples.
comprehensive evaluation method had been used in the phenotyping and the classifications of other crops18–20.
The results of this study could be used to select Calamansi individuals with outstanding traits.
In addition, this research also found that the Calamansi seeds have extremely high level of polyembryonic, but
the diversity analysis of the Calamansi population resulted relative higher diversity index, and phenotypic evalu-
ation also showed relative higher diversity among the traits analyzed. This interesting phenomenon might imply
high frequency of sprout mutation existing in the Calamansi germplasm population which caused relative high
genetic diversity in descendant population after multi-generation of propagation by seeds. Another possibility
is that in the long history of cultivation, open-pollinated Calamansi zygotic embryos under the growth pressure,
had gradually produced stronger competitive ability than the somatic embryos, and developed into complete
individuals, leading to the continuous evolution of Calamansi and phenotypic diversity. Finally, in the process
of data collection, it was found that harvested fruits within the commercial standards weight range (10–13 g
per fruit) had about twice as more seed numbers than that of fully mature Calamansi fruits. The reasons of this
phenomenon and seed number reduction mechanism were unknown at the present time.
This study investigated 151 individuals of the Calamansi germplasm resources in Hainan Island, and evaluated
various phenotypic traits of cultivated Calamansi. The research provided information for the whole genome asso-
ciation analysis of Calamansi. The resulting data proved to be useful in the subsequent genome-wide association
analysis, which built up the connection between Calamansi’s phenotype and the responsible genes.
This article is the first research to investigate the germplasm of Calamansi in Hainan Island, China. Hainan
Island is a geographically isolated tropic environment. The Calamansi cultivation on the island has several hun-
dred years history, Calamansi has under gone many generations of selections intentionally or unintentionally, the
genetic variations (mutations) with advantage to their growth or beneficial to the growers were likely survived
and being saved, many genetic variations were saved and cumulated resulted Calamansi’s genetic diversities in
the Hainan Island. This study can reflect the genetic characteristics of Calamansi to a certain extent. Calamansi
is widely distributed in many countries in Southeast Asia, and is widely used in different culture of life. In the
Scientific Reports | (2022) 12:371 | https://doi.org/10.1038/s41598-021-03775-x 8
Vol:.(1234567890)www.nature.com/scientificreports/
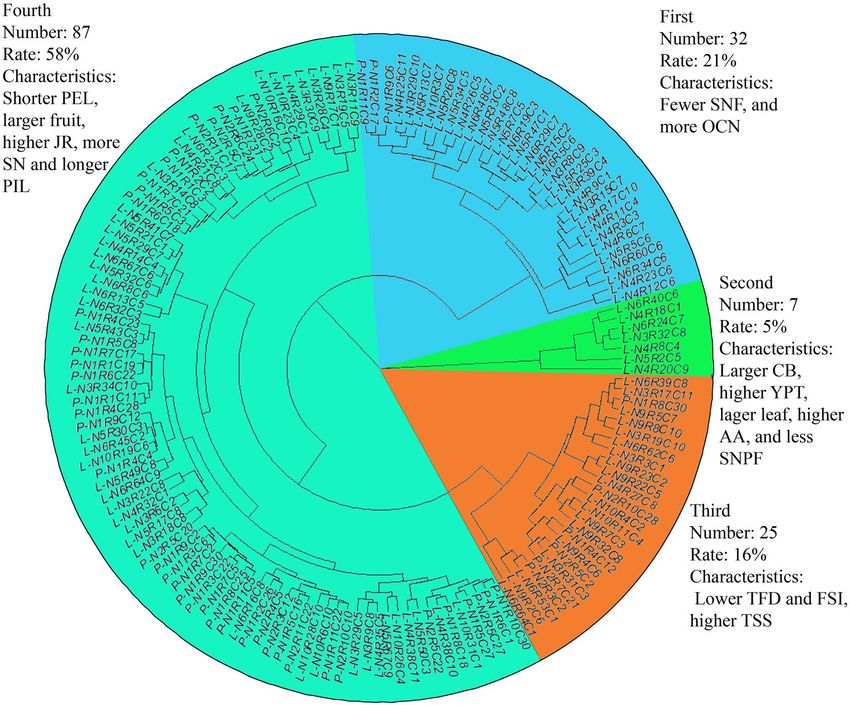
Figure 5. Calamanis (a Calamanis tree, b Calamanis leaf, c Calamanis fruit size, d Calamanis pulp color).
future, all the Calamansi germplasm resources in Southeast Asia will be collected and analyzed, which can more
accurately study the genetic characteristics of Calamansi and its genetic information could provide more valuable
references for Calamansi breeding and cultivar improvement.
Conclusion
In this study, the phenotypic traits of the Calamansi seedling populations in Hainan Island was first time evalu-
ated. The study identified elite individuals for various traits, provided plant materials and data to support the
subsequent Calamansi breeding operation. Since Calamansi is a widely cultivated “cash crop” in Hainan Island,
it is a plant species that has important role in the local economy, especially for the farmers who only have small
scale of land available. In this study, we systematically evaluated 37 phenotypic traits of the seedling populations
of Clamansis, and found there were high level of genetic diversity among the Clamansis seedling populations
for those traits. Existing Calmansi populations can serve as genetic resource for Calmanis variety development.
Materials and methods
Plant materials. The samples of this study were collected from the planting groves of Hainan Ming Bo
Scientific Technology Co., Ltd. in Quanmei, Wenchang city and Dongchang Farm, Haikou city, China (Fig. 5).
The Calamansi fruit trees planted in these groves were derived from seedlings in Hainan Island. In this study,
total of 151 (101 and 50) robust samples were collected from Quanmei and Dongchang Farm, respectively. The
location of Quanmei in Wenchang is approximately 110° 97′ east longitude and 19° 65′ north. The location has
an average annual temperature of 24.4°, an average annual sunshine of 1953.8 h, and an average annual rainfall of
1948.6 mm. The location of Dongchang is approximately 110° 36′ east longitude and 20° 01′ north latitude, with
an average annual temperature of 23.8°, an average annual sunshine of 1752 h, and an average annual rainfall of
1724.5 mm. All the trees were 6–8 years old and under the same management conditions.
Phenotypic data analysis. Various traits were evaluated from the 151 samples for 2019 and 2020 two
years. The phenotypic traits were investigated, including 8 qualitative traits and 29 quantitative traits. The
descriptors for citrus germplasm resources21 were used as standard reference (Supplementary Table 1). Among
them, the quality traits of Tree shape (TS), Crown breadth (CB), Fruit shape (FS) and others were measured by
comparing with standard graphs. Quantitative traits such as Tree height (TH), Leaf lamina length (LLL), Fruit
weight (FW), were measured by the corresponding tower ruler, vernier caliper, and analytical balance. Traits of
Total soluble solids (TSS), Titratable acidity (TA), Ascorbic acid (AA), and Juice ratio (JR) were measured by
refractometer method, redox titration method, 2, 6-dichloroindophenol titration method, and physical pressing
method. Each sample was repeated 6 times.
Phenotypic diversity and statistical analysis. The data obtained from the phenotype survey were
sorted and analyzed using Microsoft Office Excel 2019, and Spss 25.0. The degree of morphological diversity was
expressed by Shannon–Wiener index, and the calculation formula was
n
H′ = − (PilnPi) (i = 1, 2, 3 . . .)
i=1
where H′ was the diversity index, ‘n’ was the total number of classes, and ‘Pi’ was the effective percentage of the
material distribution frequency in the ‘i-th’ class of the trait. Quality traits were directly calculated according to
the effective percentage of each grade. Calculated the overall average ( x ) and standard deviation (s) for quantita-
tive traits, and then from the first level < − 2 s, the tenth level ≥ + 2 s, and every 0.5 s was one level. The correlation
between quantitative traits was calculated using Pearson’s correlation coefficient, and the principal components of
quantitative traits were extracted using dimensionality reduction analysis and factor analysis (SPSS 25.0) Finally,
Scientific Reports | (2022) 12:371 | https://doi.org/10.1038/s41598-021-03775-x 9
Vol.:(0123456789)www.nature.com/scientificreports/
according to the principal component weight, the comprehensive principal component value of the sample was
calculated to screen the sample.
Genetic diversity analysis. Sequencing of Calamansi genome and SNPs identification. In this study, after
preliminary analysis the phenotypic traits of 151 Calamansi fruit tree samples, 100 fruit trees with rich phe-
notypic characteristics were selected and subjected to genome sequencing. The library was constructed and
sequenced through the Illumina sequencing platform, and 350G raw data were obtained. After acquiring the
genomic data of Calamansi, Fastp software was used to perform quality control on the sequencing data, and then
quality-controlled data were compared with genomic data of Citrus clementina12 (https://www.citrusgenomedb.
org/analysis/156) to obtain the corresponding comparison information. Then GATK 4.0 software was used to
perform mutation screening on 100 individuals genome sequences data to obtain the corresponding gvcf files.
Finally, all the gvcf files were merged into vcf files, and vcf files were further filtered to obtain SNP site of 100
individual Calamansi. Default parameters were used by all software when processing the data.
Construction of phylogenetic tree. The phylogenetic tree of Calamansi was constructed by Phylip software based
on the neighboring method. The specific code is as follows:
Run_pipeline.pl -Xmx1G -Xmx5G -importGuess all.filtered.snp.vcf -ExportPlugin -saveAS sequence.phy
-format Phylip_Inter
echo -e “sequences.phy\nY” > dnadist.cfg
Dnadist < dnadist.cfg > dnadist.log
echo -e “infile.dist\ny” > neighbor.cfg
neighbor < neighbor.cfg > nj.log
less infile.dist | tr ‘\n’ ‘|’ | sed ‘s/|/ /g’ | tr ‘|’ ‘\n’ > infile.dist.table
less outtree | tr ‘\n’ ‘|’ | sed ‘s/ //g’ > outtree.nwk
Finally, the evolutionary tree was obtained by upload obtained outtree.nwk file onto the itol website online.
Principal component analysis and comprehensive evaluation. Principal component analysis (PCA), a statistical
analysis method that converts multiple variables into a few principal components (PC1–PCn) through dimen-
sionality reduction technology. Principal component analysis was carried out by statistical analysis software
SPSS25.0. These PCs can reflect most of the information of the original variables13. Through the software pro-
cesses, the corresponding value of each trait under each Principle component (PC) can be obtained, and the
values are called the characteristic vector of the broad PC. The larger the absolute value of the trait characteristic
vector, the greater the influence on the PC. One or several of the traits with the largest absolute value of the char-
acteristic vector under the PC can be considered that this PC is controlled by these traits to a certain extent. The
eigenvectors under each PC is added to obtain the eigenvalue (E) of the PC. Through the software calculation,
the eigenvalue can be converted into a contribution rate. In theory, the sum of the contribution rates of all PC
equals 1, which can fully explain all the information of the original variables.
According to the eigenvector matrix and standardized phenotype data, all samples were comprehensively
evaluated4. The specific scoring formula was as follow: Fn = − 0.042 × 1 − 0.339 × 2 − 0.395 × 3 + …… + 0.681 × 27
+ 0.367 × 28 + 0.824 × 29. Then the comprehensive principal component value F was calculated according to the
ratio of the characteristic value corresponding to each principal component. In the calculation, the total char-
acteristic value of the extracted principal component served as the weight to sort the comprehensive principal
component value F = 0.227 × 1 + 0.140 × 2 + 0.071 × 3 + …… + 0.045 × 7 + 0.040 × 8 + 0.038 × 9.
Cluster analysis. The statistical analysis software SPSS25.0 was used to carry out the cluster analysis, the Ward
method was used to conduct cluster analysis of 29 quantitative traits among 151 individuals. The 151 individuals
were divided into 4 categories. Ward method is an alternative approach for performing cluster analysis; it looks
at cluster analysis as an analysis of variance problem, instead of using distance metrics or measures of associa-
tion. Ward method involves an agglomerative clustering algorithm, Ward’s method starts out with n clusters of
size 1 and continues until all the observations are included into one cluster. This method is most appropriate for
quantitative variables cluster analysis.
Correlation analysis of quantitative traits. Correlation analysis of 29 quantitative traits was carried out
by statistical analysis software SPSS25.0 among 151 Calamansi individuals, the directions and levels of the cor-
relation among 29 quantitative traits were indicated in (Fig. 2). Basically the correlation analysis was performed
use the data from the 29 quantitative traits, Karl Pearson’s co-efficient of correlation was calculated to present the
relationship between each other traits.
Ethical approval. The collected plant materials and research activities are in accordance with the laws and
regulations of Hainan Province, China.
The collection of Calamansi resources has been approved by the grove owner Ming Bo Scientific Technology
Co., Ltd.
Scientific Reports | (2022) 12:371 | https://doi.org/10.1038/s41598-021-03775-x 10
Vol:.(1234567890)www.nature.com/scientificreports/
Data availability
The data were collected by YHX and YXW. The materials were collected from the farm of Ming Bo Scientific
Technology Co., Ltd.
Received: 6 April 2021; Accepted: 26 October 2021
References
1. Cheong, M. W. et al. Characterisation of calamansi (Citrus microcarpa). Part II: Volatiles, physicochemical properties and non-
volatiles in the juice. Food Chem. 134(2), 696–703 (2012).
2. Gabriel, A. A. et al. A Candida parapsilosis inactivation-based UV-C process for calamansi (Citrus microcarpa) juice drink. Lwt
90, 157–163 (2018).
3. Duan, Z. et al. Extraction and antioxidant activity of polyphenols from green kumquat peel. Sci. Technol. Food Ind. 36(10), 244–248
(2015).
4. Wang, Y. et al. Phenotypic genetic diversity of jujube germplasm resources. Sci. Silvae Sin. 50(10), 33–41 (2014).
5. Shen, H. & D. Liu. Summary of genetic diversity. J. Biol. 03(03), 5–7+4 (2001).
6. Pan, Y. et al. Diversity analysis of phenotypic characteristics for Henan local tea germplasm resources. J. Xinyang Normal Univ.
(Natural Science Edition) 31(04), 578–585 (2018).
7. Ahmet Balkaya, M. Ö. & Kurtar, E. S. The phenotypic diversity and fruit characterization of winter squash (Cucurbita maxima)
populations from the Black Sea Region of Turkey. Afr. J. Biotechnol. 9(9), 152–162 (2010).
8. Franck, C. et al. Phylogenetic origin of limes and lemons revealed by cytoplasmic and nuclear markers. Ann. Bot. 117(4), 565–583
(2016).
9. Zhao, M. et al. Genetic diversity of phenotypic traits in 257 Jerusalem Artichoke accessions. Acta Agron. Sin. 46(05), 712–725
(2020).
10. Fang, S. et al. Processing technology of green kumquat kvass beverage. Farm Prod. Process. 08(08), 41–43+47 (2018).
11. Sun, M. et al. Study on physicochemical properties of pigment from green kumquat. Guangzhou Chem. Ind. 47(18), 66–70 (2019).
12. Wu, G. et al. Sequencing of diverse mandarin, pummelo and orange genomes reveals complex history of admixture during citrus
domestication. Nat. Biotechnol. 32(7), 656–662 (2014).
13. Wu, D. & Wu, D. Some problem in comprehensive evaluation of the principal component analysis. Math. Pract. Theory 45(20),
143–150 (2015).
14. Zhao, C. et al. Comprehensive analysis and evaluation of the phenotype and quality traits of Jiangxi soybean germplasm resources.
Soybean Sci. 38(05), 686–693 (2019).
15. Xu, H. et al. Diversity and geographical variations of germplasm resources of Armeniaca mandshurica. Chin. J. Plant Ecol. 43(07),
585–600 (2019).
16. Liu, J. et al. Phenotypic variations in natural populations of Amygdalus pedunculata. Chin. J. Plant Ecol. 41(10), 1091–1102 (2017).
17. Bai, S. et al. Ecological characteristics and morphological variations of centipede grass in different populations. J. Beijing For. Univ.
04(04), 97–101 (2002).
18. Hu, B. et al. Analysis on genetic diversity of phenotypic traits in rice (Oryza sativa) core collection and its comprehensive assess-
ment. Acta Agron. Sin. 38(05), 829–839 (2012).
19. Dai, P. et al. Comprehensive evaluation and genetic diversity analysis of phenotypic traits of core collection in upland cotton. Sci.
Agric. Sin. 49(19), 3694–3708 (2016).
20. Sun, Z. et al. The influence of different extraction methods on determination of aroma components in lime. Flavour Fragr. Cosmet.
50(22), 4362–4383 (2017).
21. Jiang, D. Descriptors for Citrus Germplasm Resources (China Agriculture Press, 2016). http://www.wanfangdata.com.cn/details/
detail.do?_type=standards&id=NY/T 2930-2016
Author contributions
P.L. and S.Q.X. were responsible for the guidance of the research direction and reviewing the research paper.
Y.H.X. implemented the research process; Y.X.W. helped the research data collection; B.Q. and L.S. provided
Calamansi materials.
Funding
The study was funded by the Hainan Provincial Agriculture Department of China (2019-732-2), Hainan Pro-
vincial Natural Science Foundation of China (2018CXTD33, 320RC500).
Competing interests
The authors declare no competing interests.
Additional information
Supplementary Information The online version contains supplementary material available at https://doi.org/
10.1038/s41598-021-03775-x.
Correspondence and requests for materials should be addressed to S.-Q.X. or P.L.
Reprints and permissions information is available at www.nature.com/reprints.
Publisher’s note Springer Nature remains neutral with regard to jurisdictional claims in published maps and
institutional affiliations.
Scientific Reports | (2022) 12:371 | https://doi.org/10.1038/s41598-021-03775-x 11
Vol.:(0123456789)www.nature.com/scientificreports/
Open Access This article is licensed under a Creative Commons Attribution 4.0 International
License, which permits use, sharing, adaptation, distribution and reproduction in any medium or
format, as long as you give appropriate credit to the original author(s) and the source, provide a link to the
Creative Commons licence, and indicate if changes were made. The images or other third party material in this
article are included in the article’s Creative Commons licence, unless indicated otherwise in a credit line to the
material. If material is not included in the article’s Creative Commons licence and your intended use is not
permitted by statutory regulation or exceeds the permitted use, you will need to obtain permission directly from
the copyright holder. To view a copy of this licence, visit http://creativecommons.org/licenses/by/4.0/.
© The Author(s) 2022
Scientific Reports | (2022) 12:371 | https://doi.org/10.1038/s41598-021-03775-x 12
Vol:.(1234567890)You can also read