Evaluation of Workloads of Package Deliverers Focusing on Their Pickup and Delivery Tasks in Republic of Korea
←
→
Page content transcription
If your browser does not render page correctly, please read the page content below
sustainability

Article
Evaluation of Workloads of Package Deliverers Focusing on
Their Pickup and Delivery Tasks in Republic of Korea
Suk-Chul Rim and Myung-Chul Jung *

 Department of Industrial Engineering, Ajou University, Suwon 16499, Korea; scrim@ajou.ac.kr
 * Correspondence: mcjung@ajou.ac.kr; Tel.: +82-31-219-2981

 Abstract: Package deliverers are facing increasing workloads due to a rapid increase in online
 shopping caused by the recent outbreak of COVID-19 in the Republic of Korea. The purpose of this
 study was to evaluate the physical workload of package deliverers during pickup and delivery tasks.
 Heart rate reserve (HRR), metabolic equivalent of task (MET), standardized Nordic questionnaire
 (SNQ), and visual analogue scale (VAS), measured on site using a wristband, were used as indicators
 of their workload. Twenty deliverers participated in this study. Work analysis was performed to
 categorize their tasks into sorting inside a truck, delivering, picking up, driving, and resting. Statistical
 analysis showed that participants spend 4.3 h per day picking up and delivering 331.9 packages
 per day. Their work requires about 29.7% of HRR and 4.7 of MET, which are thus considered as of
 “moderate level” difficulty. SNQ and VAS revealed that their lower back and wrist/hand were the
 most painful body parts due to repetitive trunk bending and small package handling. The use of a
 cart would be recommended as it has the advantage of handling many packages at once with less
 physical effort in deliverers.

 Keywords: courier service; heart rate reserve; metabolic equivalent of task; standardized Nordic
 questionnaire; visual analogue scale

Citation: Rim, S.-C.; Jung, M.-C.
Evaluation of Workloads of Package
Deliverers Focusing on Their Pickup 1. Introduction
and Delivery Tasks in Republic of With the rapid growth of online shopping accelerated by the recent COVID-19 pan-
Korea. Sustainability 2022, 14, 5229. demic, courier services have greatly developed worldwide and become a representative
https://doi.org/10.3390/su14095229
 logistics industry. Courier services in the Republic of Korea achieved a revenue of approx-
Academic Editor: Sungyong Choi imately USD 7.17 billion in 2021, which is a 14.6% increase over the previous year. The
 number of packages couriered was about 3.63 billion, corresponding to about 70 packages
Received: 19 March 2022
 per person in the same year [1].
Accepted: 25 April 2022
 The courier service involves delivering packages from one place to another. The typical
Published: 26 April 2022
 process of a domestic courier service in the Republic of Korea takes two days, one day for
Publisher’s Note: MDPI stays neutral pickup from the shipper to a terminal and the next day for delivery from the terminal to the
with regard to jurisdictional claims in destination. Shin and Lee [2] surveyed 500 deliverers to identify task durations, working
published maps and institutional affil- hours, and the number of packages. A pickup task takes 1.6 h. A sorting task at a terminal
iations. takes 3.9 h. A delivery task takes 6.9 h. Other tasks, including invoice, scanning, and so
 on, take 1.1 h on average a day. A deliverer generally starts work at 6:54 a.m. and ends at
 8:17 p.m. One deliverer picks up an average of 65.7 packages and delivers an average of
 186.9 packages a day. Thus, a deliverer in the Republic of Korea works for about 13.5 h a
Copyright: © 2022 by the authors.
 day, spending 51% of their workhours mainly on delivery. A package only takes 2.2 min to
Licensee MDPI, Basel, Switzerland.
 be delivered.
This article is an open access article
 As the courier service develops, the unit price per package continues to decline
distributed under the terms and
conditions of the Creative Commons
 due to stiff competition between courier companies. Thus, the treatment of deliverers is
Attribution (CC BY) license (https://
 substantially deteriorating to reduce cost [3]. Most research on the courier service has been
creativecommons.org/licenses/by/ limited to truck driver safety [4,5] or drone development for better delivery services [6–8].
4.0/). For instance, Anderson et al. [4] surveyed courier drivers for safety perceptions of driving

Sustainability 2022, 14, 5229. https://doi.org/10.3390/su14095229 https://www.mdpi.com/journal/sustainability

Sustainability 2022, 14, x FOR PEER REVIEW 2 of 11

Sustainability 2022, 14, 5229 2 of 11
 8]. For instance, Anderson et al. [4] surveyed courier drivers for safety perceptions of driv-
 ing trucks, and found that loading, drowsy driving, and work tension could cause work-
 related accidents. Christie and Ward [5] conducted an online survey of courier drivers on
 trucks, and found
 car accident that loading,
 experiences caused drowsy
 by fatigue,driving, and work
 speeding, tension
 and cell phonecould causedriving
 use while work- a
 related
 truck. accidents. Christie and Ward [5] conducted an online survey of courier drivers on
 car accident experiences caused by fatigue, speeding, and cell phone use while driving
 To the best of our knowledge, only a few studies have been conducted on the work-
 a truck.
 load of deliverers themselves. Jang et al. [9] have measured the labor intensity and phys-
 To the best of our knowledge, only a few studies have been conducted on the workload
 ical load of mailmen. They found that mailmen in the Republic of Korea worked eleven
 of deliverers themselves. Jang et al. [9] have measured the labor intensity and physical
 hours a day—significantly longer than appropriate working hours. They reported that
 load of mailmen. They found that mailmen in the Republic of Korea worked eleven
 this overworking
 hours could increase
 a day—significantly longer thantheappropriate
 risk of cerebrocardiovascular
 working hours. Theydisease.reportedThis heavy
 that this
 workload may
 overworking lead
 could to a fatal
 increase accident.
 the risk It was associated disease.
 of cerebrocardiovascular with theThisdeathsheavyof workload
 15 package
 delivers from cerebral hemorrhage and myocardial infarction in 2020
 may lead to a fatal accident. It was associated with the deaths of 15 package delivers from[10].
 Therefore,
 cerebral hemorrhagemoreand research is required
 myocardial infarctiononinpackage
 2020 [10].deliverers to identify exclusive
 working conditions
 Therefore, in the Republic
 more research is requiredof on
 Korea and deliverers
 package the cardiovascular
 to identifyburden
 exclusiveassociated
 work-
 withconditions
 ing physical workload. The purpose
 in the Republic of Koreaofandthisthe
 study was to assess
 cardiovascular the physical
 burden workloads
 associated with
 of deliverers by measuring the heart rate reserve (HRR) and metabolic
 physical workload. The purpose of this study was to assess the physical workloads equivalent ofof
 task
 (MET) on site
 deliverers using a wristband.
 by measuring the heartTherateergonomic
 reserve (HRR)risk factors of musculoskeletal
 and metabolic equivalent disorders
 of task
 (MET) on site
 were also using a by
 examined wristband. The ergonomic
 administering risk factors
 the standardized of musculoskeletal
 Nordic questionnairedisorders
 (SNQ) and
 were
 visualalso examined
 analogue by(VAS).
 scale administering the standardized Nordic questionnaire (SNQ) and
 visual analogue scale (VAS).
 2. Materials and Methods
 2. Materials and Methods
 2.1. Participants
 2.1. Participants
 The overall
 The overallexperimental
 experimentalprocedure
 procedurethat thatrepresents
 represents the
 the research
 research method
 method of of this
 this study
 study
 is shown in Figure 1. The experimenters personally contacted package deliverers andand
 is shown in Figure 1. The experimenters personally contacted package deliverers
 asked them
 asked them to
 to voluntarily
 voluntarily participate
 participatein inthis
 thisstudy.
 study.AAtotal
 totalof
 of2020deliverers
 deliverers(19 (19male
 maleand
 and 1
 1female)
 female)were
 wererecruited
 recruited forfor this study. Each
 this study. Eachof ofthem
 themparticipated
 participatedonly onlyforfor one
 one dayday with
 with a a
 paymentofofUSD
 payment USD200.200. Their
 Their average
 average age,age, height,
 height, and weight
 and weight with standard
 with standard deviationsdeviations
 were
 were±43.5
 43.5 ± 6.2 years,
 6.2 years, 174.4 174.4
 ± 6.2 ±cm, 6.2and
 cm,70.3
 and±70.311.9± kg,
 11.9respectively.
 kg, respectively.

 Figure 1.
 Figure 1. Overall
 Overallstudy
 studyprocedure
 procedureand
 andresearch
 research method.
 method.
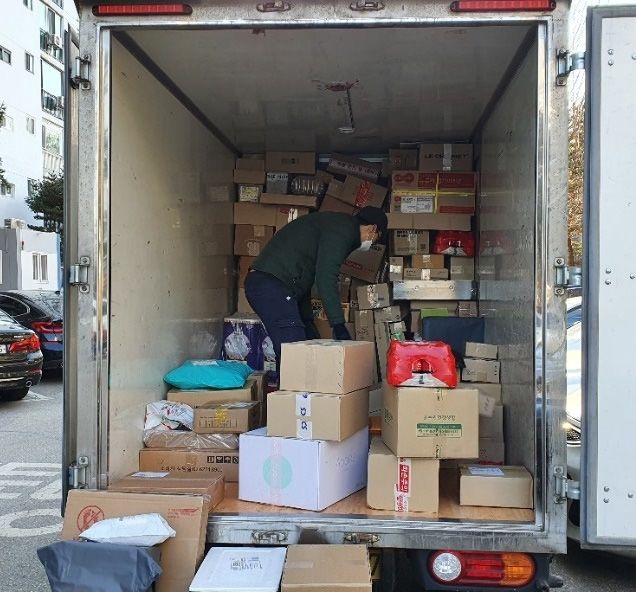
Sustainability 2022, 14, 5229 3 of 11

 2.2. Apparatus
 A Fitbit Inspire HR (FB413, Fitbit Inc., San Francisco, CA, USA) wristband was used
 to measure heart rate (bpm) and energy consumption (kcal/min) in real time with a
 sampling rate of 1 min while participants performed their tasks for objective evaluation of
 their workloads.
 The standardized Nordic questionnaire (SNQ) and visual analogue scale (VAS) were
 utilized for the subjective evaluation of workload. Kuorinka et al. [11] developed the
 SNQ for screening musculoskeletal disorder symptoms. The SNQ contains a general
 questionnaire constructed with a picture of nine anatomical human body regions of neck,
 shoulder, elbow, wrist/hand, upper back, lower back, hip/thigh, knee, and ankle/foot by
 asking the following three questions with binary and multiple choices: (1) “Have you at
 any time during the last 12 months had trouble (ache, pain, discomfort) in: (a truncated
 expression of “in the last 12 months” is used from now on in the study)”, (2) “Have you
 at any time during the last 12 months been prevented from doing your normal work (at
 home or away from home) because of the trouble? (a truncated expression of “in the last
 12 months interfering with work” is used from now on in the study)”, and (3) “Did you
 have any trouble at any time during the last 7 days? (a truncated expression of “in the last
 7 days” is used from now on in the study)”. The SNQ is widely recognized to have good
 utility in analyzing the physical load of workers with a high repeatability and validity [12].
 The VAS is a pain rating scale. Unlike the Likert scale, taking a discrete categorization
 of none, mild, and severe, the VAS has a unidimensional continuum of pain intensity,
 representing with a 10 cm line and verbal anchors of “no pain” for 0 and “extreme pain” for
 10 [13]. The VAS is internationally used in epidemiologic and clinical research to measure
 the intensity of various symptoms [14].

 2.3. Procedure
 The purpose of the experiment was described to participants. They were surveyed
 for their demographic and job characteristics. He demographic characteristics included
 gender, age, height, and weight. Job characteristics included career period, working hours
 per week, the number of packages handled per day, and the number of delivery and pickup
 places per day.
 Participants wore a Fitbit Inspire HR on their wrist. Their age, height, and weight
 information were added to their smartphone application. After confirming them that
 the wristband continuously tracks heart rate and energy consumption in real time, their
 resting heart rates were measured for 5 min in a seated position [15]. Participants then kept
 wearing the wristband until the end of the experiment.
 The experimenter accompanied the participant on his or her duties in order to time
 their tasks of sorting inside a truck, delivering, picking up, driving, and resting, as well as
 the usage of carts, stairs, and ramps, as shown in Figure 2, by recording the start time and
 end time of every task and usage. The sorting task stretched from entering the truck to select
 the packages to be delivered to stacking them in a cart outside the truck. The delivering
 task lasted from handling the cart to dropping all packages in designated locations. The
 pickup task lasted from picking up a package at a designated location to dropping it in a
 truck. The driving task involved operating a truck to the next location. Resting was taking
 a break during duties.
 The typical working conditions of deliverers involve the use of carts, stairs, and ramps
 during pickup and delivery tasks. All the carts the participants used had four wheels to
 transport many packages at once. Stairs and ramps were often observed at the entrances of
 apartments and shopping areas.
 The SNQ and VAS were administered to every participant before participants returned
 the wristband at the end of his or her duties.
Sustainability2022,
Sustainability 14, x5229
 2022, 14, FOR PEER REVIEW 4 4ofof11
 11

 (a) (b)
 Figure
 Figure2.2.Examples
 Examplesofofpickup
 pickupand
 anddelivery
 deliverytasks:
 tasks:(a)
 (a)package-sorting
 package-sortingtask
 taskinside
 insidea atruck;
 truck;(b)
 (b)cart
 cartuse.
 use.

 2.4. Data Processing
 The typical working conditions of deliverers involve the use of carts, stairs, and
 2.4.1. Data
 ramps Synchronization
 during pickup and delivery tasks. All the carts the participants used had four
 wheels to transport
 Heart rate andmany
 energy packages at once.
 consumption Stairs and
 measured byramps were often
 the wristband observed
 were at the
 extracted for
 entrances of apartments
 every minute and shopping
 using the heart areas. intraday time series functions of the Web API
 rate and activity
 The SNQ
 provided and in
 by Fitbit VAS
 thewere
 Jasonadministered
 format. Aftertodata
 every participant
 in the before
 Jason format participants
 were convertedre-to
 Excel data,
 turned they were at
 the wristband synchronized with
 the end of his or the
 herstart time and end time of every task recorded
 duties.
 on site by the experimenter accompanying the participant.
 2.4. Data Processing
 2.4.2. Heart Rate Reserve (HRR)
 2.4.1. Data Synchronization
 Heart rate increased when an activity involved heavy physical tasks. Therefore, it
 Heart rate and energy consumption measured by the wristband were extracted for
 was used as an objective indicator to reflect the degree of workload. Different people have
 every minute using the heart rate and activity intraday time series functions of the Web
 different physical conditions. Their heart rates might be different even if they perform
 API provided by Fitbit in the Jason format. After data in the Jason format were converted
 the same physical activity. Thus, heart rate reserve (HRR) was utilized to evaluate the
 to Excel data, they were synchronized with the start time and end time of every task rec-
 workload reflecting different physical conditions of the participants. HRR was calculated
 orded on site by the experimenter accompanying the participant.
 using the following equation [16–18]:
 2.4.2. Heart Rate Reserve (HRR) HRwork − HRrest
 HRR(%) = × 100 (1)
 Heart rate increased when an activity HRmax − HRrest
 involved heavy physical tasks. Therefore, it
 was used as an objective indicator to reflect the degree of workload. Different people have
 where HRwork was the average heart rate, determined by dividing the sum of heart rates
 different physical conditions. Their heart rates might be different even if they perform the
 collected with the wristband every minute by the working time for each task performed
 same physical activity. Thus, heart rate reserve (HRR) was utilized to evaluate the work-
 by the participant. HRrest was the heart rate measured from the participant resting in a
 load reflecting different physical conditions of the participants. HRR was calculated using
 seated position for 5 min [15]. HRmax was the maximum heart rate estimated using the
 the following equation [16–18]:
 age-prediction equation of (220–age) [19].
 −
 2.4.3. Metabolic Equivalent % (MET)
 of Task =
 −
 × 100 (1)
 Energy consumption was also used as an objective indicator to assess work intensity
 where was the average heart rate, determined by dividing the sum of heart rates
 by measuring the energy required for a physical activity, because an arduous task requires
 collected with the wristband every minute by the working time for each task performed
 more energy [20]. For reasons similar to heart rate, the metabolic equivalent of task (MET)
 by the participant. was the heart rate measured from the participant resting in a
 was calculated using the below equation, reflecting the weight of the participant with
 seated position for 5 min [15]. was the maximum heart rate estimated using the
 different physical conditions:
 age-prediction equation of (220–age) [19].
 energy consumption
 2.4.3. Metabolic Equivalent of ET = (MET)
 Task 3.5 × weight × 5/1000
 (2)
 Energy consumption was also used as an objective indicator to assess work intensity
 where energy the
 by measuring consumption is the average
 energy required energyactivity,
 for a physical consumption
 because(kcal/min),
 an arduousdetermined by
 task requires
 dividing the sum of energy consumptions collected with the wristband every minute
 more energy [20]. For reasons similar to heart rate, the metabolic equivalent of task (MET) by
Sustainability 2022, 14, 5229 5 of 11

 the working time required for each task to be performed by the participant. Weight was
 the body mass (kg) of the participant. One MET was defined as the energy consumption
 required for sitting quietly, which was approximately 3.5 mL/kg/min for an average adult
 and 5 kcal energy were released when 1000 mL of oxygen were metabolized [21].

 2.5. Statistical Analyses
 Descriptive statistics were analyzed to obtain means and standard deviations for the
 information of career period, working hours per week, the number of packages handled
 per day, and the number of delivery and pickup places per day, as well as time taken for
 every task and the use of carts, stairs, and ramps.
 One-way analysis of variance (ANOVA) and Tukey HSD (honest significant difference)
 tests were performed with HRR and MET as dependent variables. The independent variable
 was the five-level task of sorting inside a truck, delivering, picking up, driving, and resting.
 A Student’s t-test was also performed using two-level cart use, two-level stair use, and
 two-level ramp use, separately, as independent variables. The following statistical model
 for the ANOVA of HRR and MET was analyzed to determine the statistically significant
 main effect of the task:
 xij = µ + ti + eij (3)
 where xij is the dependent measure of either HRR or MET, µ is the mean value of the
 dependent variable, ti is the main effect of the five-level tasks, and eij is the residual.
 The frequency and percentage of the prevalence of musculoskeletal symptoms were
 obtained for the last 12 months, the last 12 months interfering with work, and the last
 7 days for nine body parts of neck, shoulder, elbow, wrist/hand, upper back, lower back,
 hip/thigh, knee, and ankle/foot by the standardized Nordic questionnaire (SNQ). One-way
 ANOVA and Tukey’s HSD tests were performed for the frequency as a dependent variable,
 with body part as an independent variable. The following statistical model for the ANOVA
 of SNQ was utilized to determine the statistically significant main effect of the body part.

 yij = µ + bi + eij (4)

 where yij is the dependent measure of the three questions of SNQ, µ is the mean value of
 the dependent variable, bi is the main effect of the nine-level body part evaluation, and eij
 is the residual.
 One-way ANOVA and Tukey HSD tests were also carried out with visual analogue
 scale (VAS) as the dependent variable. The independent variable was nine-level body part.
 Statistical significance was considered at p < 0.05. Similarly to SNQ, the following statistical
 model for the ANOVA of VAS was used to determine the statistically significant main effect
 of the body part:
 zij = µ + bi + eij (5)
 where zij is the dependent measure of VAS, µ is the mean value of the dependent variable,
 bi is the main effect of the nine-level body part, and eij is the residual.

 3. Results
 3.1. Job Characteristics
 Participants had an average career period of 8.8 ± 7.0 years. Their average working
 hours per week were 72.4 ± 7.2 h. The average number of packages handled per day was
 331.9 ± 89.4. The average number of delivery and pickup places per day was 193.4 ± 81.8.
 Participants spent an average of 4.3 ± 1.1 h (equal to 258 ± 66 min) per day on delivery
 and pickup. When the period was divided into the five tasks of sorting inside a truck,
 delivering, picking up, driving, and resting, delivering accounted for the most time, at
 162.3 ± 39.7 min. The times required were 48.7 ± 31.0 min for sorting inside a truck,
 28.7 ± 17.4 min for driving, 11.1 ± 9.7 min for picking up, and 7.2 ± 6.1 min for resting.
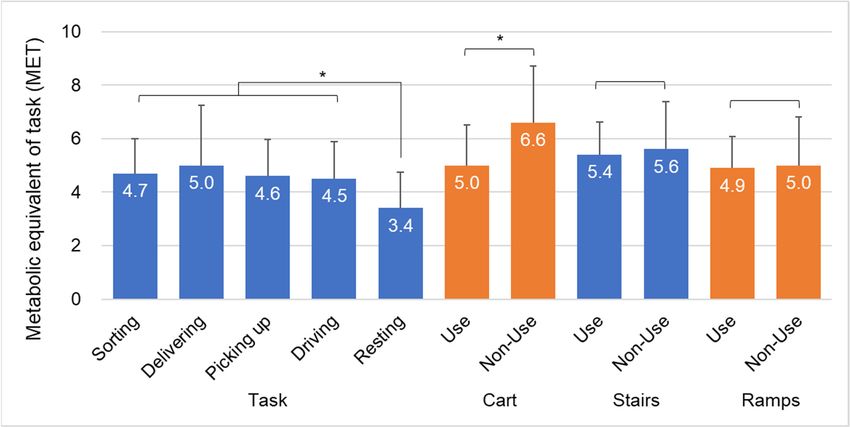
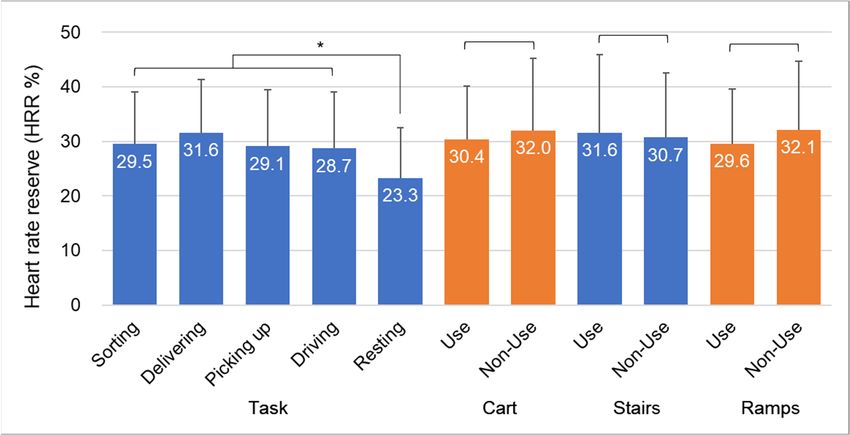
Participants had an average career period of 8.8 ± 7.0 years. Their average working
 hours per week were 72.4 ± 7.2 h. The average number of packages handled per day was
 331.9 ± 89.4. The average number of delivery and pickup places per day was 193.4 ± 81.8.
 Participants spent an average of 4.3 ± 1.1 h (equal to 258 ± 66 min) per day on delivery
 and pickup. When the period was divided into the five tasks of sorting inside a truck,
Sustainability 2022, 14, 5229 6 of 11
 delivering, picking up, driving, and resting, delivering accounted for the most time, at
 162.3 ± 39.7 min. The times required were 48.7 ± 31.0 min for sorting inside a truck, 28.7 ±
 17.4 min for driving, 11.1 ± 9.7 min for picking up, and 7.2 ± 6.1 min for resting.
 Participants used carts,
 Participants carts, stairs,
 stairs,and
 andramps
 rampsprimarily during
 primarily duringdelivering. TheThe
 delivering. average
 aver-
 times
 age of using
 times cart, cart,
 of using stairs,stairs,
 and ramps were 24.8
 and ramps were± 24.8 ± 9.2
 9.2 min, 15.7 ± 11.3
 min, ± 11.3
 15.7min, and min,
 2.5 ± and
 4.0
 2.5 ± respectively.
 min, 4.0 min, respectively.

 3.2.
 3.2.Heart
 Heart Rate
 Rate Reserve
 Reserve (HRR)
 (HRR)
 ANOVA
 ANOVA showed that the
 showed thetasks
 taskshad
 hada asignificant
 significant effect
 effect ononHRRHRR (F(4,
 (F(4, 1117)1117) = 7.58,
 = 7.58, p=
 p0.001).
 = 0.001). Tukey’s
 Tukey’s HSD HSD
 test test revealed
 revealed that that sorting
 sorting insideinside a truck,
 a truck, delivering,
 delivering, picking
 picking up, andup,
 and driving
 driving tasks
 tasks hadhadthethe
 samesame HRR.
 HRR. However,
 However, resting
 resting had
 had a asignificantly
 significantlylower
 lowerHRRHRRthan
 than
 others,
 others,asasseen
 seenininFigure
 Figure33andandTable Student’st-tests
 Table1.1.Student’s t-testsrevealed
 revealedno nosignificant
 significantdifference
 differencein
 HRR resulting from the usage of a cart (t(598) = − 1.748, p
 in HRR resulting from the usage of a cart (t(598) = −1.748, p = 0.081), stairs (t(581) ==0.869,
 = 0.081), stairs (t(581) 0.869,
 pp== 0.386), or ramps
 0.386), or ramps (t(518) = − 1.267, p = 0.206).
 −1.267, p = 0.206).

 Figure 3. Heart rate reserve (HRR) results for performing different tasks and using cart, stairs, and
 Figure 3. Heart rate reserve (HRR) results for performing different tasks and using cart, stairs, and
 ramps. The asterisk represents a significance level of 0.05.
 ramps. The asterisk represents a significance level of 0.05.
 Table 1. Mean differences of heart rate reserve (HRR) for different tasks based on Tukey’s HSD
 Table 1. Mean differences of heart rate reserve (HRR) for different tasks based on Tukey’s HSD test.
 test.

 Task SortingInside
 Sorting Inside aa Truck Delivering Picking up Driving Resting
 Task Delivering Picking up Driving Resting
 Truck
 Sorting inside a truck
 Sorting inside a truck
 Delivering −2.1
 Delivering −2.1
 Picking up
 Picking up 0.40.4 2.5 2.5
 Driving
 Driving 0.80.8 2.9 2.9 0.40.4
 Resting
 Resting 6.26.2
 * * 8.3 *8.3 * 5.85.8
 * * 5.4* *
 5.4
 * *The
 Themean
 mean difference
 difference is significant
 is significant at p
of the sorting inside a truck, delivering, picking up, and driving tasks were similar to each
 other. However, resting was associated with a significantly lower MET than other tasks,
 as seen in Figure 4 and Table 2.
 Student’s t-tests showed significant differences in MET resulting from cart use (t(598)
Sustainability 2022, 14, 5229 = −3.260, p = 0.001). Cart use had a lower MET than non-use. However, the MET was7 not of 11
 significantly changed by stair use (t(581) = −0.258, p = 0.796) or ramp use (t(518)= −0.146, p
 = 0.884).

 Figure 4. Metabolic equivalent of the task (MET) of performing different tasks and using carts, stairs,
 Figure 4. Metabolic equivalent of the task (MET) of performing different tasks and using carts, stairs,
 and ramps. The asterisks represent a significance level of 0.05.
 and ramps. The asterisks represent a significance level of 0.05.
 Table 2. Mean differences in the metabolic equivalent of task (MET) when performing different
 Table Mean differences
 tasks,2.assessed by Tukey’sinHSD
 the metabolic
 test. equivalent of task (MET) when performing different tasks,
 assessed by Tukey’s HSD test.
 Task Sorting Inside a Truck Delivering Picking up Driving Resting
 Sorting inside Sorting Inside a
 Task a truck Delivering Picking Up Driving Resting
 Delivering Truck
 −0.3
 Sorting inside up
 Picking a truck 0.1 0.4
 Delivering
 Driving −0.30.2 0.5 0.1
 Picking up 0.1 0.4
 Resting
 Driving 0.2
 1.3 * 0.5
 1.6 * 1.2
 0.1
 * 1.1 *
 * The mean difference is significant
 Resting 1.3 at
 * p < 0.05. 1.6 * 1.2 * 1.1 *
 * The mean difference is significant at p < 0.05.
 3.4. Standardized Nordic Questionnaire (SNQ)
 The results Nordic
 3.4. Standardized of the standardized
 Questionnaire Nordic
 (SNQ) questionnaire (SNQ) reveal that the average
 prevalence rate of having any trouble
 The results of the standardized Nordic (ache, questionnaire
 pain, discomfort)
 (SNQ)wasreveal
 43% forthatthethe
 lastaver-
 12
 months, 3% for the last 12 months that interfered with work, and 20%
 age prevalence rate of having any trouble (ache, pain, discomfort) was 43% for the last for the last 7 days,
 asmonths,
 12 illustrated3%inforTable 3. The
 the last results of
 12 months thatthe ANOVAwith
 interfered showwork,
 that and
 the lower
 20% for back
 theandlast
 wrist/hand were the most affected body parts by the prevalence of musculoskeletal
 7 days, as illustrated in Table 3. The results of the ANOVA show that the lower back and symp-
 toms in thewere
 wrist/hand last 12
 themonths (F(8, 171)
 most affected body= 3.12,
 partspby
 = 0.003) and in the
 the prevalence oflast 7 days (F(8, 171)
 musculoskeletal symp-=
 3.03, p = 0.003). The lower back had the greatest prevalence rate, of 90% in
 toms in the last 12 months (F(8, 171) = 3.12, p = 0.003) and in the last 7 days (F(8, 171) = 3.03,the last 12
 pmonths
 = 0.003). andThe 50% in the
 lower backlasthad
 7 days. The prevalence
 the greatest of wrist/hand
 prevalence rate, of 90%symptoms
 in the lastwas 50% in
 12 months
 the last 12 months and 25% in the last 7 days.
 and 50% in the last 7 days. The prevalence of wrist/hand symptoms was 50% in the last
 12 months and 25% in the last 7 days.

 Table 3. Prevalence of musculoskeletal symptoms in body parts among participants (N = 20).

 In the Last 12 In the Last 12 Months
 Body Parts In the Last 7 Days
 Months Interfering with Work
 Neck 6 (30%) 0 (0%) 3 (15%)
 Shoulder 8 (40%) 1 (5%) 4 (20%)
 Elbow 6 (30%) 0 (0%) 0 (0%)
 Wrist/hand 10 (50%) 0 (0%) 5 (25%)
 Upper back 7 (35%) 0 (0%) 2 (10%)
 Lower back 18 (90%) 3 (15%) 10 (50%)
 Hip/thigh 7 (35%) 0 (0%) 3 (15%)
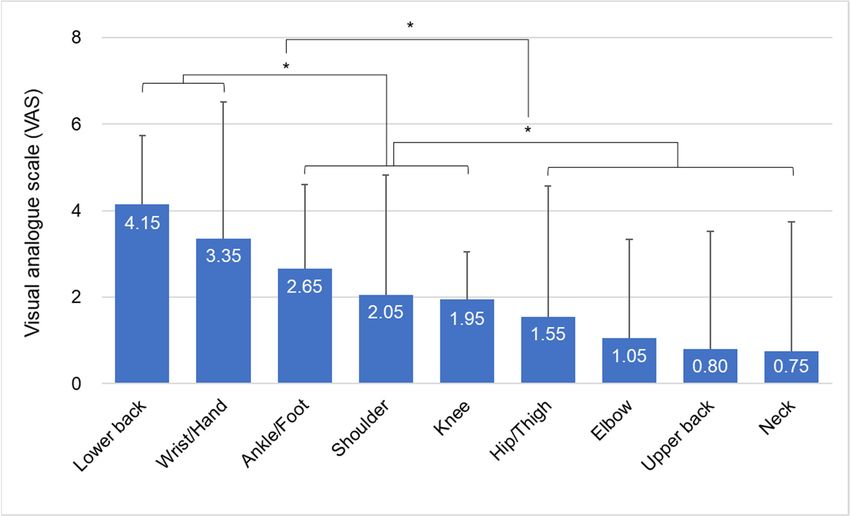
Table 3. Prevalence of musculoskeletal symptoms in body parts among participants (N = 20).

 In the Last 12 Months
Sustainability 2022, 14, 5229
 Body Parts In the Last 12 Months In the Last 7 Days
 8 of 11
 Interfering with Work
 Neck 6(30%) 0(0%) 3(15%)
 Shoulder 8(40%) 1(5%) 4(20%)
 3. Cont.
 TableElbow 6(30%) 0(0%) 0(0%)
 Wrist/hand 10(50%) 0(0%) 5(25%)
 In the Last 12 In the Last 12 Months
 Body Parts
 Upper back 7(35%) 0(0%) In the Last 7 Days
 2(10%)
 Months Interfering with Work
 Lower back 18(90%) 3(15%) 10(50%)
 Knee 8 (40%) 0 (0%) 4 (20%)
 Hip/thigh
 Ankle/foot 77(35%)
 (35%) 0(0%)
 1 (5%) 3(15%)
 5 (25%)
 Knee 8(40%) 0(0%) 4(20%)
 Mean 8.6 (43%) 0.6 (3%) 4.0 (20%)
 Ankle/foot 7(35%) 1(5%) 5(25%)
 Mean 8.6(43%) 0.6(3%) 4.0(20%)
 3.5. Visual Analogue Scale (VAS)
 The ANOVA
 3.5. Visual Analoguerevealed that body parts had a significant effect on the pain of VAS
 Scale (VAS)
 (F(8, 171) = 4.41, p < 0.001). Tukey’s HSD test revealed that lower back and wrist/hand
 The ANOVA revealed that body parts had a significant effect on the pain of VAS (F(8,
 were included in the most painful group, as illustrated in Figure 5 and Table 4. Lower
 171) = 4.41, p < 0.001). Tukey’s HSD test revealed that lower back and wrist/hand were
 back and wrist/hand had pain scores of 4.15 and 3.35, respectively. Ankle/foot, shoulder,
 included in the most painful group, as illustrated in Figure 5 and Table 4. Lower back and
 and knee were in a different group. Hip/thigh, elbow, upper back, and neck were in
 wrist/hand had pain scores of 4.15 and 3.35, respectively. Ankle/foot, shoulder, and knee
 another group.
 were in a different group. Hip/thigh, elbow, upper back, and neck were in another group.

 Figure5.5. Pain
 Figure Pain levels
 levels of
 of body
 body parts
 parts based
 based on
 on the
 the visual
 visual analogue
 analogue scale
 scale (VAS). The asterisk
 (VAS). The asterisk repre-
 represents
 sents a significance level of 0.05.
 a significance level of 0.05.
 Table 4. Mean differences in the visual analogue scale (VAS) for Tukey’s HSD test of body parts.
 Table 4. Mean differences in the visual analogue scale (VAS) for Tukey’s HSD test of body parts.
 Upper
 Task Lower Back Wrist/Hand Ankle/Foot Shoulder Knee Hip/Thigh Elbow Neck
 Task Lower Back Wrist/Hand Ankle/Foot Shoulder Knee Hip/Thigh Elbow Upper
 BackBack Neck
 Lower
 Lower back
 back
 Wrist/Hand
 Wrist/Hand 0.8 0.8
 Ankle/Foot
 Ankle/Foot 1.5 *1.5 * 0.7 *0.7 *
 Shoulder 2.1 * 1.3 * 0.6
 Shoulder
 Knee 2.2 *
 2.1 * 1.4 *
 1.3 * 0.7
 0.6 0.1
 Knee
 Hip/Thigh 2.6 *2.2 * 1.8 *1.4 * 1.1 * 0.7 0.5 *0.1 0.4 *
 Hip/Thigh
 Elbow 3.1 *2.6 * 2.3 *1.8 * 1.6 *1.1 * 1.0 *0.5 * 0.90.4
 * * 0.5
 Upper back 3.4 * 2.6 * 1.9 * 1.3 * 1.2 * 0.8 0.3
 Neck 3.4 * 2.6 * 1.9 * 1.3 * 1.2 * 0.8 0.3 0.1
 * The mean difference is significant at p < 0.05.
Sustainability 2022, 14, 5229 9 of 11

 4. Discussion
 The purpose of this study was to evaluate the physical workload of package deliverers,
 focusing on pickup and delivery tasks in the Republic of Korea via heart rate reserve (HRR),
 metabolic equivalent of task (MET), standardized Nordic questionnaire (SNQ), and visual
 analogue scale (VAS) using a wristband on site. Deliverers who participated in this study
 worked for 72.4 h per week, spent 4.3 h per day on pickup and delivery tasks, and handled
 331.9 packages per day. Shin and Lee [2] found similar working hours per week, of 74.0 h.
 However, their participants spent 8.5 h on pickup and delivery tasks, and handled more
 than 252.6 packages. Jang et al. [9] found that mailmen in the Republic of Korea have
 shorter working durations per week, at 57.5 h, than those in the present study and in
 Shin and Lee’s study [2]. Such differences among studies are mainly due to the period of
 experiment, and the pickup and delivery areas covered by the participants. The experiment
 in the present study was performed in a week prior to Korean Thanksgiving Day, when
 the volumes of deliverers usually increased. In addition, the participants were in charge of
 apartments and shopping areas where many packages were handled at one time, with a
 relatively short carrying distance.
 It was found that deliverers spent the longest time (162.3 min) on delivering among
 the five tasks examined in the study. They used stairs and ramps only for short durations
 (15.7 min and 2.5 min, respectively) while delivering and picking up. The occasional use of
 stairs and ramps due to the required delivery method would not be related to the physical
 fatigue of deliverers. The participants use a loaded cart to get from the truck to the entrance
 of an apartment, and dragged the cart up a short ramp installed in the entrance for the
 disabled. They then took an elevator with the cart, moved up to the top floor, and stopped
 at each floor to deliver packages to the designated door while the elevator door was opened.
 They generally only used stairs for low stories.
 This study has revealed that package deliverers required about 29.7% of HRR for
 pickup and delivery tasks. This amount of HRR was similar to that of about 27% of
 mailmen in the Republic of Korea [9], and 29.2% of short distance gas cylinder deliverers
 in Canada assessed by Sekkay et al. [22]. They concluded that a gas cylinder delivering
 task would be moderate work, and that 3.5 h would be appropriate for the task in a given
 working day.
 Although this study did not find any statistically significant difference in HRR or MET
 among task types, the tasks of delivering as well as sorting inside a truck appeared to be
 difficult, because delivering required handling many packages at once and walking a long
 distance. Sorting inside a truck required loading packages into a cart placed outside by
 repetitively moving up and down the truck. Picking up showed a relatively low workload
 because a few packages were returned from an apartment complex to a truck.
 The use of cart, stairs, and ramps had no significantly different effects on the physical
 fatigue of deliverers in terms of HRR or MET, because they mainly used elevators—instead
 of carts or stairs and short ramps—for the short duration they spent at the entrance of an
 apartment. Participants used carts to move slowly when handling many packages, while
 they carried them by hand in the case of only having a few packages. Both cases resulted in
 a lower burden on heart rate and energy consumption. In addition, they used stairs at low
 stories after getting off an elevator, which required less physical exertion than ascending
 stairs [23].
 Both the standardized Nordic questionnaire (SNQ) and visual analogue scale (VAS)
 showed that the lower back and wrist/hand were the most painful body parts, resulting
 in a greater prevalence of musculoskeletal symptoms due to repetitive trunk bending and
 small package handling while performing pickup and delivery tasks.

 5. Conclusions
 This study performed empirical research by systematically categorizing factors af-
 fecting package deliverers into demographic characteristics, job characteristics, task type,
 and working conditions in order to evaluate the degree of their physical workload. The
Sustainability 2022, 14, 5229 10 of 11

 two objective indicators of heart rate (converted to heart rate reserve (HRR)) and energy
 consumption (converted to metabolic equivalent of task (MET)) were measured with a
 wristband in real time, and the two subjective indicators of standard Nordic questionnaire
 (SNQ) and visual analogue scale (VAS) were surveyed.
 The statistical analyses of the indicators revealed that the pickup and delivery tasks
 carried out by the package deliverers in the Republic of Korea could be considered as
 having a “moderate level” of work difficulty. Deliverers suffered from pain in the lower
 back and wrist/hand due to repetitive lifting and handing motions. Based on the results
 found of the current study, the use of a cart is recommended, as it has the advantage
 of enabling the handling of many packages at once, with less physical effort required
 of deliverers.
 This study established a research method suitable for assessing the degree of physical
 workload of package deliverers through a series of research processes. It could fill in
 the gaps in the research on deliverers themselves. Although only twenty deliverers were
 recruited in this study, the sample sizes of the objective indicators of HRR and MET may be
 just about enough to reach statistically significant conclusions, because data were collected
 from the wristbands every minute. However, the data surveyed from deliverers would
 not be enough to reliably generalize the results on the subjective indicators of SNQ or
 VAS. More research on deliverers is necessary to derive significant generalized results. The
 method suggested by this study would be helpful for such research.

 Author Contributions: Conceptualization, S.-C.R. and M.-C.J.; methodology, M.-C.J.; formal analysis,
 M.-C.J.; investigation, S.-C.R.; data collection, S.-C.R.; writing—original draft preparation, M.-C.J.;
 writing—review and editing, S.-C.R. All authors have read and agreed to the published version of
 the manuscript.
 Funding: This research was funded by Jungseok Logistics Foundation Grant and the APC was
 funded by Jungseok Logistics Foundation.
 Institutional Review Board Statement: The study was conducted in accordance with the Declaration
 of Helsinki and approved by the Institutional Review Board (or Ethics Committee) of Ajou University
 (protocol code 2021-0028-005 and date of approval of 23 February 2021).
 Informed Consent Statement: Informed consent was obtained from all subjects involved in the
 study. Written informed consent has been obtained from the participant(s) to publish this paper.
 Data Availability Statement: Not applicable.
 Conflicts of Interest: The authors declare no conflict of interest.

References
1. National Logistics Information Center. Consumer Logistics Statistics. Available online: https://www.nlic.go.kr/nlic/
 parcelServiceLogistics.action (accessed on 14 April 2022).
2. Shin, T.J.; Lee, J.H. Labor Condition and Policy Improvement Plan for Couriers in Seoul; Research Report 2017-01; Seoul Labor Center:
 Seoul, Korea, 2017; ISBN 979-11-87917-08-3.
3. Lee, J.S.; Lee, C.S.; Kim, S.H. Development Plan of Courier Industry in Response to the Increased Demand for Services; Issue Paper-17-03;
 Korea Transport Institute: Sejong, Korea, 2017; ISBN 978-89-5503-966-5.
4. Anderson, N.J.; Smith, C.K.; Byrd, J.L. Work-related injury factors and safety climate perception in truck drivers. Am. J. Ind. Med.
 2017, 60, 711–723. [CrossRef] [PubMed]
5. Christie, N.; Ward, H. The health and safety risks for people who drive for work in the gig economy. J. Transp. Health 2019, 13,
 115–127. [CrossRef]
6. Goodchild, A.; Toy, J. Delivery by drone: An evaluation of unmanned aerial vehicle technology in reducing CO2 emissions in the
 delivery service industry. Transp. Res. D Transp. Environ. 2018, 61, 58–67. [CrossRef]
7. Sawadsitang, S.; Niyato, D.; Tan, P.S.; Wang, P. Joint ground and aerial package delivery services: A stochastic optimization
 approach. IEEE Trans. Intell. Transp. Syst. 2019, 20, 2241–2254. [CrossRef]
8. Yoo, W.; Yu, E.; Jung, K. Drone delivery: Factors affecting the public’s attitude and intention to adopt. Telemat. Inform. 2018, 35,
 1687–1700. [CrossRef]
9. Jang, T.W.; Choi, W.J.; Moon, M.K.; Park, J.H. Study on the Measurement of Labor Intensity and Physical Load of Mailmen; Research
 Report; Korea Post: Seoul, Korea, 2018.
Sustainability 2022, 14, 5229 11 of 11

10. Baek, H.C.; Jeon, Y. Work Activity Hours and Health Hazard of Package Deliverer; Monthly Industrial Health; Korea Industrial Health
 Association: Seoul, Korea, 2021; Volume 394, pp. 30–35, ISBN 1225-7087.
11. Kuorinka, I.; Jonsson, B.; Kilbom, A.; Vinterberg, H.; Biering-Sørensen, F.; Andersson, G.; Jørgensen, K. Standardised Nordic
 questionnaires for the analysis of musculoskeletal symptoms. Appl. Ergon. 1987, 18, 233–237. [CrossRef]
12. Palmer, K.; Smith, G.; Kellingray, S.; Cooper, C. Repeatability and validity of an upper limb and neck discomfort questionnaire:
 The utility of the standardized Nordic questionnaire. Occup. Med. 1999, 49, 171–175. [CrossRef] [PubMed]
13. Aitken, R.C. Measurement of feelings using visual analogue scales. Proc. R. Soc. Med. 1969, 62, 989–993. [PubMed]
14. Crellin, D.J.; Harrison, D.; Santamaria, N.; Huque, H.; Babl, F.E. The psychometric properties of the visual analogue scale applied
 by an observer to assess procedural pain in infants and young children: An observational study. J. Pediatric Nurs. 2021, 59, 89–95.
 [CrossRef] [PubMed]
15. Cheng, Y.J.; Macera, C.A.; Church, T.S.; Blair, S.N. Heart rate reserve as a predictor of cardiovascular and all-cause mortality in
 men. Med. Sci. Sports Exerc. 2002, 34, 1873–1878. [CrossRef] [PubMed]
16. Korshøj, M.; Rasmussen, C.L.; de Oliveira Sato, T.; Holtermann, A.; Hallman, D. Heart rate during work and heart rate variability
 during the following night: A day-by-day investigation on the physical activity paradox among blue-collar workers. Scand. J.
 Work Environ. Health 2021, 47, 387–394. [CrossRef] [PubMed]
17. Panton, L.B.; Graves, J.E.; Pollock, M.L.; Garzarella, L.; Carroll, J.F.; Leggett, S.H.; Lowenthal, D.T.; Guillen, G.J. Relative heart
 rate, heart rate reserve, and VO2 during submaximal exercise in the elderly. J. Gerontol. A Biol. Sci. Med. Sci. 1996, 51, M165–M171.
 [CrossRef] [PubMed]
18. Velásquez, J.; Briceno, L.; Ortiz, L.; Solarte, S.; Agredo, R. Maximum acceptable work time for the upper limbs task and lower
 limbs task. Procedia Manuf. 2015, 3, 4584–4590. [CrossRef]
19. Fox, S.M., 3rd; Haskell, W.L. Physical activity and the prevention of coronary heart disease. Bull. N. Y. Acad. Med. 1968, 44,
 950–965. [CrossRef]
20. Mendes, M.A.; da Silva, I.; Ramires, V.; Reichert, F.; Martins, R.; Ferreira, R.; Tomasi, E. Metabolic equivalent of task (METs)
 thresholds as an indicator of physical activity intensity. PLoS ONE 2018, 13, e0200701. [CrossRef] [PubMed]
21. Ainsworth, B.E.; Haskell, W.L.; Leon, A.S.; Jacobs, D.R., Jr.; Montoye, H.J.; Sallis, J.F.; Paffenbarger, R.S., Jr. Compendium of
 physical activities: Classification of energy costs of human physical activities. Med. Sci. Sports Exerc. 1993, 25, 71–80. [CrossRef]
 [PubMed]
22. Sekkay, F.; Imbeau, D.; Dubé, P.A.; Chinniah, Y.; de Marcellis-Warin, N.; Beauregard, N.; Trépanier, M. Assessment of physical
 work demand of short distance industrial gas delivery truck drivers. Appl. Ergon. 2020, 89, 103222. [CrossRef] [PubMed]
23. Teh, K.C.; Aziz, A.R. Heart rate, oxygen uptake, and energy cost of ascending and descending the stairs. Med. Sci. Sports Exerc.
 2002, 34, 695–699. [CrossRef] [PubMed]
You can also read