Evaluation of Twitter data for an emerging crisis: an application to the first wave of COVID 19 in the UK - Nature
←
→
Page content transcription
If your browser does not render page correctly, please read the page content below
www.nature.com/scientificreports
OPEN Evaluation of Twitter data
for an emerging crisis:
an application to the first wave
of COVID‑19 in the UK
I Kit Cheng1,3, Johannes Heyl1,3*, Nisha Lad1,3, Gabriel Facini2 & Zara Grout1
In the absence of nationwide mass testing for an emerging health crisis, alternative approaches could
provide necessary information efficiently to aid policy makers and health bodies when dealing with
a pandemic. The following work presents a methodology by which Twitter data surrounding the first
wave of the COVID-19 pandemic in the UK is harvested and analysed using two main approaches. The
first is an investigation into localized outbreak predictions by developing a prototype early-warning
system using the distribution of total tweet volume. The temporal lag between the rises in the number
of COVID-19 related tweets and officially reported deaths by Public Health England (PHE) is observed
to be 6–27 days for various UK cities which matches the temporal lag values found in the literature.
To better understand the topics of discussion and attitudes of people surrounding the pandemic, the
second approach is an in-depth behavioural analysis assessing the public opinion and response to
government policies such as the introduction of face-coverings. Using topic modelling, nine distinct
topics are identified within the corpus of COVID-19 tweets, of which the themes ranged from retail to
government bodies. Sentiment analysis on a subset of mask related tweets revealed sentiment spikes
corresponding to major news and announcements. A Named Entity Recognition (NER) algorithm is
trained and applied in a semi-supervised manner to recognise tweets containing location keywords
within the unlabelled corpus and achieved a precision of 81.6%. Overall, these approaches allowed
extraction of temporal trends relating to PHE case numbers, popular locations in relation to the use
of face-coverings, and attitudes towards face-coverings, vaccines and the national ‘Test and Trace’
scheme.
Twitter as a popular social medium platform, is a host for users to express their opinions. Due to its abundance of
textual data and user metadata, it can be used for the input of Machine Learning (ML) algorithms. Behavioural
patterns and trends can be extracted from Twitter to give potential insights within society, and public attitudes
can be better understood and predicted. These areas can be important in aiding government bodies through
crisis management, particularly in exploring new methods to track the initial spread of a virus. Such examples
that have been investigated include the use of wastewater testing1 and contact-tracing phone applications, as
well as using social media data as a t ool2. An unusual feature of COVID-19 is its asymptomatic nature, which
had led to significant community transmission with symptoms being completely undetectable in individuals
by using nationwide ‘Test and Trace’ schemes. This provides the necessary motivation to explore alternative
approaches, particularly based on language processing, to predict the evolution of and attitudes towards the
pandemic. This is of particular significance early in a pandemic when there is a significant strain on testing
resources and equipment.
The focus of this study is on assessing the ability of Twitter as an outbreak predictor and behavioural analysis
tool in the context of the COVID-19 pandemic, specifically during periods of emerging crisis before government
intervention i.e. pre-mass testing. The aim was to investigate whether the total volume of tweets corresponding
to a particular Twitter API query could be used as a proxy to model the evolution of PHE case numbers dur-
ing the initial phase of an emerging global crisis and determine the time-delay for the occurrence of the next
major outbreak. The ability to assess public opinion and correlate trends with reported news is also investigated
1
Department of Physics and Astronomy, University College London, Gower Street, London WC1E 6BT,
UK. 2Department of Physics, University of Warwick, Coventry CV4 7AL, UK. 3These authors contributed equally: I
Kit Cheng, Johannes Heyl and Nisha Lad. *email: johannes.heyl.19@ucl.ac.uk
Scientific Reports | (2021) 11:19009 | https://doi.org/10.1038/s41598-021-98396-9 1
Vol.:(0123456789)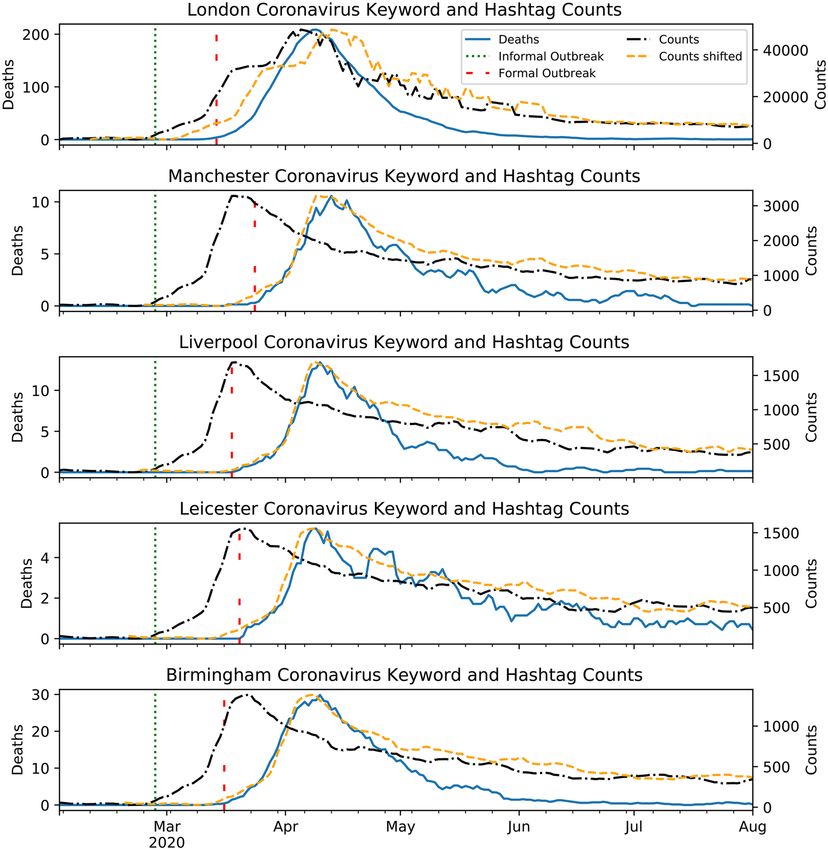
www.nature.com/scientificreports/
Figure 1. Workflow used to acquire, store and process the data obtained via the Twitter API data8 and
counts5 endpoints, as well as the data obtained from Public Health E ngland7 COVID-19 daily confirmed
infection case numbers in the UK.
during the initial outbreak using the textual content of tweets. The aim here was to determine the main subjects
of discussion on Twitter surrounding the COVID-19 pandemic, as well as the prevalence of face-coverings in
various locations in the UK. Face-coverings had been introduced by the UK government as a recommended
precautionary measure initially, and later mandatory by law3, to help reduce the spread of the virus, and as such
was a popular topic of online conversation.
The use of alternative methods to detect an initial global crisis outbreak, as well as the initial public response,
can yield the necessary information for governments to respond effectively. The techniques and analysis dis-
cussed in this study can provide useful tools for early intervention of policy makers, particularly during periods
of emerging global crisis before mass-testing is readily available.
Material and methodology
Data acquisition. A comprehensive COVID-19 Twitter data set containing all tweets from the UK over the
duration of the pandemic would be ideal for performing outbreak prediction and behavioural analysis. However,
due to limitations on the amount of data that could be collected via the Twitter API endpoints, a focused study
on different cities in England was conducted. An initial exploratory analysis found that the cities with the largest
fraction of tweets in the UK were London, Manchester, Liverpool and Birmingham, some of the largest cities by
population in the UK.
In order to conduct regional analysis, the location of a Twitter user can be inferred in different ways. Typically
tweet objects contain none, one or both of the following location-related attributes;4 location or geotagged.
A geotagged tweet contains latitude and longitude coordinates tagged by the user enabling their precise loca-
tion to be accessible. Whereas the location attribute is a user inputted free-form string, typically indicating a
user’s home location on their profile. A preliminary analysis showed that approximately 2% of the tweet objects
aggregated contained a non-null geotagged attribute. This provided a reliable source to determine regional
dependence, however the volume of geotagged tweets obtained was insufficient to extract any meaningful
trends. Approximately 97% of tweet objects were found to contain a non-null location attribute, where a
user’s home location could be inferred. Non-essential travel in the UK stopped on March 16th 2020 alongside
the first national lockdown which began on March 23rd 2020. This meant that the majority of the UK population
were stationary to some degree in their daily movements. For this reason, a heuristic approach was taken where
the location of a user was inferred via their profile location. More sophisticated methods would be needed in
order to improve the reliability of user location in order to conduct further analysis on varying levels of location
granularity, whether that be for the size of a town, city or county. An approach that may be useful in this setting
could be to explore other methodologies whereby a user’s location could be inferred or extracted from their
network of friends or the textual content of a subset of their tweets.
The workflow used to acquire, store and process the data collected from the Twitter API is shown in Fig. 1.
The total volume of tweets matching a particular query can be retrieved per minute, hour or day via the counts
endpoint5 of the Twitter API. This provides a time-series distribution of the frequency of a particular keyword(s)
or hashtag(s) within a given location. Using online hashtag t rackers6, it is found that the most frequently used
Scientific Reports | (2021) 11:19009 | https://doi.org/10.1038/s41598-021-98396-9 2
Vol:.(1234567890)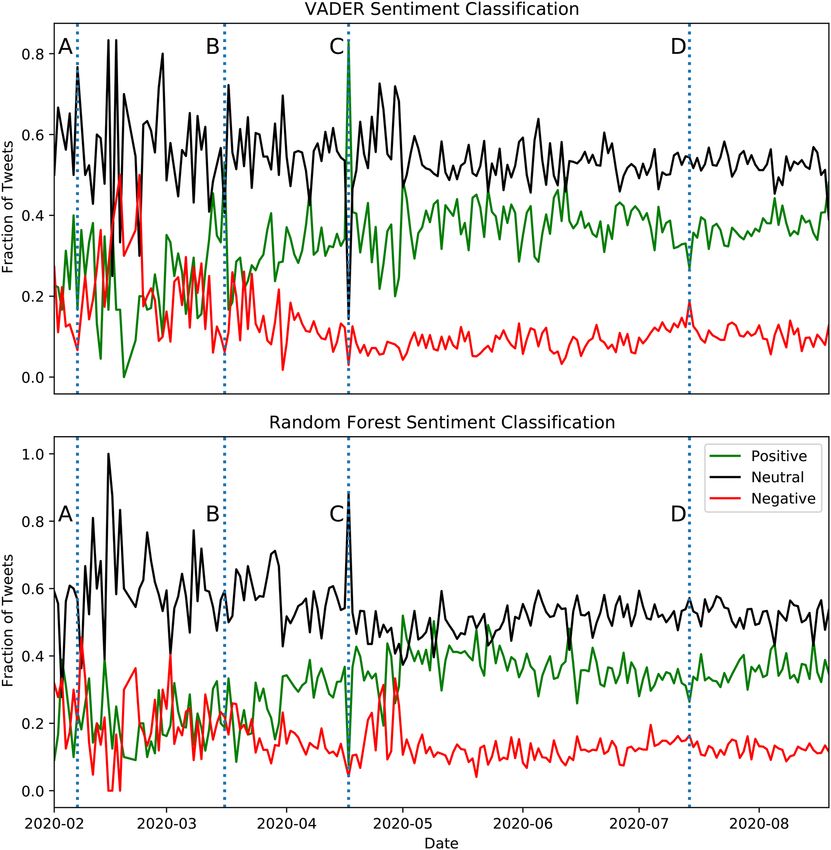
www.nature.com/scientificreports/
Base twitter API query
#Covid OR #coronavirus OR covid OR coronavirus lang:en -is:retweet profile_country:GB
‘Face mask’ OR ‘face covering’ lang:en -is:retweet profile_country:GB
Cough OR #cough lang:en -is:retweet profile_country:GB
Fever OR #fever lang:en -is:retweet profile_country:GB
Symptom OR #symptom lang:en -is:retweet profile_country:GB
Table 1. Base queries made against the Twitter API counts endpoint5 to obtain the total volume of tweets
containing the above hashtags or keywords. Each query was made for the following UK locations: London,
Manchester, Liverpool, Birmingham & Leicester, whereby hashtags and keywords were both queried.
Aggregated tweets were filtered to be of English language and retweets were negated. The time period queried
was between February 1st - August 19th 2020, spanning the duration of the first major peak in case numbers in
the UK.
Base twitter API query Number of unique tweets
#Covid OR #coronavirus OR covid OR coronavirus 771,776
Face mask’ OR ‘face covering’ 33,641
Table 2. Base queries made against the Twitter API data endpoint8 to obtain tweet objects containing the
hashtags and keywords stated, where tweet locations originated from the UK. Aggregated tweets were filtered
to be of English language and retweets were negated. The time period queried was between February 1st -
August 19th 2020, spanning the duration of the first major peak in case numbers in the UK. The number of
unique tweet objects obtained for each query during this time period is indicated.
hashtags and keywords over the course of the pandemic in the UK (February 1st - August 19th 2020) were
#covid and #coronavirus, where hashtags are commonly used to give context and categorise the theme
or common trends within a tweet. Symptom related keywords were also identified as high frequency use within
tweets, such keywords included cough, fever and symptom. As such, queries were made against the Twit-
ter API for tweets containing these hashtags and keywords, focusing on tweets located in the cities of London,
Manchester, Liverpool, Birmingham and Leicester, between February 1st - August 19th 2020. These locations
were chosen in order to investigate the first major peak in the outbreak in the four largest cities in the UK based
on population size (London, Manchester, Liverpool & Birmingham). The city of Leicester was also chosen, which
saw a significant second peak in case numbers during June 2020. It was of particular interest as it was one of the
first cities in England to have a second wave at a time when community testing was being significantly ramped
up. As such, there was an interest to see if this second outbreak could be observed in Twitter data. Tweets were
also filtered to be of English language and retweets were negated. A similar approach was taken to determine
the most popular keywords used in the context of face-coverings, where the most frequently used keywords
were face mask and face covering. Table 1 shows the base queries used to build Twitter API queries
for the counts endpoint. Daily confirmed infection case numbers recorded via P HE7 were also collected as a
means to use in time-series analysis. Case numbers were partitioned based on the five UK locations of interest.
In order to build a corpus of tweets, the data endpoint8 of the Twitter API was used. This endpoint returns a
maximum of 500 tweet objects per API request matching a particular query, where each tweet object contains the
textual content of the tweet and user metadata. In order to sample the textual content of COVID-19 related tweets
spanning the duration of the first major outbreak in the UK, the data endpoint was queried for UK originating
tweets containing #covid OR #coronavirus OR covid OR coronavirus, as well as a separate
query containing face mask OR face covering. The time period of the API query was structured to
obtain a maximum of 500 tweets per hour between 09:00 - 22:00 GMT each day between 1st February - 19th
August 2020. Table 2 shows the base queries used to build Twitter API queries against the data endpoint, where
a corpus of ∼800,000 unique tweets were acquired.
Time series analysis. In order to see how far ahead tweet volume was able to forecast an outbreak, the
optimal time lag between the two had to be determined. Correlation analysis was performed by considering how
the time series of the volume of tweets (extracted using the counts endpoint) for queries 1 and 3-5 in Table 1 cor-
related with the time series of deaths for each city under consideration. Spearman’s rank correlation coefficient
was then used to assess any potential correlation. The time lag which maximised the correlation coefficient was
deemed the optimal one.
Topic modelling. To better understand the main themes of discussion within COVID-19 related tweets,
which is not possible using tweet volume analysis alone, topic modelling was performed on the text field of
the tweet objects. Topic modelling is an unsupervised text mining technique used to find patterns of word co-
occurrence in a corpus. It can be applied within information retrieval, document classification and exploratory
analysis of a large corpus. Latent Dirichlet Allocation (LDA) is an example of topic modelling which optimises
Scientific Reports | (2021) 11:19009 | https://doi.org/10.1038/s41598-021-98396-9 3
Vol.:(0123456789)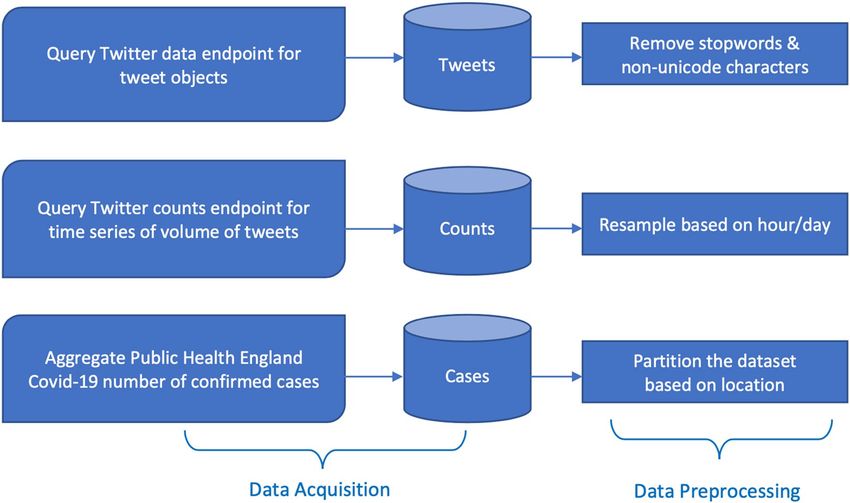
www.nature.com/scientificreports/
the probability of a word belonging to a specific topic. It assumes that a corpus of text can be described by a
distribution of topics, where each topic can be defined by a distribution of w ords9. The presence of each word
in a document is thus assigned to a topic based on its probability, leading to a topic mixture for the document.
This technique has been successfully applied in social science settings to analyse online support group posts to
identify coherent topics10.
An LDA model was trained on the corpus of tweets using the Gensim Python library11 in Python. As tweets
were not labelled by topic, there was no prior knowledge of how many topics may exist. Hence, these underlying
topics within the corpus were said to be ‘latent’ or hidden. To initiate the model, the number of topics and the
a-priori belief for each topics’ probability (usually inversely proportional to the number of topics) were speci-
fied. Nine topics with equal probability were chosen based on a quantitative topic coherence m etric11 during
hyperparameter tuning and interpretability of the resulting topic word clouds. There is a level of subjectivity in
the final step which required manually assigning topic names to each word cloud.
Named Entity Recognition (NER). To further characterise the content in a tweet, a Named Entity Rec-
ognition (NER)12 model was used. NER models automatically find custom entities within a large corpus of
unlabelled text, by utilizing a semi-supervised learning approach in order to learn the vector space of phrases to
discriminate. Starter seeds are provided to the model to initialize the vector space, followed by iteratively manu-
ally labelling additional samples, retraining and correcting the model’s predictions as required.
The model was initially trained to recognise location-based entities from a pre-trained word vector model,
extracted from a corpus of Reddit c omments13. This formed the basis of the token-to-vector layer which contains
vector representations for each multi-word expression. The aim was to train a model to recognise location-based
entities within the context of tweets containing facemask or face covering and thus determine how the
unique mentions of location keywords evolved over time. A list of seed keywords were then provided in order
to direct the model close to the target vector space. These seeds included; ‘airport’, ‘bus’, ‘restaurant’, ‘pub’, ‘super-
market’. After training on labelled text, the model can assign a specific class to entities it recognises. New phrases
and suggestions were outputted from the Reddit corpus with a high similarity score to the seeds. These entities,
known as ‘match patterns’, together with a sample of 600 tweets, were manually annotated using the Prodigy
annotation tool14 for the presence of location-based words forming a ground truth dataset. The NER model was
then trained and applied on all ‘mask’ related tweets to identify the presence of a location.
Sentiment analysis. A recent literature review presented the use of sentiment analysis based on opinion-
lexicon methods, in order to analyse text sentiment, extract data from social media such as Twitter and the
application of sentiment analysis to world events, healthcare, politics and b usiness15. In this study, two methods
were used to evaluate the time evolution of fraction of tweets with negative, neutral and positive sentiments
related to specific topics.
The first method was the Valence Aware Dictionary for Sentiment Reasoning (VADER) model16. This text
sentiment analysis model is sensitive to both polarity (positive or negative) and strength of emotion. VADER
computes a normalised score (or ‘compound score’), from summing the valence score of each word in the input
text. Here, valence is a measure of ‘goodness’ or ‘badness’ of a word which was determined from 10 independ-
ent human annotators. The compound score ranges from − 1 (extremely negative) to +1 (extremely positive). A
threshold for ‘positive’ was set to be greater than 0.5, whereas ‘negative’ was set to be less than − 0.5 and anything
in between was neutral. The output of VADER was validated qualitatively by examining the word clouds of the
words in a tweet being classified as negative, neutral, and positive. This was one of the benefits of using VADER
as the contribution of each word to the sentiment of the tweet was known. The large number of ‘neutral’ tweets
was largely due to the choice of thresholds used for the compound score. A narrower threshold for neutral senti-
ment would produce less neutral tweets, and more of either negative or positive. Since the compound score is a
sum of valence scores of each word and normalised to between − 1 and 1, it is possible that positive and negative
words cancel out leading to a compound score closer to 0 thus neutral.
As a comparison to the out-of-box VADER sentiment analyser, a random forest classifier was trained on the
Sentiment140 dataset17, which has found widespread usage in analysing the sentiment in t weets18. As the Senti-
ment140 dataset does not contain any neutral tweets, it was assumed that tweets for which the classifier was
equally unsure about the sentiment were neutral. As such, a softmax output was used to predict the probabilities
of the two classes. The difference between these probabilities was taken, giving a range between – 1 and 1. Any
tweet with a “net sentiment” between – 0.5 and 0.5 was assumed to be neutral, as this implied that the classifier
could not firmly classify the sentiment as either positive or negative.
Any differences in the fractions of tweets of varying sentiment can be attributed to the datasets that informed
the outputs of the respective tools. VADER is rule-based and based on a valence measure, whereas the random
forest classifier was trained on a labelled dataset. As such, each classifier will assign different words with different
value for the sentiment, hence resulting in sentiment spikes at different times. However, in order to better inform
the sentiment analysis, it would be more suitable to train a classifier on a more topically relevant labelled dataset
in order to better capture the features that give tweets about specific topics a certain sentiment. However, this
approach was not taken due to time constraints of the project. As such, the main drawback with both methods is
that it may be inaccurate for domain specific terms. For example, ‘positive case’ would have a positive sentiment
despite having a negative connotation in the context of the pandemic. Similarly, linguistic-subjective phenomena
such as irony and sarcasm may also be misinterpreted.
Scientific Reports | (2021) 11:19009 | https://doi.org/10.1038/s41598-021-98396-9 4
Vol:.(1234567890)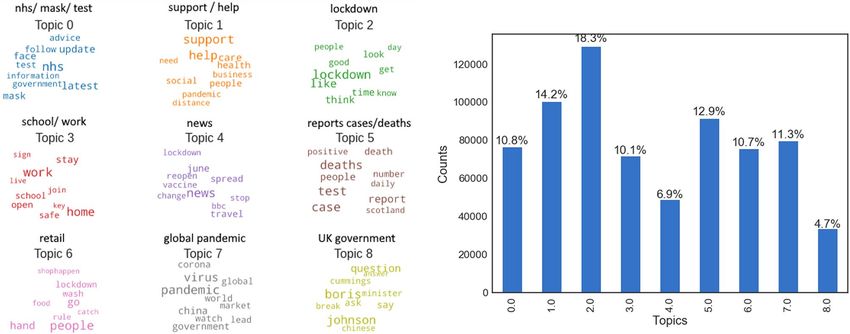
www.nature.com/scientificreports/
Figure 2. Top: Positive UK COVID-19 death numbers per 100,000 plotted as a function of time, reported via
Public Health England UK government data7. Bottom: The total number of tweets containing the keyword
‘coronavirus’, aggregated via the counts endpoint via the Twitter API. Both distributions exhibit three phases,
Phase 1: an initial exponential rise, Phase 2: the peak in the time series and Phase 3: a gradual decay.
Results and discussion
Initial outbreak detection. The use of social media data to look at the prevalence of a disease has been
considered in the past for avian influenza19,20, and has also been considered for coronavirus2,21,22. This phenome-
non of Twitter’s ability to provide insights into pandemic activity has been referred to as “wisdom of the crowds”;
the collective knowledge of individual users2. By making use of this collective knowledge, the objective is to try
and predict pandemic activity in the absence of any virus tracking system. In order to build an early-warning
system, the total volume of tweets obtained via the counts endpoint was utilised within a time-series compari-
son with Public Health England (PHE) datasets on COVID-19 deaths7. Using deaths as a means of tracking the
outbreak was more meaningful than using confirmed COVID-19 cases. The reason for this is the limited testing
capacity in the UK at the onset of the pandemic, which meant that the number of positive tests would only ever
have been an underestimate of the true number. The number of deaths is a more reliable number. The following
sections discuss the time-delays determined by correlating both time-series and an evaluation to what extent
Twitter can be employed as an outbreak predictor.
The number of positive deaths per 100,000 was extracted from the PHE dataset for London, Manchester,
Liverpool, Birmingham and Leicester. Figure 2 depicts the time series of the deaths per 100,000 for these five
cities, as well as the total number of tweets aggregated per day matching the query #covid OR #corona-
virus and covid OR coronavirus. Both distributions evolve with three distinct phases. The first phase
Scientific Reports | (2021) 11:19009 | https://doi.org/10.1038/s41598-021-98396-9 5
Vol.:(0123456789)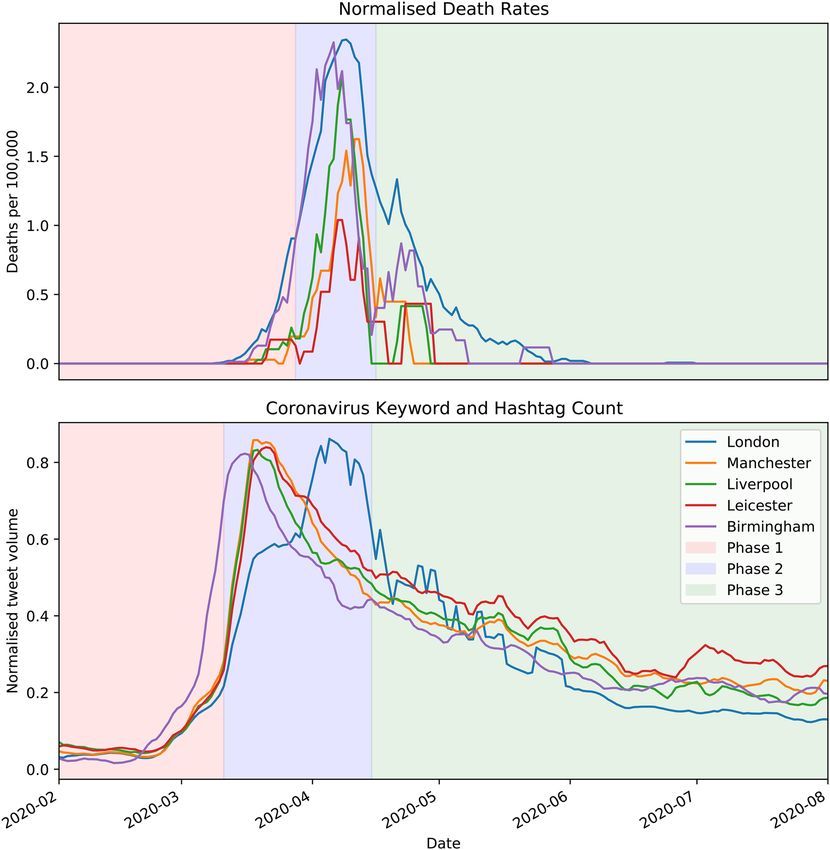
www.nature.com/scientificreports/
Lag (days)
Base twitter API query London Manchester Liverpool Birmingham Leicester
(# Covid OR #coronavirus) and (covid OR coronavirus) 6 22 21 17 17
Cough OR #cough 20 27 23 20 20
Fever OR #fever 11 22 19 15 21
Symptom OR #symptom 8 22 21 17 18
Table 3. Summary of lags determined between Twitter query counts5 time series and PHE death numbers7
between February 1st - August 19th 2020. A positive lag of x days indicates that the Twitter query time series
precedes the PHE deaths by x number of days.
is an initial exponential rise, the second phase depicts reaching a maximum and the third phase is a gradual
decay. Despite a much-publicised second wave in Leicester, there was no second wave in the city’s COVID-19
deaths. A second wave of new infections was found from PHE data, but this could also be attributed to more
widespread community testing.
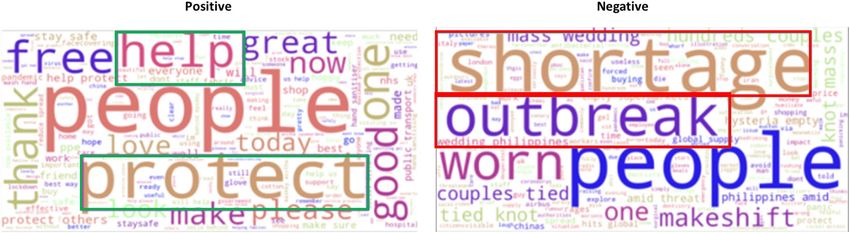
For all cities under consideration, it was observed that the total volume of tweets precedes the case numbers.
This factor could prove to be extremely useful in initial disease tracking stages, as was the case with Ebola in
some regions of N igeria23. For the Coronavirus, many governments struggled to identify cases swiftly due to the
asymptomatic nature of the disease, as well as the fact that its symptoms made it hard to distinguish from other
ailments. For this reason, it makes sense to make a distinction between an “informal outbreak”, when the number
of tweets on the subject increase exponentially, and a “formal outbreak”, which is when the death numbers exhibit
the same feature. A similar approach has been adopted in a previous p ublication22.
The correlation between Twitter query counts specified in Table 1 and PHE death numbers was considered.
In each case, the aim was to determine the lag which maximises the correlation coefficient between the two time
series. The strength of the correlation is determined through comparison with the null hypothesis, such that the
two time series are uncorrelated. This procedure was repeated for the five UK locations.
Table 3 summarises the lag-time determined for each UK location which maximised the correlation coef-
ficients for the time series of the query in question correlated with the PHE death numbers. The correlation was
determined using the Spearman Rho coefficient. For all cities, the correlation coefficients are found to be in
the range 0.7− 0.95, this corresponds to rejecting the null hypothesis at the p < 0.01 level. From these results,
it is clear that the query: (#covid OR #coronavirus) and (covid OR coronavirus) provides
the earliest indication of an outbreak, on average. Figure 3 shows plots of the time series of the counts for the
(#covid OR #coronavirus) and (covid OR coronavirus) query as well as the coronavirus case
numbers. The figure also shows the shifted Twitter counts time series that maximises the correlation coefficient.
This method has shown success in predicting the onset of the first peak in case numbers in the UK cities
considered. The optimal lags for the cities are comparable to the ranges found for the coronavirus using Google
Trends21,24 as well as T witter2. The aforementioned works all considered the spread of the virus across entire
countries, as opposed to localised levels. This gives further validation for a time lag of 6-27 days for an outbreak
to develop. This range of lags matches values found previously for the U S22. All of this suggests that the “wisdom
of the crowds” in predicting a virus outbreak is independent of the geographical size or location of the region.
Finally, it should be noted that this method should by no means be relied on as the only means of outbreak
prediction for either the coronavirus or any other future epidemic. The keywords and hashtags used to track
the evolution of Twitter discussions related to COVID-19 during the period of February 1st - August 19th 2020
may evolve over time and no longer be relevant throughout the course of the pandemic. Further work would be
needed to investigate trends in hashtag/keyword usage over time, particularly in response to new government
measures and pandemic-related news, i.e. a second lockdown and vaccine trials. Additionally, when considering
smaller populations, one important factor to take into account may be geographical nesting with larger hubs in
the region, as it is possible that there will be a significant amount of commuting between these locations. This
would contribute to the spread of the virus as well as provide a greater number of Twitter c ounts2. An example
of geographical nesting would be Leicester and Leicestershire, which have large numbers of people commuting
between them. Considering the case numbers of each in isolation would not provide an accurate picture of the
outbreak. Leicester was also different to the other UK cities considered, as it had a highly-publicised second
wave due to an outbreak in a factory. It was noted in another work that considered symptom-related searches25
that as more clinical manifestations of the coronavirus are noted and published, it is likely that the keywords
and hashtags used in tweets will change. If one were to try to use specific keywords as indicators of localised
outbreaks, one would need to be tracking the top hashtags as a function of time to identify relevant topics being
discussed by users.
Furthermore, it might be difficult to compare lag values for different countries. This is due to the fact that
countries made use of different non-pharmaceutical interventions (NPIs). A combination of the fact that the
nature of the NPI would have differed as well as the timing would mean that lags found for different countries
or regions may not always be directly comparable. It has been found that both of these factors have a significant
effect on the evolution of the pandemic26. However, the UK initially imposed a uniform national lockdown,
which for the time period considered meant that different cities could be meaningfully compared. It should be
noted that comparisons between cities would not prove as meaningful for the UK for the period of time in which
a tiered lockdown system was used.
Scientific Reports | (2021) 11:19009 | https://doi.org/10.1038/s41598-021-98396-9 6
Vol:.(1234567890)www.nature.com/scientificreports/
Figure 3. Plots of the time series of the counts endpoint for ‘coronavirus’ or ‘#coronavirus’ or ‘covid’ or ‘#covid’
for five UK cities as well as death numbers between February and August 2020. Also plotted is the former shifted
by the time lag that maximised the correlation coefficient. The dates of the formal and informal outbreaks are
plotted as red and green vertical lines, respectively.
Public interest, behaviour and sentiment evaluation. The use of social media posts could provide
vital information about popular opinions surrounding heavily discussed topics such as COVID-19 and has the
potential to gauge the adoption of certain policies such as face masks in public. While the time series analysis can
provide an indication of when and where an outbreak might happen, it ultimately only considers gross numbers.
In order to get a better idea of how people are responding to the pandemic and any NPIs, the textual content
of the tweets must be analysed. The following sections describe the use of various natural language processing
techniques to explore the COVID-19 related content on Twitter.
Topic modelling. The LDA topic model was applied onto the entire corpus of tweets with nine initial topics. The
algorithm produced nine sets of words, one for each of the hidden topics. For each topic, the set of words were
interpreted to a theme: ‘nhs’, ‘support/help’, ‘lockdown’, ‘school/work’, ‘news’, ‘reports cases/deaths’, ‘retail’, ‘global
pandemic’ and ‘UK government’. The top ten words for each topic are shown as word clouds in Fig. 4 (left),
Scientific Reports | (2021) 11:19009 | https://doi.org/10.1038/s41598-021-98396-9 7
Vol.:(0123456789)www.nature.com/scientificreports/
Figure 4. Left: topic word clouds derived from Latent Dirichlet Allocation (LDA) model topic estimation.
Right: The number of tweets from each topic, whereby a tweet is assigned the topic with the highest probability.
the larger the word, the more weight it has in defining the topic. The topic model appears to have learned the
underlying topics well based on the qualitative coherence of the word groups. The topics were examined in more
detail for a sample of tweets. For simplicity, the topic with maximum probability was assigned to each tweet. The
most discussed topic in this corpus of tweets was ‘lockdown’ reflecting the enormous public interest at the time
(shown in Fig. 4 (right)). This is an expected result given the timeliness of data collection spanning the first UK
lockdown which started on March 23, 2 02027 with restrictions lasting into July, an extraordinary measure which
many have not experienced before.
However, the results of this analysis should only be viewed as an overview of the main topics in the corpus,
there could in fact be a greater number of underlying topics which were not captured given the pre-chosen num-
ber of topics. Using this unsupervised technique with an unlabelled corpus of tweets without truth information
for topic label, proved challenging to assess the overall purity of the topics. However, this approach offered a
heuristic overview of broad themes discussed within a large corpus such as tweets related to COVID-19.
Identifying locations associated with face coverings. The trained NER model learnt the vector space of match
patterns containing location keywords in the training dataset and achieved a precision of 81.6%, recall of 77.6%
and a combined F1 score of 79.5% on the test dataset (20% of annotated tweets). The advantage of this model is
its ability to identify similar entities within this vector space without the need to hard code all possible examples
of locations or different forms of the same location. This model was used to extract all tweets with location key-
words. Another powerful feature of the NER model was its ability to identify n-grams which match the vector
space it was trained on. The model classified 24% of tweets which mention a location (∼8000 tweets) between
April 1 to August 19, 2020.
Having improved the purity of location-related tweets, the time evolution of the mentioning of locations, as
well as sentiment were evaluated. Using lemmatization, a list of unique locations was obtained, such examples
include ‘shop’, ‘supermarket’, ‘public transport. By considering the cumulative frequency of each location term
as a function of time, a bar chart race animation was produced showing how different location words change in
popularity as time progresses. It was found that the top five locations mentioned were: ‘shop’, ‘public transport’,
‘public’, ‘supermarket’ and ‘bus’. It was also found that a significant portion of tweets (∼ 5%) were from online
businesses (e.g. Redbubble and Etsy) selling masks on Twitter contributing to almost four times more mention
of the word ‘shop’ than the next most popular location ‘public transport’.
The workflow demonstrated here with the NER model to isolate relevant tweets from an unlabelled corpus
is general and effective. For the purpose of this study, locations relating to face masks were of interest. Equally,
this technique could be applied to other content of interest. For example, finding the most common COVID-19
symptoms people report on social media28, or finding tweets which indicate COVID-19 infection and COVID-19
awareness29. Other studies such a s30 also demonstrated methods of discriminating tweets which reported infec-
tion from those that expressed concerned awareness of the flu. In their study, the authors used Amazon Mechani-
cal Turk to label 11,900 tweets as concerned awareness, infection, media and unrelated, to train a classifier which
yielded F1 scores of between 0.72 to 0.80. The NER methodology demonstrated in this study may have many
further benefits, including reducing human resources and the time needed to produce a labelled ground truth.
Mask prevalence. It was found from social media posts that the adoption of face coverings varied across differ-
ent locations. Using Twitter data, the prevalence of the use of face coverings in the UK was assessed in different
locations such as shops, supermarkets and public transport .
The location NER model was applied on the dedicated ‘face covering’ dataset (see Table 2) to extract a subset
of tweets relating to the wearing of face coverings at some location while removing tweets originating from sales
Scientific Reports | (2021) 11:19009 | https://doi.org/10.1038/s41598-021-98396-9 8
Vol:.(1234567890)www.nature.com/scientificreports/
Location Wearing (%) Not wearing (%) Count
Shop 81 19 261
Public 85 15 175
Public transport 74 26 72
Train 74 26 53
Bus 77 23 57
Supermarket 87 13 53
Table 4. Percentage of tweets mentioning ‘wearing’ and ‘not wearing’ at different locations.
Sub-region Wearing (%) Not wearing (%) Count
Greater London 77 23 226
City and Borough of Manchester 98 2 198
Borough of Oldham 100 0 45
Borough of Tameside 100 0 39
Essex 84 16 38
Table 5. Percentage of tweets mentioning ‘wearing’ and ‘not wearing’ at different geographical regions.
advertisements. Tweets were filtered using the verb ‘wearing’ as it was the most frequently used verb in the dataset
and the progressive form of the verb ensured that ‘wear’ was being used as an action, rather than as a noun or
perhaps in another context. Applying this to the ‘face covering’ dataset, it was found that 3% of tweets (∼1000
tweets) satisfied the requirements above. Each tweet was split at punctuation, and at conjunction words such as
‘if ’ or ‘as’ which were used to connect two clauses to form one sentence. This isolated the sub-sentence which
directly refers to the ‘wearing’ of face coverings. Finally, sub-sentences were then classified as a correct reference
of ‘wearing’ face coverings, or a reference of ‘not wearing’, based on the presence of negative adverbs such as ‘not’,
‘barely’ and ‘only’, or negative nouns such as ‘no’ and ‘nobody’. This allowed satisfactory classification of tweets
with an accuracy of 88% based on a test set of 100 examples. It was found that 83% of tweets mentioned people
wearing masks. Table 4 shows a breakdown by location.
A similar analysis was executed to break down by geographical location. ‘Greater London’ and ‘City and
Borough of Manchester’ were found to have more than four times the number of tweets compared to the next
most frequent region likely linked to population size. Looking at the fraction of tweets for ‘wearing’/ ‘not wear-
ing’, London was found to have the lowest percentage of ‘wearing’, but still relatively high at 77% (Table 5). It is
worth noting that only approximately 72% of the tweets had ‘sub-region’ field populated. Due to only ∼1000
tweets satisfying the criteria of having a location mention and the verb ‘wearing’, behavioural change over time
regarding the wearing of face coverings at locations was too sporadic to draw meaningful conclusions. Other
attempts were made to enlarge this dataset such as filtering with the word ‘wear’ only. This relaxed filtering lead
to lots of ‘noise’ in the dataset such as tweets promoting the use of face coverings, which does not reflect whether
people are actually wearing a mask. Further work should consider identifying new rules to enlarge such a dataset
to allow for a time-dependent behavioural analysis to be performed.
In England, the wearing of face coverings in enclosed public spaces became legally mandatory from July 24,
202031, whereas these results show the sentiment and attitude towards face masks before they were introduced
by the UK government. This prior knowledge would provide key insight into the behaviour of the general public
and may help policy makers in future decision making.
Sentiment analysis. Sentiment analysis on pandemic related topics such as ‘test and trace’, ‘vaccine’ and ‘face-
masks’ was performed in order to gauge how the public feels about these rather controversial topics. Further-
more, the time evolution of the mask dataset was considered by what fraction of tweets were positive, negative
or neutral per day. Two separate tools were used to classify the tweets in order to compare their results. Figure 5
shows how the fraction of tweets that had each sentiment changed as a function of time, as predicted by the two
tools used.
For ‘masks’, people expressed positive sentiment overall. It was found that major news or announcements
also corresponded to clear spikes in a particular sentiment. Figure 5 shows four labelled events. ‘A’ corresponds
to a WHO warning about a global mask shortage on February 7th, 2020 which saw a period of high negativity
between February and March. ‘B’ corresponds to an announcement by the Health Secretary about high-quality
masks being distributed to the NHS on March 16th, 2020 which saw a positive sentiment spike, ‘C’ corresponds
to a government announcement that scientific advice would be followed regarding face masks on April 17th,
2020 which saw another positive sentiment spike and ‘D’ corresponds to an announcement that governments
would make face masks mandatory in shops in England on July 14th, 2020 which saw a negative sentiment
spike. To illustrate that the tweets were discussing these particular topics, Fig. 6 shows that the negative tweets
pre-March (in relation to ‘A’) were mostly concerned with the ‘shortage’ of masks amidst the inevitable outbreak
Scientific Reports | (2021) 11:19009 | https://doi.org/10.1038/s41598-021-98396-9 9
Vol.:(0123456789)www.nature.com/scientificreports/
Figure 5. Time series of the three kinds of sentiment for the tweets about masks as predicted by VADER and
a random forest classifier trained on the Sentiment140 dataset. We observe that the general trends are broadly
similar, with roughly 40% of tweets being positive from May 2020 onwards. Four major events are marked
on the time series. A corresponds to a WHO warning about a global mask shortage on February 7th, 2020, B
corresponds to an announcement by the Health Secretary about high-quality masks being distributed to the
NHS on March 16th, 2020, C corresponds to a government announcement that scientific advice would be
followed regarding face masks on April 17th, 2020 and D corresponds to an announcement that governments
would make face masks mandatory in shops in England on July 14th, 2020.
in March32. On the other hand, a significant number of positive tweets expressed how masks can ‘help’, ‘protect’,
and keep people ‘safe’.
For ‘test and trace’, an overall positive sentiment was found. However, there were significantly more nega-
tive tweets in April. These negative tweets were concerned with data protection like breaking GDPR laws33. In
contrast, positive tweets supported the scheme saying that it would help to control the virus.
For ‘vaccine’, the sentiment was overall positive. However, there were significant numbers of negative tweets
with terms like ‘Bill Gates’ and ‘Gates wants’, tying in with the conspiracies surrounding Bill Gates34. In contrast,
the positive tweets were focused around the strong immune response of the Oxford vaccine and offering ‘hope’35.
It was also of interest to see whether there is a geographical north/south difference in sentiment towards
facemasks. However, the analysis showed no significant difference. A major limitation was the small number of
tweets with location information. Furthermore, there were about nine times less tweets from Northern England
than Southern England, limiting the usefulness of the comparison.
Currently, sentiment analysis cannot distinguish between an angry tweet about someone who did not wear a
mask in a shop versus a positive tweet about the need for people to wear masks to prevent the spread of the virus
Scientific Reports | (2021) 11:19009 | https://doi.org/10.1038/s41598-021-98396-9 10
Vol:.(1234567890)www.nature.com/scientificreports/
Figure 6. Word clouds of the corresponding positive (left) and negative (right) mask related tweets from Vader
sentiment analysis. We observe rather distinct types of words in each, particularly more words of gratitude in
the positive word cloud as expected.
or about the policy in general. In both cases, the tweet suggests an individual and opinion which is pro-mask and
pro-Govt policy. Further work should focus on intent analysis to estimate the change in compliance to specific
government policies in relation to events, news, announcements, such as government officials breaking the rule of
‘stay at home’. This type of insight would be very useful for policy makers to see the effectiveness of their policies.
Conclusions and outlook
The use of Twitter as a data medium for crisis management has been shown to provide key insights and behav-
ioural patterns about a demographic. A variety of tools have been developed to analyse Twitter data during the
period surrounding an emerging crisis when mass-testing is not in place. The results of this work can be sum-
marized as follows.
By leveraging “wisdom of the crowds”2 in conjunction with the use of time series analysis, the distribution of
total volume of tweets for a given query provides a good foundation to build a prototype early warning system,
as well as the ability to identify potential hotspots. The selection of hashtags or phrases used within the Twitter
query is crucially important due to the dynamic nature of language. It was found that increased usage of various
coronavirus-related keywords was strongly correlated with a rise in COVID-19 deaths 6–27 days later.
Topic modelling was used to reveal nine distinct topics within the corpus of COVID-19 related tweets, includ-
ing themes ranging from retail to government bodies. By utilising a Named Entity Recognition (NER) algorithm
in a semi-supervised manner within the extracted topics, tweets containing location-based keywords within an
unlabelled corpus were extracted with a precision of 81.6%. This combination of techniques not only allowed
for further analysis of the textual content to be investigated, but also increased the purity of topic selection.
The use of an out-of-the-box sentiment analysis tool (VADER), as well as a random forest classifier trained
on the labelled Sentiment140 dataset17 have worked well on extracting sentiment polarity from tweets with
sentiment spikes corresponding to major news or announcements. This demonstrates the potential for policy
makers to leverage sentiment analysis to evaluate public feeling for a policy.
Further work should consider the reliability of user location, the selection of dynamic hashtag queries , the
ability to generalise the procedure to other countries, as well as extending the procedure to incorporate intent
analysis for policy makers. Despite some limitations, the techniques investigated have the potential to help predict
future global crises and evaluate public response both indirectly and efficiently.
Data availability
The datasets generated and analysed during the current study are available from the corresponding author on
reasonable request.
Received: 10 March 2021; Accepted: 7 September 2021
References
1. Larsen, D. A. & Wigginton, K. R. Tracking covid-19 with wastewater. Nat. Biotech. 38, 1151–1153. https://d oi.o rg/1 0.1 038/s 41587-
020-0690-1 (2020).
2. Turiel, J., Fernandez-Reyes, D. & Aste, T. Wisdom of crowds detects covid-19 severity ahead of officially available data. Sci. Rep.
11, 13678. https://doi.org/10.1038/s41598-021-93042-w (2021).
3. Coronavirus, B. B. C. Face masks and coverings to be compulsory in Englad’s shops. BBC (2020) Retrieved from https://www.bbc.
co.uk/news/uk-politics-53397617.
4. Filtering Tweets by Location. Accessed (2020-09-30.) https://developer.twitter.com/en/docs/tutorials/filtering-tweets-by-location.
5. Premium search APIs - Counts endpoint. Accessed (2020-09-30.) https://developer.twitter.com/en/docs/twitter-api/premium/
search-api/api-reference/premium-search#CountsEndpoint.
6. Get Day Trends - Twitter Trends Worldwide. Accessed (2020-09-30.) https://getdaytrends.com/..
7. Download Data - Public Health England UK Government. Accessed (2020-09-30.) https://coronavirus.data.gov.uk.
8. Premium search APIs - Data endpoint. Accessed (2020-09-30.) https://d evelo
per.t witte r.c om/e n/d
ocs/t witte r-a pi/p
remiu m/s earch-
api/api-reference/premium-search#DataEndpoint.
9. Blei, D. M., Ng, A. Y. & Jordan, M. I. Latent Dirichlet allocation. J. Mach. Learn. Res. 3, 993–1022 (2003).
Scientific Reports | (2021) 11:19009 | https://doi.org/10.1038/s41598-021-98396-9 11
Vol.:(0123456789)www.nature.com/scientificreports/
10. Carron-Arthur, B., Reynolds, J., Bennett, K., Bennett, A. & Griffiths, K. M. What’s all the talk about? topic modelling in a mental
health internet support group. BMC Psychiat. 16, 367 (2016).
11. Řehůřek, R. & Sojka, P. In Software Framework for Topic Modelling with Large Corpora. In Proceedings of the LREC 2010 Workshop
on New Challenges for NLP Frameworks, 45–50 (ELRA, Valletta, Malta, 2010). http://is.muni.cz/publication/884893/en.
12. Honnibal, M. & Montani, I. spaCy 2: Natural language understanding with Bloom embeddings, convolutional neural networks
and incremental parsing (2017).
13. Explosion. sense2vec: Contextually-keyed word vectors. https://github.com/explosion/sense2vec (2020).
14. Montani, I. & Honnibal, M (A new annotation tool for radically efficient machine teaching. Artificial Intelligence, Prodigy, 2018).
15. Drus, Z. & Khalid, H. Sentiment analysis in social media and its application: Systematic literature review. Procedia Comput. Sci.
161, 707–714. https://doi.org/10.1016/j.procs.2019.11.174 (2019).
16. Gilbert, C. & Hutto, E. Vader: A parsimonious rule-based model for sentiment analysis of social media text. In Eighth International
Conference on Weblogs and Social Media (ICWSM-14). Available at (20/04/16) http://comp.social.gatech.edu/papers/icwsm14.
vader.hutto.pdf, vol. 81, 82 (2014).
17. Go, A., Bhayani, R. & Huang, L. Twitter sentiment classification using distant supervision (Stanford University, Tech. Rep., 2011).
18. Kruspe, A., Hberle, M., Kuhn, I. & Zhu, X. X. Cross-language sentiment analysis of european twitter messages duringthe covid-19
pandemic (2020). 2008.12172.
19. Santos, J. C. & Matos, S. Analysing twitter and web queries for flu trend prediction. Theoret. Biol. Med. Model. 11, S6–S6 (2014).
20. Yousefinaghani, S., Dara, R., Poljak, Z., Bernardo, T. M. & Sharif, S. The assessment of twitter’s potential for outbreak detection:
Avian influenza case study. Sci. Rep. 9, 18147–18217 (2019).
21. Effenberger, M. et al. Association of the covid-19 pandemic with internet search volumes: A google trendstm analysis. Int. J. Infect.
Dis. 95, 192–197 (2020).
22. Gharavi, E., Nazemi, N. & Dadgostari, F. Early Outbreak Detection for Proactive Crisis Management Using Twitter Data: COVID-
19 a Case Study in the US. arXiv e-prints. arXiv:2005.00475 (2020). 2005.00475.
23. Odlum, M. & Yoon, S. What can we learn about the ebola outbreak from tweets?. Am. J. Infect. Control 43, 563–571 (2015).
24. Lampos, V. et al. Tracking covid-19 using online search (2020). 2003.08086.
25. Asseo, K., Fierro, F., Slavutsky, Y., Frasnelli, J. & Niv, M. Y. Tracking covid-19 using taste and smell loss google searches is not a
reliable strategy. Sci. Rep. 10, 20527. https://doi.org/10.1038/s41598-020-77316-3 (2020).
26. Lai, S. et al. Effect of non-pharmaceutical interventions to contain covid-19 in China. Nature 585, 410–413. https://doi.org/10.
1038/s41586-020-2293-x (2020).
27. Prime Minister’s Office, . D. S. Prime minister’s statement on coronavirus (covid-19): 23 march 2020 (2020). https://www.gov.uk/
government/speeches/pm-address-to-the-nation-on-coronavirus-23-march-2020.
28. Sarker, A. et al. Self-reported COVID-19 symptoms on Twitter: An analysis and a research resource. J. Am. Med. Inform. Assoc.
27, 1310–1315. https://doi.org/10.1093/jamia/ocaa116 (2020).
29. Smith, M., Broniatowski, D. A., Paul, M. J. & Dredze, M. Towards real-time measurement of public epidemic awareness: Monitor-
ing influenza awareness through twitter. In AAAI spring symposium on observational studies through social media and other
human-generated content (2016).
30. Lamb, A., Paul, M. & Dredze, M. Separating fact from fear: Tracking flu infections on twitter.In Proceedings of the 2013 Confer-
ence of the North American Chapter of the Association for Computational Linguistics: Human Language Technologies, 789–795
(2013).
31. GOV.UK. Face coverings mandatory in shops, supermarkets, shopping centres and enclosed transport hubs from friday (2020).
https://www.gov.uk/government/news/face-coverings-mandatory-in-shops-supermarkets-shopping-centres-and-enclosed-trans
port-hubs-from-friday.
32. Boseley, S. Who warns of global shortage of face masks and protective suits. The Guardian (2020) Retrieved from https://www.
theguardian.com/world/2020/feb/07/who-warns-global-shortage-face-masks-protective-suits-coronavirus.
33. Hern, A. Mps criticise privacy watchdog over nhs test-and-trace data. The Guardian (2020) Retrieved from https://www.thegu
ardian.com/uk-news/2020/aug/21/mps-criticise-privacy-watchdog-information-commissioner-nhs-test-and-trace-data.
34. Goodman, J. & Carmichael, F. Coronavirus. Bill gates ‘microchip’ conspiracy theory and other vaccine claims fact-checked. BBC
(2020) Retrieved from https://www.bbc.co.uk/news/52847648.
35. Oxford. New study reveals oxford coronavirus vaccine produces strong immune response (University of Oxford, 2020) Retrieved from
https://www.ox.ac.uk/news/2020-07-20-new-study-reveals-oxford-coronavirus-vaccine-produces-strong-immune-response.
Acknowledgements
I.K.C., J.H and N.L. were supported by the STFC UCL Centre for Doctoral Training in Data Intensive Science
(Grant Number ST/P006736/1) and acknowledge the STFC’s Impact Acceleration Accounts for the financial
support in obtaining the Twitter Premium API.
Author contributions
I.K.C., J.H. and N.L. wrote the code, analysed the results and wrote the main manuscript. G.F. and Z.G. analysed
the results and directed the various experiments. All authors reviewed the manuscript.
Competing interests
The authors declare no competing interests.
Additional information
Correspondence and requests for materials should be addressed to J.H.
Reprints and permissions information is available at www.nature.com/reprints.
Publisher’s note Springer Nature remains neutral with regard to jurisdictional claims in published maps and
institutional affiliations.
Scientific Reports | (2021) 11:19009 | https://doi.org/10.1038/s41598-021-98396-9 12
Vol:.(1234567890)www.nature.com/scientificreports/
Open Access This article is licensed under a Creative Commons Attribution 4.0 International
License, which permits use, sharing, adaptation, distribution and reproduction in any medium or
format, as long as you give appropriate credit to the original author(s) and the source, provide a link to the
Creative Commons licence, and indicate if changes were made. The images or other third party material in this
article are included in the article’s Creative Commons licence, unless indicated otherwise in a credit line to the
material. If material is not included in the article’s Creative Commons licence and your intended use is not
permitted by statutory regulation or exceeds the permitted use, you will need to obtain permission directly from
the copyright holder. To view a copy of this licence, visit http://creativecommons.org/licenses/by/4.0/.
© The Author(s) 2021
Scientific Reports | (2021) 11:19009 | https://doi.org/10.1038/s41598-021-98396-9 13
Vol.:(0123456789)You can also read