EVALUATION OF THE NATIVE HAWAIIAN EDUCATION PROGRAM: Native Hawaiian ...
←
→
Page content transcription
If your browser does not render page correctly, please read the page content below
NATIVE HAWAIIAN EDUCATION COUNCIL
EVALUATION OF THE
NATIVE HAWAIIAN EDUCATION PROGRAM:
Portfolio Analysis of the 2010-2018 Grants

March 18, 2021

Photo: PLACES, UH Mānoa (with permission)

Prepared by:
IMPAQ International, Inc.
Linda Toms Barker, Principal Investigator
Raquel Sanchez, Project Manager
Colleen McLelland, Research Analyst

This report was developed under a grant from the U.S. Department of Education, Office
of Elementary and Secondary Education, Native Hawaiian Education Program. The
contents of the report do not necessarily represent the positions or policies of the U.S.
Department of Education. Neither the U.S. Department of Education nor any of its
components are responsible for or officially endorse the contents of this report.

Citation: Native Hawaiian Education Council. (2018). Native Hawaiian Education Program
Grant Funding Patterns. Honolulu, HI: Native Hawaiian Education Council.
EVALUATION OF THE NATIVE HAWAIIAN EDUCATION PROGRAM:
                    PORTFOLIO ANALYSIS OF THE 2010-2018 GRANTS

Table of Contents ............................................................................................................................... i
Table of Exhibits ................................................................................................................................ii
1.    Introduction ...............................................................................................................................1
      Overview of the Study .......................................................................................................................... 1
      Limitations in the Data.......................................................................................................................... 2
2.    Program Description ...................................................................................................................5
      Number of Grants in Each Cohort......................................................................................................... 5
      Types of Grantee Organizations ........................................................................................................... 6
      Education Sectors Addressed ............................................................................................................... 7
      Geographic Target Areas .................................................................................................................... 11
      Target Populations .............................................................................................................................. 12
      Project Objectives ............................................................................................................................... 13
      Partners............................................................................................................................................... 15
3.    Analysis of Funding Patterns .....................................................................................................17
      Introduction ........................................................................................................................................ 17
      Funding by Award Year Cohort ........................................................................................................... 18
      Funding by Education Sector .............................................................................................................. 19
      Curriculum Development.................................................................................................................... 20
      Funding by Grade Level ...................................................................................................................... 21
      Funding by Grantee Organization Type .............................................................................................. 21
      Funding by Geographic Target Area ................................................................................................... 22
      Carryover Funding .............................................................................................................................. 24
4.    Program Outcomes ...................................................................................................................25
      Introduction ........................................................................................................................................ 25
      Populations Served ............................................................................................................................. 25
      Achievement of Project Objectives .................................................................................................... 28
      Examples of Other Outcomes Grantees Have Achieved .................................................................... 30
      Examples of Challenges Grantees Have Been Experiencing ............................................................... 30
      What Are Some Examples of Promising Practices? ............................................................................ 31
5.    Summary of Grantee Evaluation Practices .................................................................................32
      Introduction ........................................................................................................................................ 32
      Types of Evaluators Used .................................................................................................................... 33
      Evaluation Reporting .......................................................................................................................... 34
      Evaluation Designs .............................................................................................................................. 34
      Evaluation Budgets ............................................................................................................................. 37
6.    Summary and Recommendations ..............................................................................................41
      Summary of Key Findings.................................................................................................................... 41
      Recommendations .............................................................................................................................. 43
APPENDIX A: Native Hawaiian Education Program Grant Database Codebook ................................. A-1

IMPAQ International, LLC                                                   Page i                            NHEP Portfolio Analysis Final Report
                                                                                                                                       3-18-2021
TABLE OF EXHIBITS
Exhibit 2.1. How Many Grants Were Awarded Each Year? .......................................................................... 5
Exhibit 2.2. What Proportion of Grants Were Awarded Each Year? ............................................................ 5
Exhibit 2.3. To What Extent Are Descriptive Data Items Available? ............................................................. 6
Exhibit 2.4. What Types of Organizations Received NHEP Funds? ............................................................... 7
Exhibit 2.5. Which Education Sectors Have Grantees Been Serving? ........................................................... 7
Exhibit 2.6. How Have Education Sectors Varied Across Award Years? ....................................................... 8
Exhibit 2.7. Which Grade Levels Have Grantees Been Targeting with Their Curriculum?............................ 9
Exhibit 2.8. How Has Curriculum Development for Different Grade Levels Varied Across Award Years? .... 10
Exhibit 2.9. Which Islands Have Grantees Been Serving? ........................................................................... 11
Exhibit 2.10. What Proportion of the Total Population Does Each County Represent? ............................. 11
Exhibit 2.11. Which Types of Participants Have Grantees Been Serving? .................................................. 12
Exhibit 2.12. How Many Students, Parents, and Teachers Did RECENT Grantees Plan to Serve? ............. 12
Exhibit 2.13. What Target Populations Did RECENT Grantees Plan to Serve?............................................ 13
Exhibit 2.14. How Many RECENT Grants Specified Objectives for Different Types of Participants? .......... 13
Exhibit 2.15. What Kinds of Objectives Have RECENT Grantees Had for Their Students? ......................... 14
Exhibit 2.16. What Kinds of Objectives Have RECENT Grantees Had for Their Parents? ........................... 14
Exhibit 2.17: What Kinds of Objectives Have RECENT Grantees Had for Their Teachers? ......................... 14
Exhibit 2.18. What Types of Organizations have been RECENT Grantees’ Partners? ................................ 15
Exhibit 2.19. How Many Partners Have RECENT Grantees Reported? ....................................................... 16
Exhibit 3.1. To What Extent Are Funding Pattern Data Items Available? ................................................... 17
Exhibit 3.2. Summary of Grant Funding Included in Analysis ..................................................................... 18
Exhibit 3.3. How Much Total Funding Was Awarded Each Year? ............................................................... 19
Exhibit 3.4. What was the Average Grant Amount Awarded Each Year? ................................................... 19
Exhibit 3.5. How Were Grant Funds Distributed Across Education Sectors? ............................................. 20
Exhibit 3.6 How Has the Distribution of Funding by Education Sector Varied Across Award Years? ......... 20
Exhibit 3.7. How Has Funding by Level of Curriculum Varied Across Award Years? .................................. 21
Exhibit 3.8. How Has Funding Been Distributed Across Grade Levels? ...................................................... 21
Exhibit 3.9. How Much Funding Has Been Awarded to Different Types of Grantee Organizations? ......... 22
Exhibit 3.10. How Has Funding by Type of Organizations Varied Across Award Years? ............................ 22
Exhibit 3.11. How Has Funding Been Distributed Geographically? ............................................................ 23
Exhibit 3.12. How Has Funding by Island Varied Across Award Years? ...................................................... 23
Exhibit 3.13. What Proportion of RECENT Grants Had Funding Carryovers? ............................................. 24
Exhibit 3.14. How Much Funding Did RECENT Grantees Carry Over? ........................................................ 24
Exhibit 4.1: How Many Participants Have Grantees Served So Far? .......................................................... 25
Exhibit 4.2. How Many Participants Have Each of the Two Recent Cohorts Served So Far? ..................... 26
Exhibit 4.3. How Do RECENT Actual Numbers Served Compare with Grantees’ Targets? ......................... 26
Exhibit 4.4. How Many Participants Have Grantees Been Serving Annually? ............................................ 27
IMPAQ International, LLC Page ii NHEP Portfolio Analysis Final Report
3-18-2021Exhibit 4.5. How Many Students Have Grantees Been Serving on Different Islands?................................ 27
Exhibit 4.6. How Many Parents Have Grantees Been Serving on Different Islands? .................................. 27
Exhibit 4.7. How Many Teachers Have Grantees Been Serving on Different Islands? ............................... 28
Exhibit 4.8. How Many Objectives Have Been Met so Far for Each Type of Participant? .......................... 28
Exhibit 4.9. How Many Student Objectives Have Been Met so Far? .......................................................... 29
Exhibit 4.10. How Many Parent Objectives Have Been Met so Far? .......................................................... 29
Exhibit 4.11. How Many Teacher Objectives Have Been Met So Far? ........................................................ 30
Exhibit 5.1 What Types of Evaluation Information Did Grantees Provide? ................................................ 32
Exhibit 5.2. What Types of Evaluators Have Grantees Been Using? ........................................................... 33
Exhibit 5.3. How Did the Overall Grant Budgets Vary by Type of Evaluator? ............................................. 33
Exhibit 5.4.How Did Evaluation Reporting Vary by Type of Evaluator? ...................................................... 34
Exhibit 5.5. Did Evaluation Reporting Vary by Type of Organization? ........................................................ 34
Exhibit 5.6. What Types of Evaluation Designs Did Grantees Use? ............................................................ 35
Exhibit 5.7. What Information on Data Sources Did Grantees Provide? .................................................... 36
Exhibit 5.8 Which GPRA Indicators Did Grantees Address?........................................................................ 37
Exhibit 5.9. How Did Specifying Evaluation Budgets Vary by Type of Organization? ....................................... 38
Exhibit 5.10. How Did the Proportion of Funds Spent on Evaluation Vary by Type of Organization? ....... 38
Exhibit 5.11. How Did the Proportion of Funds Budgeted for Evaluation Vary by Type of Evaluator? ...... 39
Exhibit 5.12. What Proportion of Total Evaluation Funds Were Allocated to Different Types of Evaluators? .. 39
Exhibit 5.13. How Much Did RECENT Evaluation Budgets Vary by Type of Evaluator? .............................. 40
Exhibit 5.14. How Has Evaluation Spending Differed Across RECENT Cohorts? ......................................... 40
IMPAQ International, LLC Page iii NHEP Portfolio Analysis Final Report
3-18-20211. INTRODUCTION
In 1994, the Native Hawaiian Education Council (NHEC, or “the Council”) was established under the Native
Hawaiian Education Act, which had been passed to support “coordination of educational and related
services and programs available to Native Hawaiians.” 1 The Act funds the Native Hawaiian Education
Program (NHEP) to develop innovative education programs to assist Native Hawaiians and to supplement
and expand educational programs that serve this population. The Council is charged with coordinating,
assessing, and making recommendations to the U.S. Department of Education (USDOEd) regarding the
effectiveness of existing education programs for Native Hawaiians, the state of present Native Hawaiian
education efforts, improvements that may be made to existing programs, policies, and procedures to
increase the educational attainment of Native Hawaiians, and recommended NHEP funding priorities.
USDOEd awards NHEP grant funds annually to a variety of agencies including pre-K and K-12 schools,
colleges/universities, non-profit organizations, and family and community-based programs.
This report summarizes a study of the grants funded through the NHEP from 2010 through 2018. Based on
data extracted from grantee documents, this report provides a description of the target populations,
funded activities and a first look at project outcomes. Chapter 1 describes the current study, Chapter 2
provides a brief overview of the Native Hawaiian Education Program grants , Chapter 3 provides an
analysis of funding patterns, Chapter 4 describes populations served and achievement of project
objectives, Chapter 5 summarizes grantee evaluation practices and Chapter 6 provides a brief summary of
key findings along with some recommendations for improving program reporting and evaluation efforts in
the future.
Overview of the Study
In 2017, NHEC selected IMPAQ International, LLC (IMPAQ), a national policy analysis and evaluation
research firm, to build a grants database and conduct analyses of funding priorities in three areas,
including:
1. Analysis of NHEP funding patterns
2. Reconciliation of annual NHEP appropriations and grant funding
3. Summary of grantee evaluation practices
Our previous report, Native Hawaiian Education Program Grant Funding Patterns was completed in
2018 and presents the analyses for these three areas. Since that time, the Council has been planning for
building on this work. In 2020 the Council contracted with IMPAQ to add data about the 2017 and 2018
funding cohorts to the database and expand the analysis to include some additional data items and
degrees of specificity. Although this project was initially called “Evaluation of the Native Hawaiian
Education Program”, this project constitutes just the first step in the evaluation process. Unlike a
traditional evaluation, which spells out specific evaluation questions to be addressed and then collects
and analyzes data to address those questions, this project focused on a “portfolio analysis”, in which we
have reviewed grantee documents to identify and extract the kinds of information that could be readily
aggregated across grantees. This report presents this new analysis along with recommendations for
continuing improvements to grantee reporting, and suggestions for next steps in building a more robust
evaluation of the program as a whole.
1 Native Hawaiian Education Act, Section 7204, https://www2.ed.gov/policy/elsec/leg/esea02/pg104.html
IMPAQ International, LLC Page 1 NHEP Portfolio Analysis Final Report
3-18-2021The IMPAQ team added data about the 2017 and 2018 cohorts to the database constructed for the
previous project, which now includes data coded for 117 grants funded through NHEP that were awarded
during federal award years (AY) 2010 through 2018.2 The database was compiled from documents obtained
from the Council and from documents supplied by the NHEP grantees themselves. In all we reviewed over
500 documents for the two recent funding cohorts. The data items included in the database include
descriptive information about the grant programs, funding patterns, project outcomes, and descriptive
information about grantees’ program evaluation efforts (see the database Codebook in Appendix A).
For most grants, the documents available for review included the initial grant application, grant award
notifications (GANs), annual performance reports (APRs), budget vs. actual reports, evaluation reports,
various attachments, and interim reports. For some grantees, only the grant application, a single APR, or
another combination of documents was available. For some grantees, the APRs were missing information,
including expenditure information.
Data completeness was improved for the 2017 and 2018 grantees by changes in data reporting
requirements under the Native Hawaiian Education Reauthorization Act of 2015. 3 The law provided the
Council with authority to obtain information and data from grantees about their effectiveness in
meeting their goals and the Council’s educational priorities. The Notice Inviting Applications in Federal
Register specifies that grantees are now required to provide copies of performance reports to NHEC. 4
These changes mean we have much more complete data for the recent grantees. The NHEC and IMPAQ
teams followed up with grantees to complete as much missing information as possible5.
The charts included in this report present summary data across all grants as well as by funding cohort.
Grant award years (AY) with only a single grant awarded are combined with the next year. For each
award year we provide the aggregated total funding included in this analysis. It is important to note that
for the AY2018, the Year 3 funding data was obtained from the federal grant award notice (GAN) and
could not be confirmed with budget actuals, which had not yet been submitted to USDOEd.
Taking into account IMPAQ’s prior recommendations for improving the usefulness of the database, we
made several enhancements to the database for the 2017 and 2018 cohorts. The current contract did not
include going back and re-coding data for the 2010-2016 awardees. Where data items are consistent
between the two sets of grants, we have simply added 2017 and 2018 to the charts included in the
previous report. For new data items, only award years 2017 and 2018 are included in the charts.
Limitations in the Data
One of the challenges in documenting the objectives, activities and outcomes of the NHEP -funded
grants is the considerable variation across projects. This variation is actually an important feature of the
program and is critical to meeting the unique needs of the Native Hawaiian community. Though
aggregating across varied projects is challenging, this is not a weakness or shortcoming on the part of
the grantees. However, there is considerable variation in the availability of data for the analyses
contained in this report that we describe here as limitations in the data such as:
2 The federal award year (AY) is October 1 through September 30.
3 Native Hawaiian Education Reauthorization Act of 2015, February 11, 2015 https://www.congress.gov/bill/114th-
congress/senate-bill/464/text
4 Applications for New Awards; Native Hawaiian Education Program, Federal Register /Vol. 82, No. 99 /Wednesday, May 24,
2017 /Notices, page 23785
5 Initially, NHEC and IMPAQ had hoped to obtain grantee documents from USDOEd since the grantees submit their reports to
USDOEd each year. Ultimately, it turned out that NHEC needed to contact individual grantees and ask them to submit their
documents to the Council, which then shared them with IMPAQ.
IMPAQ International, LLC Page 2 NHEP Portfolio Analysis Final Report
3-18-2021 The availability of documents related to the grantees was sometimes limited. For some
grantees, the only documentation that was available was the grant application, for others, it was
information found on the Web. For some 2010-2016 grantees, we could not find any grant
documentation.
The formats of the available documents were inconsistent, and often difficult to align with the
data collection format.
Data on the variables of interest was sometimes missing or incomplete. In addition, data may
have been entered or described in a way that was inconsistent with other data provided, or
even, clearly incorrect. If, after in-depth review of the available information, we were unable to
ascertain the correct data, this resulted in missing data.
We also encountered missing and incomplete information in some of the grantees’ evaluation
reports. Evaluation reports were inconsistent with regard to how much information was
provided – or whether information was provided at all – on such variables as the type of
research methodology used, or what data collection instruments were employed. In some cases,
there were no evaluation reports at all.
The data are particularly limited when it comes to analyzing grantees with multiple grant sites and
determining how to allocate their funding across the different sites when the programs cover different
geographic areas of the state. While some programs may have multiple sites on a single island, others
target more than one island, specific regions or areas on multiple islands, all of one island and parts of
another, etc. We coded geographic data at the island level. We then estimated percentage of resources
by island based on number of students, teachers and/or families served in each different location.
Finally, there were limitations to the data that raise questions about the accuracy of several other types
of information:
The grantees’ reporting of goals and objectives. Stated goals and objectives were not always
reported consistently. Sometimes grantees reported overall goals and then broke out objectives
within each goal. Sometimes they listed objectives rather than goals. And sometimes they mixed
the two within a single report. In addition, there was sometimes inconsistency between how the
grantees reported their goals and objectives in their APRs and how they were reported in their
evaluation reports.
The number of participants served or targeted. The target number of students, teachers and
parents to be served and the number that were actually served were inconsistently reported.
Typically, grantees reported the total number of participants served each year, which results in
duplicated data for those who participated multiple years. In a few cases, grantees reported the
total number of students served over three years, and occasionally, a grantee’s local evaluator
compared targeted with the actual number served. However, in some cases, we were only able
to find the number of students projected to be served in the grant application, and in others,
only the number served in the year(s) for which we have an APR. Also, in some projects with
multiple programs and/or activities, the number served was reported for each individual
program or activity; often, the same students participated in multiple programs or activities,
meaning that we do not have an unduplicated number of students served.
Grade levels of the students involved in the project. Grantees sometimes did not break out
outcomes or activities by grade, so it was difficult to estimate funding by grade level.
IMPAQ International, LLC Page 3 NHEP Portfolio Analysis Final Report
3-18-2021 Grade levels for the teachers involved in the project. Similarly, grantees sometimes did not
break out the teachers’ outcomes or activities by grade, so it was difficult to estimate funding by
grade level of the teachers involved.
Partners. Some grantees seemed to list every organization they had any contact with, including
field trip sites. Others included only partners with key roles in delivering services. Since grantees
were not required to report on their partners, some grantees did not mention them at all.
Key evaluation findings. As noted, there is a large degree of variation in the goals and priorities
of the different grants. This variation is critical to meeting the unique needs of the community
and is the reason we developed coding categories for project objectives to accommodate this
important aspect of the program. Of course, this leads to variation in objectives and coupled
with limited guidance on which program outcomes and activities should be reported, there is
little consistency in how the grantees reported their evaluation findings. (See Chapter 5 for
more information on grantees’ evaluation efforts.)
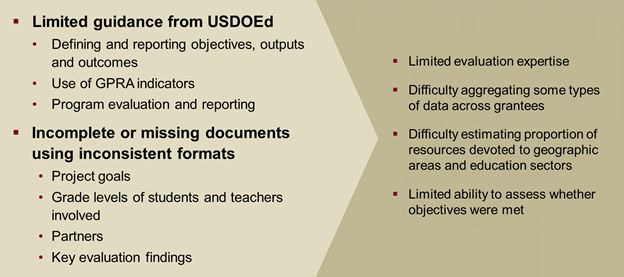
The combination of limited guidance from USDOE grantees on expectations for program evaluation and
incomplete or missing data seemed to result in several important limitations to this study:
We found that many grantees seemed to have limited expertise in program evaluation.
It was difficult or impossible to aggregate some types of data across grantees.
The proportion of resources devoted to geographic areas and education sectors could only be
estimated, rather than measured accurately.
In many cases we had limited ability to assess whether specific objectives were met.
For data items included in the original database, we have added AY2017 and AY2018 to the analyses and
charts prepared for the previous report. Data items available for only the AY2017 and AY2018 cohorts
are reported in separate exhibits throughout this report.
IMPAQ International, LLC Page 4 NHEP Portfolio Analysis Final Report
3-18-20212. PROGRAM DESCRIPTION
In this chapter we provide a description of some basic characteristics of the grantees and grants that
make up the Native Hawaiian Education Program (NHEP). Below we summarize the number of grants
awarded in each cohort, the types of organizations funded, the education sectors they address, the
geographic target areas of the grants, the target populations, and numbers and types of partners
engaged in conducting the grant activities.
Number of Grants in Each Cohort
Exhibits 2.1 and 2.2 display the number and distribution of grants by funding cohort. We provide the same
basic information in the table and the chart, for those who find one or the other format easier to read.
Exhibit 2.1. How Many Grants Were Awarded Each Year?
Number of Grants in Cohort
Award Year (AY) Cohort (N=117)
AY2010 8
AY2011 23
AY2012 17
AY2013-14 19
AY2015-16 12
AY2017 25
AY2018 13
TOTAL 117
Exhibit 2.2. What Proportion of Grants Were Awarded Each Year?
Percentage of Grants by Award Year (N=117)
11% 7%
20%
21%
15%
10%
16%
AY2010 AY2011 AY2012 AY2013-14 AY2015-16 AY2017 AY2018
(n=8) (n=23) (n=17) (n=19) (n=12) (n=25) (n=13)
As Exhibit 2.2 shows, AY2017 accounted for 21% of the NHEP grant funding allocations over the past 9
years, followed by AY2011 with 20% of the funding allocations. The remaining award years each
accounted for between 7% and 16% of the NHEP funding allocations.
IMPAQ International, LLC Page 5 NHEP Portfolio Analysis Final Report
3-18-2021Before presenting descriptive information, we summarize the number of grants for which these
descriptive data items are available, since data items are missing for some of the grants. Because the
data are more complete for the two most recent award years (2017 and 2018), in Exhibit 2.3 we display
data availability separately for the 2010-2016 award years and the 2017-2018 award years. As shown in
the exhibit, descriptive data items are available for almost all of the 2017 and 2018 funding cohorts. The
number describing the level of curriculum addressed is relatively small because fewer than a half of the
recent grants have involved curriculum development. Data on numbers and types of partners were
provided for 30 of the 38 recent grants, even though grantees were not required to report on partners.
Exhibit 2.3. To What Extent Are Descriptive Data Items Available?
Percentage of Grants For Which Data Items Are Available (N=117)
(73) 92%
Organization Type
(38) 100%
(59) 75%
Education Sector
(38) 100%
(48) 61%
Target Populations
(38) 100%
(57) 72%
Type of Participants
(38) 100%
Objectives
(38) 100%
(66) 84%
Geographic Target
(37) 97%
Partners
(30) 79%
(44) 56%
Curriculum
(17) 45%
0% 10% 20% 30% 40% 50% 60% 70% 80% 90% 100%
%AY2010-AY2016 (n=79) % AY2017-AY2018 (n=38)
Types of Grantee Organizations
Exhibit 2.4 shows the distribution of grants by organization type. Almost half (45%) of the grants were
awarded to Native Hawaiian community-based organizations and almost one fourth (24%) to the
University of Hawai‘i at Mānoa. The remaining grants were awarded to community colleges or other
universities (4%), charter schools (6%), other community-based organizations (7%) and other types of
organizations (9%). Some examples of “other CBOs” include the Boys and Girls Club, Merimed Foundation
for Island Health Care Training, and Maui Family Support Services. Examples of “Other” include museums,
Hawai‘i Department of Education, and Waianae District Comprehensive Health and Hospital Board.
IMPAQ International, LLC Page 6 NHEP Portfolio Analysis Final Report
3-18-2021Exhibit 2.4. What Types of Organizations Received NHEP Funds?
AY2010-AY2018 Distribution of Grants by Organization Type (N=117)
9%
6%
4%
45%
24%
7%
NH CBO (n=53) Other CBO (n=8)
UH Mānoa (n=28) Comm.College/Other Univ. (n=5)
Charter School (n=7) Other (n=10)
Education Sectors Addressed
Exhibit 2.5 shows the distribution of grants by education sector. As the chart shows, the largest
proportion of grants were awarded for teacher professional development/support and curriculum
development. Among direct services to students, elementary and middle school students have been the
grade levels most frequently targeted by grants.
Exhibit 2.5. Which Education Sectors Have Grantees Been Serving?
Distribution of Grants by Education Sector AY2010-AY2018 (N=97)*
67% 63%
56%
47% 48% 44%
21%
Pre-K Elementary Middle High Post-Secondary Teacher PD/ Curriculum
(n=46) (n=54) (n=47) (n=43) (n=20) Support (n=61)
(n=65)
*Percentages add up to more than 100% because the number of grants for which data was available for each
cohort address more than one education sector.
Exhibit 2.6 breaks down the number of grants by education sector within each grant award year. As the
exhibit shows, there was variability across funding years with regard to the number of grants awarded to
each sector. It is interesting to note, for example, that in the 2018 cohort, only three grants have
targeted Pre-K, and only three have targeted curriculum development, while nine have targeted high
school students.
IMPAQ International, LLC Page 7 NHEP Portfolio Analysis Final Report
3-18-2021Exhibit 2.6. How Have Education Sectors Varied Across Award Years?
Number of Grants by Education Sector by Cohort (N=97)*
16
14 14
13 13
11 11
10 10
9 9 9 9
8 8 8 8 8 8
7 7 7
6 6 6 6
5 5 5 5 5 5
4 4 4 4
3 3 3
2 2 2 2
1 1 1 1
AY2010 (n=4) AY2011 (n=16) AY2012 (n=14) AY 2013-14 (n=13) AY2015-16 (n=12) AY2017 (n=25) AY2018 (n=13)
Pre-K Elementary Middle High Post-Secondary Teacher PD/ Support Curriculum
*Numbers add up to more than the number of grants for which data was available for each cohort, because many grants address more than one education
sector.
IMPAQ International, LLC Page 8 NHEP Portfolio Analysis Final Report
3-18-2021Grade Levels Addressed in Curriculum Development
Exhibit 2.7 provides a closer look at the grants involving curriculum development. The exhibit shows a
relatively balanced distribution across grade levels among the 97 grants developing curriculum, ranging
from 48% of grants targeting elementary curriculum to 40% targeting Pre-K. In addition, 18% of grants
have targeted post-secondary education.
Exhibit 2.7. Which Grade Levels Have Grantees Been Targeting with Their Curriculum?
Distribution of Grants by Level of Curriculum AY2010-AY2018 (N=97)*
48%
43%
40% 39%
18%
Pre-K (n=39) Elementary (n=47) Middle (n=42) High (n=38) Post-Secondary (n=17)
*Percentages add up to more than 100% because some grantees address more than one grade level category.
Exhibit 2.8 below shows variation in grade levels of curriculum across different award years. The exhibit
shows there was variability across funding years with regard to the number of grants awarded for
curriculum addressing the different grade level categories.
IMPAQ International, LLC Page 9 NHEP Portfolio Analysis Final Report
3-18-2021Exhibit 2.8. How Has Curriculum Development for Different Grade Levels Varied Across Award Years?
Number of Grants by Level of Curriculum by Cohort (N=97)*
14
11 11
9
8 8 8 8 8 8
7 7
6 6 6
5 5 5 5 5 5
4 4 4
3 3
1 1
2 2 2
1 0 1 0
AY2010 (n=8) AY2011 (n=23) AY2012 (n=17) AY2013-14 (n=19) AY2015-16 (n=12) AY2017 (n=25) AY2018 (n=13)
Pre-K (n=39) Elementary (n=47) Middle (n=42) High (n=38) Post-Secondary (n=17)
*Numbers add up to more than the number of grants for which data was available each year, because some grants include curriculum for more than one
grade level category.
IMPAQ International, LLC Page 10 NHEP Portfolio Analysis Final Report
3-18-2021Geographic Target Areas
We also looked at the distribution of the grants and funding by geographic area or island. Exhibit 2.9
displays the distribution of the grants by island and shows that 81% of the grants across all award years
have targeted the island of O‘ahu. Forty percent of the grants targeted the island of Hawai‘i, 26%
targeted the islands of Maui and Moloka‘i, 19% the island of Kaua‘i and 6% targeted Lāna‘i.
Exhibit 2.9. Which Islands Have Grantees Been Serving?
AY2010-AY2018 Distribution of Grants by Geographic Target Area (N=103)*
81% (83)
40% (41)
26% (27) 26% (27)
19% (20) 6% (6)
O‘ahu Hawai‘i Island Maui Moloka‘i Kaua‘i Lāna‘i
*Percentages add up to more than 100% because some grantees serve more than one island.
It is interesting to compare these percentages with the distribution of population across counties.
Exhibit 2.10 presents the proportion of the state population that resides in each county. It is important
to keep in mind that many grants target multiple islands. Overall, the distribution of grants is somewhat
parallel to that of the total population, but a somewhat higher proportion of grants are serving neighbor
islands than their proportion of the population.
Exhibit 2.10 What Proportion of the Total Population Does Each County Represent?
Distribution of General Population in the Hawaiian Islands
69%
14% 12% 5%
O‘ahu Hawai‘i Island Maui & Molokai Kaua‘i
IMPAQ International, LLC Page 11 NHEP Portfolio Analysis Final Report
3-18-2021Target Populations
We looked at the populations targeted by the grants in several ways. Exhibit 2.11 shows the number of
grants that served different types of participants (students, parents and teachers). Because the data for
the two recent cohorts are more complete than for the earlier award years, this information is displayed
separately for the combined AY2010-A2016 cohorts and the combined AY2017-AY2018 cohorts. As shown
in Exhibit 2.3, target populations were available for only 57 of the 79 AY2010-AY2016 grants. Below we see
that the vast majority (92-95%) of the grants for which this information is available have been targeting
students. Teachers were the next most common target, with fewer grants targeting parents.
Exhibit 2.11. Which Types of Participants Have Grantees Been Serving?
Percentage of AY2010-AY2016 and AY2017-AY2018 Targeting Participant Groups
(N=95)*
95% (54) 97% (37)
65% (37) 63% (24)
51% (29) 47% (18)
Students Parents Teachers
% AY2010-AY2016 (n=57) % AY2017-AY2018 (n=38)
*Percentages add up to more than 100% because some grantees address more than one participant group.
We also looked at the types of participants targeted within each of the more recent cohorts. Exhibit 2.12
shows the number of participants of each type within the AY2017 and AY2018 cohorts. (Number of
participants targeted was not available for the 2010-2016 cohorts.)
Exhibit 2.12. How Many Students, Parents, and Teachers Did RECENT Grantees Plan to Serve?
Number of AY2017 and AY2018 Students, Parents, Teachers TARGETED by Cohort (N=57,740)
AY2017 (n=41,689) 32,150 7,305 2,234
AY2018 (n=16,051) 10,064 5,300 687
0 10,000 20,000 30,000 40,000 50,000 60,000 70,000 80,000
Students (n=42,214) Parents (n=12,605) Teachers (n=2,921)
Another way of looking at the student populations targeted by recent grantees was to identify some of
the key characteristics of the populations targeted. Exhibit 2.13 shows the number of Native Hawaiians
targeted as well as the number of participants classified as low income, disabled, English learners,
homeless and/or foster youth. The exhibit shows that 100% of grantees have been targeting Native
IMPAQ International, LLC Page 12 NHEP Portfolio Analysis Final Report
3-18-2021Hawaiians, and 42% have been targeting low income. Far fewer have been targeting other populations
such as students with disabilities (6 grants), English learners (3 grants), homeless (2 grants) and foster
youth (1 grant).
Exhibit 2.13. What Target Populations Did RECENT Grantees Plan to Serve?
Number of AY2017-AY2018 Grantees That Targeted Each Population (N=38)*
38 (100%)
16 (42%)
3 (8%) 2 (5%) 1 (3%)
6 (16%)
Native Hawaiians Low Income Disabled English Learners Homeless Foster Youth
*Percentages add up to more than 100% because some grantees address more than one target population.
Project Objectives
For the recent grantees, we were able to look at the types of objectives addressed by each grant. Exhibit
2.14 shows the number of grantees in the AY2017-AY2018 cohorts specifying at least one program
objective for each type of participant (students, teachers, parents). Thirty-seven grants (97%) had at
least one objective targeting students, 22 (58%) had at least one objective targeting teachers, and 18
(47%) had at least one objective targeting parents.
Exhibit 2.14. How Many RECENT Grants Specified Objectives for Different Types of Participants?
Percentage of AY2017-AY2018 Grants That Had At Least One Objective
by Type of Participant (N=38)
37 (97%)
22 (58%)
18 47%
Students Parents Teachers
Looking at the specific types of student level objectives of the AY2017-AY2018 grants, Exhibit 2.15 shows
the most common student objective was school readiness among pre-K students (EC – Readiness), which
was targeted by 15 grantees. The academic achievement of elementary and middle school students were
the next most common student objectives, being addressed by 13 and 10 of the grantees, respectively.
Nine of the grants addressed college/career dropout prevention (such as academic support and college
planning) and 8 addressed high school academic achievement. Other student objectives addressed by
recent grantees included on-time graduation from high school, Hawaiian language, scholarship awards,
college and career prep for high school students and non-academic objectives such as ethnic pride, school
engagement and life skills training.
IMPAQ International, LLC Page 13 NHEP Portfolio Analysis Final Report
3-18-2021Exhibit 2.15. What Kinds of Objectives Have RECENT Grantees Had for Their Students?
Percentage of AY2017-AY2018 Grantees with STUDENT Objectives (N=38)
EC - Readiness 39% (15)
Elem - Academic Achievement 34% (13)
Middle - Academic Achievement 26% (10)
College/Career Dropout Prevention 24% (9)
High - Academic Achievement 21% (8)
On-time Graduation 16% (6)
Elem - Hawaiian Language Skills 11% (4)
EC - Hawaiian Language Skills 11% (4)
Scholarships Awarded 8% (3)
High - Hawaiian Language Skills 8% (3)
Middle - Non-academic 8% (3)
Job Training and Prep 5% (2)
High - Non-academic 5% (2)
College/Career ACT/SAT Scores 5% (2)
Middle - Hawaiian Language Skills 5% (2)
High - Satisfaction 3% (1)
Elem - Non-Academic 3% (1)
As shown in Exhibit 2.16, among grants with objectives for serving parents, the most common objectives
addressed parent involvement and increasing parent knowledge. Four grants also had objectives related
to parent satisfaction with the services their students received.
Exhibit 2.16. What Kinds of Objectives Have RECENT Grantees Had for Their Parents?
Percentage of AY2017-AY2018 Grantees with PARENT Objectives (N=38)
Parent Involvement 32% (12)
Parent Knowledge 29% (11)
Parent Satisfaction 11% (4)
Exhibit 2.17 shows that the most common type of objective for teachers has been to provide
professional development (Teacher PD), which was an objective for 58% of recent grantees. The second
most common (18%) has been to increase teacher’s knowledge in specific content areas. The third type
of teacher objective has been to provide teachers with mentoring or coaching.
Exhibit 2.17: What Kinds of Objectives Have RECENT Grantees Had for Their Teachers?
Percentage of 2017 and 2018 Grantees with Teacher Objectives (N=38)
Teacher PD 58% (22)
Teacher Knowledge 18% (7)
Teacher Mentoring/Coaching 13% (5)
IMPAQ International, LLC Page 14 NHEP Portfolio Analysis Final Report
3-18-2021Partners
As shown earlier in Exhibit 2.3, we were able to code information about grantees’ partners for 30 of the
38 recent grants. We found that the AY2017-AY2018 grantees engaged a total of 1,026 partners. This
reflects an average of 31 partners per grantee.
Looking at the types of organizations with which grantees partnered, we found that 29 grantees
partnered with preK-12 schools, 19 partnered with government agencies and 18 partnered with Native
Hawaiian organizations (see Exhibit 2.18). Another 17 grantees partnered with colleges/universities and
14 with youth serving organizations.
Exhibit 2.18. What Types of Organizations have been RECENT Grantees’ Partners?
Number of AY2017-AY2018 Grantees Which Included Partners by Type (N=38)
PreK-12 Schools 29 (76%)
Government Agencies 19 (50%)
NH Services/Cultural Orgs 18 (47%)
Colleges/Universities 17 (45%)
Other Partners 16 (45%)
Youth Serving Organizations 14 (37%)
Other Community Based Orgs 12 (32%)
Health Programs 7 (18%)
Housing Programs/Services 4 (11%)
When looking at the total number of partners by type, we see in Exhibit 2.19 that 279 (27%) of the 1,026
partners were preK-12 schools. Even though we identified the most common types of partners, the
“Other” category was very large. It was also very diverse, so it might be worthwhile to review it to
identify more categories for future documentation. For example, many of these partners are individuals,
some include foundations such as Easter Seals or Castle Foundation, some are private sector firms such
as Hawaiian Airlines, and Dolphin Quest, and others are public entities such as Volcano National Park or
Dry Forest Reserve Initiative.
IMPAQ International, LLC Page 15 NHEP Portfolio Analysis Final Report
3-18-2021Exhibit 2.19. How Many Partners Have RECENT Grantees Reported?
Total Number of Partners by Type for AY2017-AY2018 (N=1,026)*
Prek-12 Schools 279 (27%)
Other Partners 238 (23%)
Other Community Based Orgs 131 (13%)
Youth Serving Organizations 102 (10%)
NH Services/Cultural Orgs 100 (10%)
Government Agencies 63 (6%)
Health Programs 52 (5%)
Colleges/Universities 49 (5%)
Housing Programs/Services 12
*The total number of partners here is higher than the total reported above, because some partner organizations
were coded as being more than one type, such as a Native Hawaiian health organization.
One challenge for coding this information is determining whether an entity is actually a partner or
something else, such as simply a field trip destination. Clarifying the definition of partner would be
important to better understanding grantee partnerships. Asking grantees to document how partners
contribute to the grant could also help in understanding the role of partnerships in these grant programs.
IMPAQ International, LLC Page 16 NHEP Portfolio Analysis Final Report
3-18-20213. ANALYSIS OF FUNDING PATTERNS
Introduction
IMPAQ’s overall approach to analyzing NHEP funding patterns was to examine the distribution of grant
funding across different funding cohorts and grant characteristics. The key characteristics included in
this analysis are the education sector targeted, type of grantee organization, and geographic target area.
Here we also report the extent to which grantees carryover funds from one year to the next. Information
on grantee evaluation budgets is presented in Chapter 5 of this report.
Due to the variation in the availability of data, each analysis is based only on the grants for which each of
the data items used in that chart is currently available. Exhibit 3.1 shows the number of grants for which
data items are available for the analysis of funding patterns.
Exhibit 3.1. To What Extent Are Funding Pattern Data Items Available?
Percentage of Grants For Which Funding Pattern Data Were Provided (N=117)
92% (73)
Total Grant Amount
100% (38)
100% (79)
Year 1 Funding
100% (38)
99% (78)
Year 2 Funding
100% (38)
32% (25)
Year 1 and Year 2 Carryover
95% (36)
90% (71)
Year 3 Funding
100% (38)
16% (13)
Year 3 Carryover
42% (16)
(10% (8)
Matching Funds
16% (6)
Budget for Evaluation
58% (22)
0% 20% 40% 60% 80% 100%
AY2010-2016 (n=79) AY2017-AY2018 (n=38)
The previous review of budget data did not include grant evaluation budgets, so that information is only
available for the two recent cohorts, AY2017-AY2018.
IMPAQ International, LLC Page 17 NHEP Portfolio Analysis Final Report
3-18-2021Exhibit 3.2 summarizes the grant funding included in this analysis by award year (AY). For each award
year we provide the number of grants awarded, the number of grants for which we had funding data
and the total funding included in this analysis. It is important to note that for the AY 2018, the Year 3
funding data was obtained from the federal grant award notice (GAN) and could not be confirmed with
budget actuals, which had not yet been submitted to USDOE at the time of our analysis.
Exhibit 3.2. Summary of Grant Funding Included in Analysis
Number of Grants with Aggregated Total Funding
Award Year (AY) Number of Grants Total Funding Amount Amounts Included in Analysis
Cohort in Cohort Included in Analysis (N=111)
AY2010 8 8 $ 8,758,680
AY2011 23 23 $ 53,437,128
AY2012 17 17 $ 42,844,432
AY2013-14 19 19 $ 57,231,339
AY2015-16 12 6 $ 14,434,637
AY2017 25 25 $ 75,796,101
AY2018 13 13 $ 24,540,112
TOTALS 117 111 $277,042,429
The following charts summarize funding patterns by:
Award Year (AY) Cohort
Education sector (including education levels and types of activities that are not mutually
exclusive, such as Pre-K, elementary, middle, high, Teacher PD/Support, curriculum
development)
Level of curriculum (e.g., the grade levels of curriculum being developed/piloted/ evaluated, i.e.,
Pre-K, elementary, middle, high)
Organizational type (e.g. charter school, community college, Native Hawaiian community-based
organization, other community-based organization, UH Mānoa, other university, other
organization)
Geographic target area (e.g., O‘ahu, Hawai‘i Island, Maui, Kaua‘i, Moloka‘i, and Lāna‘i)
Carryover funding.
Funding by Award Year Cohort
Exhibit 3.3 shows the total amount of grant funding awarded each year. It is important to note that the
data for AY15 is incomplete because the financial data required for this analysis was submitted by only 6
of those 12 grantees. Thus, the total funding amount for AY15 reflected in our funding comparisons is
artificially low and has had an unknown effect on the percentages used for funding comparisons in other
analyses in this report. As the exhibit illustrates, the total amount of funding for the program has varied
dramatically from year to year, with AY2017 being the highest at almost $76 million, and AY2010 the
lowest at less than $9 million.
IMPAQ International, LLC Page 18 NHEP Portfolio Analysis Final Report
3-18-2021Exhibit 3.3. How Much Total Funding Was Awarded Each Year?
Total Funding Amount by Cohort (N=111): $277,042,429
$75,796,101
$57,231,339
$53,437,128
$42,844,432
$24,540,112
$8,758,680 $14,434,637
AY2010 AY2011 AY2012 AY2013-14 AY2015-16 AY2017 AY2018
(n=8) (n=23) (n=17) (n=19) (n=6) (n=25) (n=13)
Since the number of grants awarded has also varied from year to year, it is also instructive to look at the
average amount of funding awarded to each grant. Exhibit 3.4 compares the average funding per grant
by award year. The annual average funding per grant has fluctuated between a low of just over $1
million in AY2010 to a high of over $3 million in AY2017, with the overall average being $2,792,885 per
grantee. It is interesting to note when comparing Exhibits 3.3 and 3.4, that not only did AY2017 award
the largest total amount of funding with the highest number of grantees, but that year also awarded the
highest average funding to each grantee as well. AY2010 not only had the lowest total amount of
funding, but also awarded the lowest average funding to each grantee.
Exhibit 3.4. What was the Average Grant Amount Awarded Each Year?
Average Funding by Cohort (N=111)
$3,012,176 $3,031,844
$2,323,353 $2,520,261 $2,405,773
$1,887,701
$1,094,835
AY2010 AY2011 AY2012 AY2013-14 AY2015-16 AY2017 AY2018
(n=8) (n=23) (n=17) (n=19) (n=6) (n=25) (n=13)
Average ($2,325,135)
Funding by Education Sector
Exhibit 3.5 displays the percentage of total funding awarded by education sector. As with previous
exhibits, the percentages for this graph add up to more than 100% because some of the grants
addressed more than one sector. For the 97 grants for which we have data on both total funding and
education sector, 60% of the funding went to projects that included curriculum development, 59%
percent of the funding went to projects that included teacher professional development, and 52% of the
funding went to projects that targeted the Pre-K level.
IMPAQ International, LLC Page 19 NHEP Portfolio Analysis Final Report
3-18-2021Exhibit 3.5. How Were Grant Funds Distributed Across Education Sectors?
AY2010-AY2018 Proportion of Total Funding by Education Sector (N=97)*:
$277,042,429
59% 60%
52%
34%
25% 23%
11%
Pre-K (n=39) Elementary Middle (n=42) High (n=38) Post-Secondary Teacher PD/ Curriculum
(n=47) (n=17) Support (n=65) (n=60)
*Percentages add up to more than 100% because some grants address more than one education sector.
Exhibit 3.6 shows the distribution of funding by education sector across award years for the 97 grants
for which education sector information was available. Again, this illustrates significant variation over
time. One notable difference is that relatively less funding was awarded for preschool (Pre-K), teacher
PD and curriculum development sectors, and more for elementary, middle and high school students in
2018 than in many of the earlier years.
Exhibit 3.6 How Has the Distribution of Funding by Education Sector Varied Across Award Years?
Total Funding by Education Sector by Award Year (N=97): $241,202,966
$55,000,000
$50,000,000
$45,000,000
$40,000,000
$35,000,000
$30,000,000
$25,000,000
$20,000,000
$15,000,000
$10,000,000
$5,000,000
$0
AY2010 (n=4) AY2011 (n=16) AY2012 (n=14) AY2013-14 AY2015-16 AY2017 (n=25) AY2018 (n=13)
(n=13) (n=12)
Pre-K Elementary Middle High Post-Secondary Teacher PD/Support Curriculum
Curriculum Development
We took a closer look at the 63 grants that included a curriculum development component to see what
grade levels the curriculum is targeting. When looking at individual award years, Exhibit 3.7 shows that
AY2011, AY2012, and AY2017 were characterized by greater funding amounts directed toward the Pre-K
and elementary grade levels. The AY2013-14 cohort is characterized by a lower amount of funding
directed toward the elementary grades, while maintaining the pattern of high funding levels for Pre-K.
The data for AY2018 displays a unique pattern of more even distribution across grade levels, except for Pre-K.
IMPAQ International, LLC Page 20 NHEP Portfolio Analysis Final Report
3-18-2021Exhibit 3.7. How Has Funding by Level of Curriculum Varied Across Award Years?
AY2010-AY2018 Total Funding by Level of Curriculum Created by Cohort (N=63):
$172,239,483
$32,000,000
$28,000,000
$24,000,000
$20,000,000
$16,000,000
$12,000,000
$8,000,000
$4,000,000
$-
AY2010 (n=3) AY2011 (n=15) AY2012 (n=9) AY2013-14 AY2015-16 AY2017 (n=14) AY2018 (n=5)
(n=10) (n=7)
Pre-K (n=26) Elem (n=25) Middle (n=24) High (n=5) Post-Secondary (n=17)
Funding by Grade Level
When looking at total grant funding allocated to services to students across all years, Exhibit 3.8 shows
greater amounts of funding went to Pre-K (almost $144 million) and elementary (almost $94 million)
grade levels. The middle and high school grade-level categories received almost $69 million and just
over $64 million respectively, across all grant funding years, with the smallest amounts going toward
post-secondary, at just under $31 million.
Exhibit 3.8. How Has Funding Been Distributed Across Grade Levels?
AY2010-AY2018 Total Funding by Grade Level (N=111): $223,900,080
$143,798,889
$93,644,695
$68,991,266 $64,066,495
$30,672,900
Pre-K (n=39) Elementary (n=47) Middle (n=42) High (n=38) Post-Secondary (n=17)
Funding by Grantee Organization Type
Exhibit 3.9 displays the percentage of grant funding by organization type across all award years. Overall,
63% of the total grant funding was awarded to Native Hawaiian community-based organiziations (CBO)
and 19% was awarded to University of Hawai‘i at Mānoa. The remaining funding was awarded to charter
schools (3%), community colleges or other universities (4%), other community-based organizations (4%)
and other organizations (6%).
IMPAQ International, LLC Page 21 NHEP Portfolio Analysis Final Report
3-18-2021Exhibit 3.9. How Much Funding Has Been Awarded to Different Types of Grantee Organizations?
Total Grant Funding by Organizational Type (AY2010-AY2018)
(N=111): $269,108,610
6%
3%
4%
19%
63%
4%
NH CBO (n=53) Other CBO (n=8)
UH Mānoa (n=28) Comm.College/ Other Univ. (n=5)
Charter School (n=7) Other (n=10)
Exhibit 3.10 shows the amount of funding by type of organization for each award year. AY2013-14 and
AY2017 account for the greatest proportion of the funding that went to Native Hawaiian community-
based organizations. However, AY2011 and AY2012 also show a large proportion of funding going to
these organizations. AY2011 and AY2017 account for the greatest proportion of funding that went to
the University of Hawai‘i at Mānoa.
Exhibit 3.10. How Has Funding by Type of Organizations Varied Across Award Years?
Total Funding by Type of Organization by Cohort (N=105): $269,108,610
$60,000,000
$55,000,000
$50,000,000
$45,000,000
$40,000,000
$35,000,000
$30,000,000
$25,000,000
$20,000,000
$15,000,000
$10,000,000
$5,000,000
$-
AY2010 AY2011 AY2012 AY2013-14 AY2015-16 AY2017 AY2018
(n=5) (n=21) (n=16) (n=19) (n=6) (n=25) (n=13)
NH CBO (n=53) Other CBO (n=8) UH Mānoa (n=28) Comm. College/Other Univ. (n=5) Charter School (n=7) Other (n=10)
Funding by Geographic Target Area
To compute distribution of resources across islands we looked first to the number of students served,
then teachers, parents and number of schools served on each island. We calculated the percentage of
these served on each island. We adjusted those percentages to take into account differences from one
type of participant to another or from one year to another. We used this information to estimate the
IMPAQ International, LLC Page 22 NHEP Portfolio Analysis Final Report
3-18-2021You can also read