Evaluation of optimised groyne designs in response to long-period ship wave loads at Juelssand in the Lower Elbe Estuary
←
→
Page content transcription
If your browser does not render page correctly, please read the page content below
Article, Published Version

Melling, Gregor; Jansch, Hanne; Kondziella, Bernhard; Uliczka, Klemens;
Gätje, Bettina
Evaluation of optimised groyne designs in response to
long-period ship wave loads at Juelssand in the Lower Elbe
Estuary
Die Küste
Zur Verfügung gestellt in Kooperation mit/Provided in Cooperation with:
KFKI - Kuratorium für Forschung im Küsteningenieurwesen (Hg.)

Verfügbar unter/Available at: https://hdl.handle.net/20.500.11970/107411

Vorgeschlagene Zitierweise/Suggested citation:
Melling, Gregor; Jansch, Hanne; Kondziella, Bernhard; Uliczka, Klemens; Gätje, Bettina
(2021): Evaluation of optimised groyne designs in response to long-period ship wave loads at
Juelssand in the Lower Elbe Estuary. In: Die Küste 89. Karlsruhe: Bundesanstalt für
Wasserbau. S. 29-56. https://doi.org/10.18171/1.089103.

Standardnutzungsbedingungen/Terms of Use:

Die Dokumente in HENRY stehen unter der Creative Commons Lizenz CC BY 4.0, sofern keine abweichenden
Nutzungsbedingungen getroffen wurden. Damit ist sowohl die kommerzielle Nutzung als auch das Teilen, die
Weiterbearbeitung und Speicherung erlaubt. Das Verwenden und das Bearbeiten stehen unter der Bedingung der
Namensnennung. Im Einzelfall kann eine restriktivere Lizenz gelten; dann gelten abweichend von den obigen
Nutzungsbedingungen die in der dort genannten Lizenz gewährten Nutzungsrechte.
Documents in HENRY are made available under the Creative Commons License CC BY 4.0, if no other license is
applicable. Under CC BY 4.0 commercial use and sharing, remixing, transforming, and building upon the material
of the work is permitted. In some cases a different, more restrictive license may apply; if applicable the terms of
the restrictive license will be binding.
Die Küste, 89, 2021                                                      https://doi.org/10.18171/1.089103

Evaluation of optimised groyne designs in response
to long-period ship wave loads at Juelssand in the
Lower Elbe Estuary
Gregor Melling1, Hanne Jansch2, Bernhard Kondziella2, Klemens Uliczka2 and Bettina Gätje3
1 Federal Waterways Engineering and Research Institute (BAW), gregor.melling@baw.de
2 Federal Waterways Engineering and Research Institute (BAW)
3 Federal Waterways and Shipping Administration Hamburg (WSA)

Summary
In the past 15 years, increased severity of damages to rock structures such as groynes, train-
ing walls and revetments have been observed across the major German estuaries. Investi-
gations into the cause of the damages concluded that structure deterioration could be at-
tributed to long-period primary ship wave loading. Owing to changes in the shipping fleet,
in particular the ever-increasing dimensions of container vessels, the intensity of ship-in-
duced loads has increased significantly. As a result, existing rock structures are, in certain
parts, under-dimensioned for the presently prevalent load intensities. To evaluate the per-
formance of two new groyne designs, optimised with a view to increase structure resistance
to long-period wave loads, a prototype study was undertaken. Two groynes in the tidal
Lower Elbe were rebuilt, one with a large-radius root and one with a recessed root. During
the field experiment the incident ship-induced wave loading and the armour layer defor-
mation was recorded. The field experiment and some fundamental findings with regard to
the wave-structure-interaction at prototype scale and the performance of the optimised
groyne designs are documented here. Furthermore, insights into mitigation measures are
given, based on analyses of the collected data.

Keywords
rock groyne, recessed groyne, ship wave, long-period wave, wave-structure interaction,
overtopping, Juelssand, Elbe

Zusammenfassung
Über die vergangenen 15 Jahre wurden in deutschen Ästuaren zunehmend Schäden an Schüttsteinbauwer-
ken beobachtet. Als Ursache konnte die langperiodische Schiffswellenbelastung ausgemacht werden, die
aufgrund der zunehmenden Schiffsgröße in den letzten Jahrzehnten deutlich stärker wirkt. Als Folge sind
(Ufer-)Bauwerke mancherorts für die vorherrschenden Belastungsintensitäten unterdimensioniert. Im Rah-
men einer Pilotstudie wurden zwei, hinsichtlich der Stabilität der Deckschicht optimierte, Buhnenkonstruk-
tionen untersucht. Dabei wurden zwei Buhnen in der tidebeeinflussten Unteren Elbe neu aufgebaut, eine
Buhne mit ausgerundeter Wurzel und eine mit hinterströmten Bereich. Während des Feldversuchs wurden
die auflaufenden schiffsbedingten Belastungen und die Entwicklung der Buhnendeckschicht aufgezeichnet.
Die Durchführung des Feldversuchs sowie einige grundlegende Ergebnisse hinsichtlich der Schiffswellen-

                                                                                                        29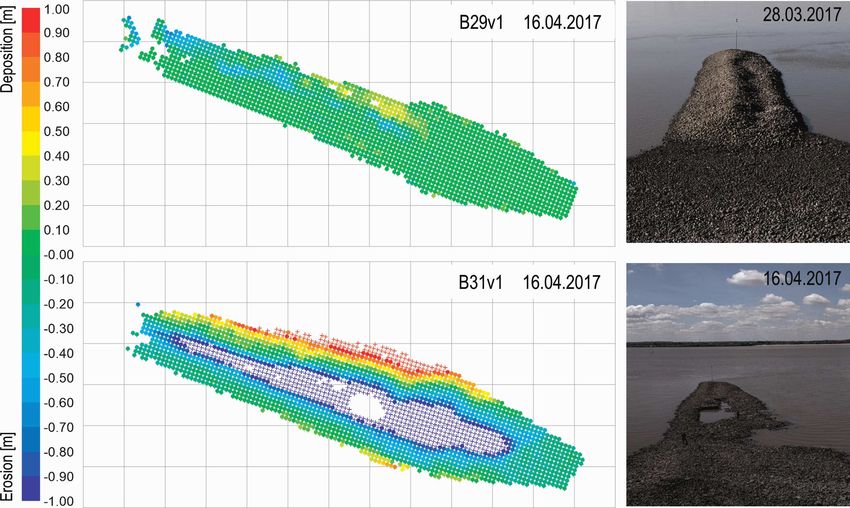
Die Küste, 89, 2021                                                    https://doi.org/10.18171/1.089103

Struktur-Interaktion im Naturmaßstab und die Eigenschaften der optimierten Buhnenkonstruktionen
werden hier dokumentiert. Des Weiteren werden, basierend auf Auswertungen der erhobenen Daten, Hin-
weise hinsichtlich der Möglichkeiten zur Reduzierung von Schäden an Schüttsteinbuhnen gegeben.

Schlagwörter
Buhne, hinterströmte Buhne, Schiffswelle, lang-periodische Welle, Wellen-Struktur-Interaktion, Überströ-
men, Juelssand, Tideelbe

1    Background
1.1 Engineering issue
In the past 15–20 years, increased severity of damages to rock structures such as groynes,
training walls and revetments have been observed across the major German estuaries (e.g.
Ohle and Zimmermann 2003, WSA Bhv 2009, BAW 2010, WSA HH 2010, BAW 2012).
In response, using practical engineering judgement, different measures to increase the sta-
bility of training walls and groynes were undertaken. These included shallower slope angles,
reduced crest widths as well as wider groyne root areas and smoother revetments transi-
tions (WSA Bhv 2009, WSA Cux 2012). While mitigation measures were taken, the pro-
cesses and mechanisms underlying these damages remained poorly understood. Investiga-
tions into the cause of the damages were subsequently carried out by BAW (2010) which
confirmed that structure deterioration could in large part be attributed to long-period ship
wave loading. Owing to changes in the shipping fleet, in particular the ever-increasing di-
mensions of container vessels, the intensity of ship-induced loads on estuary infrastructure
has increased significantly. Ship-induced loads have over the recent years become the most
relevant hydraulic loading in German estuaries with major shipping lanes. As a result, ex-
isting rock structures are, in parts, under-dimensioned for the presently prevalent load in-
tensities. Looking into the future it is expected that ship-induced loading will further in-
crease with continuing trends towards greater vessel sizes and increased traffic density.
Also, the percentage of all waterway traffic associated with ultra large container vessels
(ULCV) of the “New Panamax” and “Triple E” categories is likely to increase.

1.2 State of the research
While the described engineering problem is becoming increasingly common in German
waterways, interestingly, a survey of European and international coastal/waterway engi-
neering bodies and research institutes in 2012 resulted in the feedback that structural dam-
age in response to long-period ship waves is not currently seen as a significant problem and
is mitigated either by vessel speed restrictions or implicitly accounted for in structure design
(cf. BAW 2012). Nevertheless, in recent years various impacts associated with the long-
period wave, alternatively termed “Bernoulli wake”, “depression wake” or “hull displace-
ment wave” by other authors, have become increasingly apparent in other countries (e.g.
Ravens and Thomas 2008, Rapaglia et al. 2011, Gelinas et al. 2013, Göransson et al. 2014,
Zaggia et al. 2017). While these studies have been primarily concerned with the impact of
long-period ship waves on sediment transport, morphodynamic effects and bank erosion,

30
Die Küste, 89, 2021                                               https://doi.org/10.18171/1.089103

none have been focussed explicitly on the stability of with rock structures. Nevertheless,
existing studies contribute to the understanding of the behaviour of long-period waves in
shallow and confined waterways as well as demonstrating their erosive capacity.
    Rapaglia et al. (2011) investigated the drawdown-related resuspension of sediments in
Venice Lagoon and reported flow velocities greater than 2 m/s associated with the trough
of the primary wave. Sediments are transported in the direction of the shipping channel,
with channel maintenance implications. Similarly, in Venice Lagoon, Scarpa et al. (2019)
describe the erosive effects of the depression wave in tidal flats. High rates of shoreline
retreat were also associated with the action of the long-period depression wave. As very
large depressions of up to 2.45 m were recorded, the authors posit that the drawdown
depression wave can be amplified by shoaling and wave transformation effects in the chan-
nel margins, eventually transforming into a sharp-crested travelling solitary depression
wave, with significant vertical velocity components. The height of the drawdown was linked
to Froude-Number and displaced water volume. As mitigation measures, speed restrictions
and the optimisation of ship hull shapes are discussed. The transformation of the depres-
sion wave in shallow areas into a bore-like feature resembling a non-linear solitary Riemann
wave is also described by Parnell et al. (2015). Göransson et al. (2014) report that in Göta
Älv, the measured turbidity maximum was dependent on drawdown height, but that both
primary and secondary ship waves are responsible for shoreline steepening and erosion
effects. Measurements in the Kiel canal revealed that while there are strong dependencies
between hull geometry the primary wave and associated near-bottom return-flow velocities,
the turbidity maximum was correlated most nautical parameters, but only weakly (Niehüser
et al. 2016). Based on these measurements Ulm et al. (2020) concluded that approx. 10 %
of the total sediment transport can be attributed to vessel traffic, indicating that morpho-
logical effects of shipping can play a relevant role in the maintenance cost of waterways. In
a similar vein, Zaggia et al.’s (2017) analysis of survey and remote sensing data showed that
in relatively sheltered settings such as estuaries and lagoons with heavy vessel traffic the
morphological evolution can be dominated by shipping-related effects, surpassing natural
erosive agents such as storms. The authors note not only the shear-stresses induced from
the drawdown but also the erosive effects of the trailing primary wave on adjacent beaches
and erosion scarps. Regression rates of up to 4 m/year are reportedly associated with ship-
ping effects.
    With increasing vessel dimensions and draughts as well as increasing traffic density, it
is not unlikely that adverse effects from primary ship waves will become more widespread
and prevalent in tidal waterways in the future, affecting the function and condition of man-
made shoreline infrastructure, such as sluice gates, embankments, training walls and
groynes, which are the focus of this study. With a view to developing guidance and methods
for rock groyne design, BAW, in cooperation with several university partners, devised a
multi-faceted research framework in which the wave-structure interaction was investigated
in significant detail. The research reflects the current state-of-the-art for groyne design with
respect to long-period wave loading. A detailed summary of the individual work packages
and their respective findings is available in BAW (2018). Here, only a brief overview of the
conducted research shall be given in order to provide the necessary context for the pre-
sented work.
The early research from BAW (2010) and BAW (2012) focused on descriptions of the ob-
served damage patterns for different rock structures in German estuaries and a process-

                                                                                                 31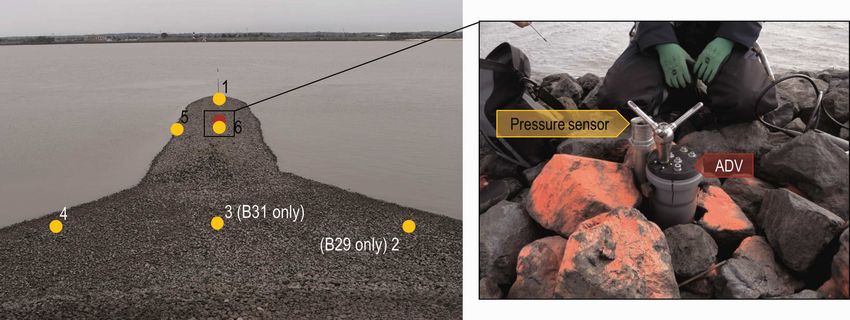
Die Küste, 89, 2021                                              https://doi.org/10.18171/1.089103

based understanding of the load cases and damage mechanisms. Conceptual models of the
loading and failure mechanisms were proposed and in-situ pressure measurements at
Langlütjen training wall in the Outer Weser were undertaken to validate the theoretical
models. A detailed assessment and description of the wave-structure interaction and dam-
age mechanisms was conducted by Gier and Schüttrumpf (2012) and a freeboard-depend-
ent classification of the various load cases was developed. An investigation into available
design equations for the most damaging load case concluded that the stability of existing
groynes could not be confirmed. Furthermore, it was concluded that guidance for structure
design in response to (wind) wave loading (e.g. Hansen 1985, EAK 2002, CIRIA et al.
2007), while applicable for secondary ship waves, does not adequately account for the pro-
cesses associated with long-period wave loading, in particular highly turbulent overtopping
flows, and is thus not applicable. In fact, the relevant processes resemble more closely those
found at rockfill dams, spillways and overtopped embankments as will be explained in more
detail below.
    Oumeraci and Brühl (2013) investigated field and lab measurements of ship waves in
an attempt to develop an analytical model for wave generation and propagation. This in-
cluded the classification of different wave types and generalised wave characteristics based
on ship type, speed and channel geometry. Frequency analysis is used to determine the
spectral characteristics of the long-period wave component and identify wave parameters
that are relevant for structure design. Small-scale 2D flume tests were carried out with the
aim of determining the overtopping volumes for stationary flow, short-period waves
(Wöffler et al. 2015) and long-period waves (Oetjen et al. 2017) for model bodies with
different cross-sections and porosities. For the stationary overflow load case, using the
measured overflow volumes on different cross-sections, weir coefficients for the Poleni-
formula were derived. For short-period wave loading, the overtopping volumes as a func-
tion of freeboard height, armour layer porosity and surf similarity parameter for different
model geometries were determined. At very long wave periods the overtopping flow can
temporarily resemble the previously examined (quasi-)stationary flow situation and modi-
fied weir coefficients were determined. For the long-period load case, armour layer stability
in response to a single surge-like wave was investigated. An attempt was also made to rep-
licate the stationary flow tests in a numerical model with the aim of carrying out armour
layer stability assessments by means of coupling a detailed flow model (CFD) with a model
of structural dynamics of the rock armour layer (CSD); the efforts are documented in
Oumeraci et al. (2014).
    Based on an understanding of the structural response to the most relevant load cases
and taking cues from the characteristic patterns of damage observed in the field as well as
existing experiences with profile optimisation (WSA Bhv 2009, WSA Cux 2012) groyne
designs with an expected greater structural stability to long-period wave loading were de-
veloped. Compared to the conventional groyne design, the modifications resulted in shal-
lower slope angles on the sides and head area as well as two different configurations of the
root area, i.e. where the groyne attaches to the existing revetment. The hydraulic perfor-
mance of these innovative geometries was evaluated in 3D physical model tests in a wave
basin by BAW (2015) at 1:40 scale. Apart from the measurement of waves and currents in
the near-field of the structures and the groyne fields, the depth of the overtopping flow on
the groyne crest was recorded. No investigations of armour layer stability were conducted.

32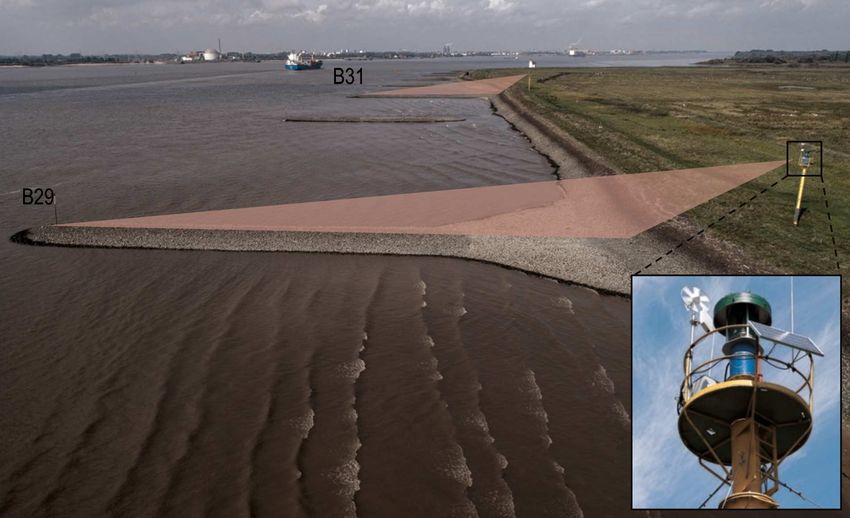
Die Küste, 89, 2021 https://doi.org/10.18171/1.089103
The research programme culminated in a prototype-scale field study of two groyne de-
signs, facilitated by close cooperation with the Federal Waterways and Shipping Office
Hamburg (WSA). Following the findings of the aforementioned physical model tests, one
groyne with a large-radius root and one with a recessed root were built. To record the
incident wave loading and document the structural response an elaborate monitoring pro-
gramme was implemented which has resulted in a unique dataset of load and resistance
information. This dataset allows for detailed examination of the wave-structure-interaction
at prototype scale and can also be used in the development of design guidance for the sizing
of rock armour layers on groynes. The aim of this paper is to document the set-up and
execution of this field experiment as well as some primary results and findings.
2 Wave-structure-interaction
2.1 Long-period primary ship waves
For large vessels in relatively narrow waterways, the long-period ship wave can present the
most relevant load with respect to shoreline infrastructure stability. Figure 1 illustrates the
primary and secondary wave systems associated with a ship travelling in confined and shal-
low water. The primary wave system consists of a bow wave followed by a water level
depression caused by a pressure drop around the vessel hull, and a transverse stern wave.
This long-period wave system is hydraulically bound to the ship hull and thus travels along
the shoreline at a rate equal to the vessel speed. Following the passing of the stern wave,
the water level drawdown is compensated with the slope supply flow which works to re-
store the ambient water level. The period THp of the primary wave is determined by vessel
length and its speed over ground (SOG); for the current vessel fleet structure in the Elbe
Estuary values of approx. 60 s < THp < 120 s are typical.
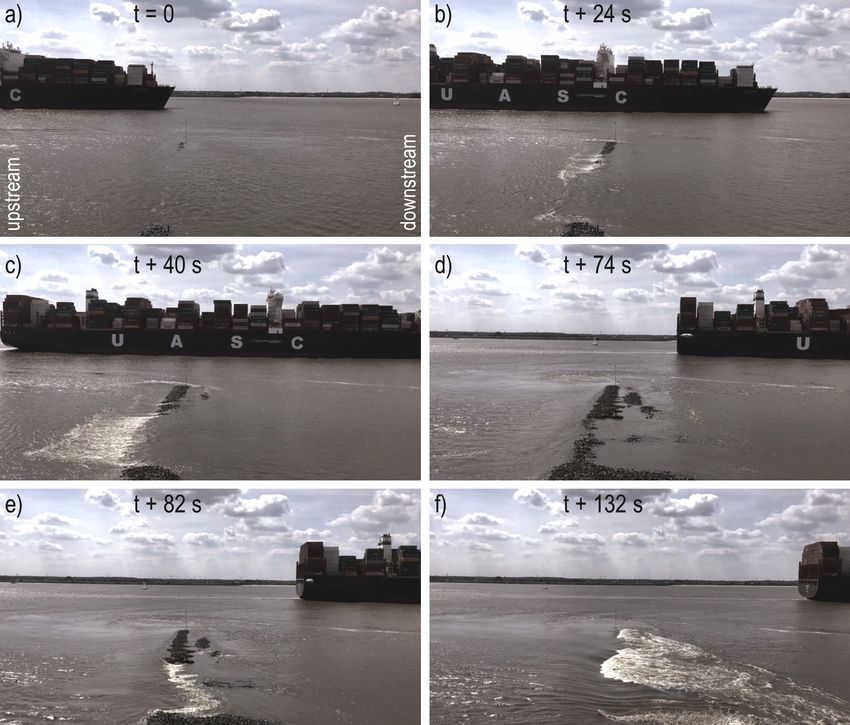
Figure 1: Schematic illustration of the ship-generated wave system in confined shallow water with
idealised ship wave record and definition of characteristic parameters.
33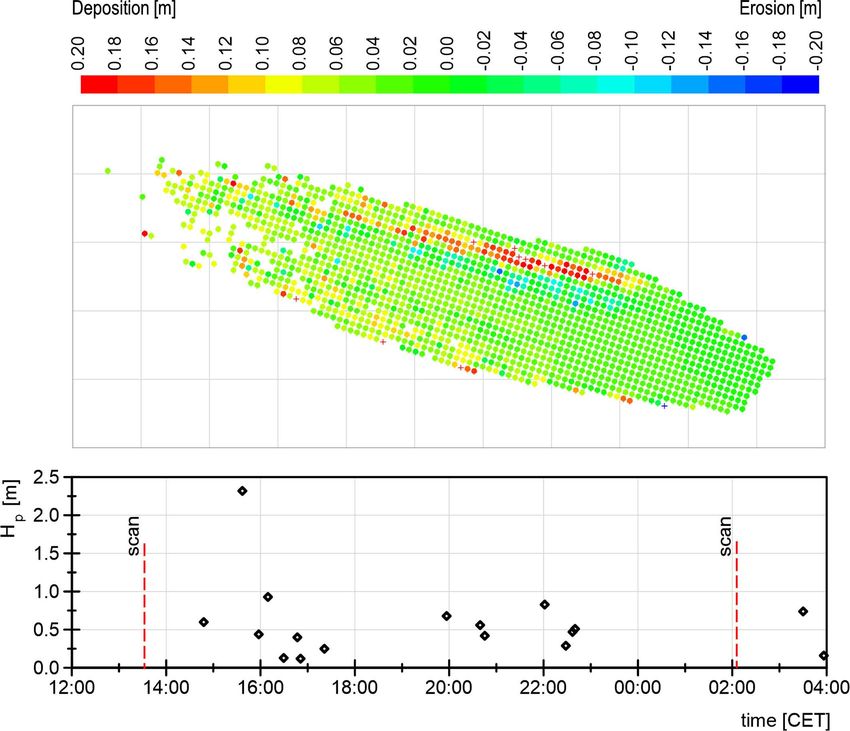
Die Küste, 89, 2021                                              https://doi.org/10.18171/1.089103

The interaction of a primary wave (THp = 95 s) with a groyne at approximately mean water
level (freeboard Rc ≈ 0) is illustrated by a series of time-lapse photographs in Figure 2. The
interaction begins with the bow wave (Figure 2a), typically small with negligible impact
(here sB = 0.1 m), followed by the drawdown (zA = 0.7 m) which causes a water level drop
in the upstream groyne field. The resulting water level gradient results in compensatory
flow over the groyne opposite to the direction of travel (Figure 2b, c). This flow situation
weakens as the vessel, and the drawdown, gradually moves into the downstream groyne
field and the original water level in the upstream groyne field begins to be restored (Fig-
ure 2d). This is associated with the arrival of the transverse stern wave and the water-level-
restoring slope supply flow. The drawdown in the downstream groyne field now acts to
reverse the water level gradient and results in a flow over the groyne in the direction of
travel (Figure 2e).

Figure 2: Interaction of long-period ship wave with groyne at Juelssand (Lower Elbe Estuary)
during passage of seaward-travelling ULCV (length 368 m, breadth 51 m) at approx. mean water
level. Passage with draught of 12.5 m, 13 kn STW and passing distance d of 228 m.

Due to wave focussing effects, which lead to a concentration of energy in the root area, the
overflow typically initiates here and subsequently spreads along the groyne towards the
head. The large gradient and the surge-like action of the transverse stern wave
(Hp = 0.71 m) results in a relatively shallow-depth (depending on tidal water level) overflow

34
Die Küste, 89, 2021 https://doi.org/10.18171/1.089103
that is characterised by high velocities and strong turbulence; flow aeration on the lee side
is also common, the extent varies with the hydraulic configuration of the overflow and
boundary effects (Figure 2f). The described processes are representative of the load case
for freeboards in the approximate range Rc ≲ 0. For positive freeboard heights overflow
phenomena may be weaker, restricted to lower parts of the groyne or replaced by stronger
flows around the head of the groyne; in this case wave run-up, wave breaking and overtop-
ping processes are dominant.
2.2 Structure response
The structural response of groynes under long-period ship wave action is described in detail
in BAW (2010) and BAW (2012). At the study site, the groynes exhibit a characteristic
pattern of damage that features the deterioration of the groyne root to the point of com-
plete destruction and deformation of the crest, particularly on the lee side, w.r.t. the incident
wave (cf. Figure 3).
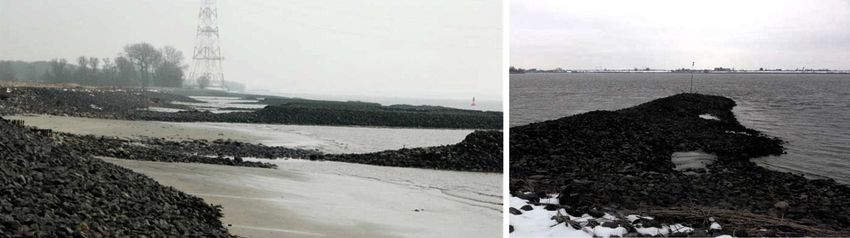
Figure 3: Characteristic damage to groynes at Juelssand (Lower Elbe Estuary) caused by long-
period ship wave action. Destruction of the groyne root (left) and erosion of the crest and lee side
slope (right).
Different load cases are relevant depending on water level and freeboard height. A differ-
entiation of the load cases Rc > 0 and Rc ≲ 0 is useful, as the processes and damage mech-
anisms are distinct and typically also affect different areas of the groyne, as illustrated con-
ceptually in Figure 4.
Figure 4: Conceptual model of load cases and associated damage due to long-period primary ship
waves in relation to freeboard Rc. Modified from Gier and Schüttrumpf (2012).
35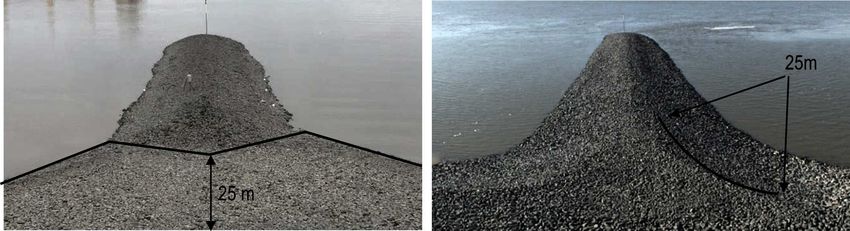
Die Küste, 89, 2021                                                  https://doi.org/10.18171/1.089103

For positive Rc, wave impact processes are prevalent, affecting mostly the wave-facing slope
(in this publication “wave-facing” is used with respect to stern waves from outgoing ships),
although some overtopping and wave run-down on the lee side is possible, de-pending on
structure parameters such as crest height and permeability. For Rc ≲ 0 the forces on the
armour layer are related primarily to overflowing of the groyne. In this case, the structural
response to supercritical loading is expected in the lee portion of the root and crest areas.
Gier and Schüttrumpf (2012) conclude that the long-period wave is particularly damaging
due to the fast-flowing and highly-turbulent overflow of the groyne.

3    Prototype field study
3.1 Site description and loading factors
Juelssand is located on the northern bank of the Lower Elbe Estuary, along the main access
channel to the Port of Hamburg, between chainage km 651–653 (Figure 5). The groynes
here are already experiencing significant structural deterioration from ship waves (cf. Fig-
ure 3); the site is thus an ideal site for the pilot study. For this purpose, groynes B29 and
B31 were rebuilt using optimised designs. Mutual interferences stemming from changes to
the loading regime as a result of the rebuilding of the groynes are eliminated by keeping the
intermediary groyne B30 in its current state.

Figure 5: Location of study site at Juelssand with pilot study groynes, indicative bathymetry, loca-
tion of navigational channel and chainage.

36
Die Küste, 89, 2021                                                https://doi.org/10.18171/1.089103

3.1.1 Fairway characteristics
Owing to the proximity of the shipping channel to the shoreline, this area is characterized
by close passing distances and significant ship wave energy, especially in the case of sea-
ward travelling vessels. The distance from groyne tip to the edge of the fairway can be as
short as 65 m. The channel side is very steep with slopes of approx. 1:5 (cf. Figure 5).

3.1.2 Vessel fleet structure
Based on an examination of Automatic Identification System (AIS) data, the distribution
of vessel sizes for which wave events were registered during the monitoring period is shown
in Figure 6. The vessel sizes are relatively evenly distributed, although vessels of the New
Panamax type (on average 366 m length, 49 m breadth) constitute the dominant ship in
terms of loading frequency with over 12.5 % of recorded wave events attributable to this
class. Approximately 4 % of recorded wave heights originated from the currently largest
ULCVs (length > 395 m, breadth > 53 m) sailing on the Elbe Estuary.

Figure 6: Distribution of vessel length for wave events registered at position 1 at B29 (red) and
B31 (blue).

3.1.3 Speed restriction
In January 2018, a speed restriction of 12 kn STW for vessels with lengths greater 90 m
was instated in this part of the Elbe Estuary. In response, the statistical distribution of ship
speeds has changed significantly as shown in Figure 7. The median speed shows a reduction
from 13.8 and 13.5 for B29 and B31, respectively to 12.5 kn. Crucially, the occurrence of
large velocities above 15 kn is significantly reduced.
    The speed restriction falls within the monitoring period and must be taken into account
when interpreting rock armour stability. Since AIS data only provides the speed over
ground (SOG), current velocity data from an operational model (see Section 3.3.3) was used
to derive the corresponding STW for each vessel.

                                                                                                  37
Die Küste, 89, 2021 https://doi.org/10.18171/1.089103
Figure 7: Change of STW with time (left) and distribution of speeds before and after introduction
of speed limit (right).
3.2 Groyne designs
3.2.1 Conventional design
The conventional design follows a two-layered approach. However, the core material is
often pre-determined by the remnants of historical groyne construction. The armour layer
in this area consists of CP90/250 rock grading, typically with high-density iron-silicate rock
with a specific density of approx. 3.4t/m³. The cross-sectional geometry is characterised by
a crest width of 2.0 m and side and head slopes of 1:3 and 1:4, respectively.
3.2.2 Optimised groyne designs
For the new groyne types, shallower slope angles were used, as well as a higher crest level
(Figure 8). The crest width was reduced and rounded to produce a “chevron”-shaped crest.
The difference between B29 and B31 is related to the configuration of the groyne root and
revetment transition. The characteristic pattern of damage (cf. Figure 3) and the under-
standing of wave-structure-interaction point to the fact that the most vulnerable part of the
groyne is the root area due to the focussing of wave energy. Hence, two design solutions
were implemented in this area with the aim of increasing rock armour stability by reducing
loading in vulnerable areas of the groynes. At B29 the transition area from groyne body to
revetment was fashioned as a 25 m wide recess (at its narrowest point) with scour protec-
tion (Figure 8, Figure 9). The intention is to allow wave energy to bypass the structure thus
minimising focussing effects in the root area which lead to overtopping flows on the groyne
body. At B31, the transition to the revetment was profiled to a larger diameter radius of
25 m with the intention of reducing wave focusing and strengthening the groyne in the
root area.
Initially, both groynes were reconstructed using the original rock grading of CP90/250 in
order to assess the efficiency of the geometrical optimisations for increased erosion re-
sistance of the armour layer. These structure variants are referred to as B29v1 and B31v1,
respectively. During the study, groyne B29 was later re-profiled using larger rock grading
LMB5/40 (high-density rock) and monitored for a further 1.5 years. This variant is referred
to as B29v2. The existing revetment in the study area was not changed.
38Die Küste, 89, 2021 https://doi.org/10.18171/1.089103
Figure 8: Comparison of conventional groyne profile (grey dashed) and optimised design profile
in pilot study (black). All levels in mNHN. Not to scale.
Figure 9: Photographs of the optimised groyne root designs taken from the crest of the revetment:
recessed root (B29, left) and large radius root (B31, right).
3.3 Monitoring
The scope of the monitoring programme was defined with the intention of:
• capturing the processes relevant to the wave-structure interaction
• validating the conceptual failure models at prototype scale
• carrying out analyses of the relationships between loading, resistance variables and
influencing factors such as nautical (ship and waterway) parameters
• gathering the data required for the development of design methodology
39Die Küste, 89, 2021 https://doi.org/10.18171/1.089103
With these aims in mind, it was necessary to gather sufficiently long time-series of loading
and resistance parameters. Due to the protected nature of the site as a designated nature
conservation area as well as reduced accessibility of the site, it was necessary to ensure a
high degree of autonomy of the measuring systems in terms of power supply, data storage,
data transfer and troubleshooting. Still maintenance intervals of 2−4 weeks were required
to ensure continued operation of the instruments. The necessary infrastructure for the de-
ployment of the instruments was installed in 2014 and a trial phase was initialised in order
to test and validate the systems. The official monitoring programme began in July 2015 and
ran through until February 2019. The dataset generated by the monitoring programme con-
tains over 2000 records of groyne topography recorded at low tides and between 5000–
26000 ship-related wave events, depending on groyne and exact measurement location.
3.3.1 Structure response
To document the spatial and temporal groyne damage development, the topography of the
armour layer was recorded by means of a stationary land-based 3D geodetic monitoring
system developed and operated by BAW in cooperation with the HafenCity University
Hamburg. The technical details of the monitoring set-up are documented in detail in
Tschirschwitz et al. (2016, 2017); here, only a brief description of the most important fea-
tures is given.
The geodetic monitoring system for each groyne consists of a terrestrial laser scanner
(Zoller+Fröhlich IMAGER 5010) as shown in Figure 10 encased in a custom-built secure
weather-proof housing and mounted on a monitoring platform at a height of 12 m above
ground. The masts which elevate the monitoring platforms were installed by the WSA
Hamburg and secured in position by four steel cables to reduce lateral movement and lean-
ing due to wind and movements in the marshy subsoil. Power to the equipment is supplied
by a solar panel, a small wind turbine and a fuel cell.
Terrestrial laser scanning was chosen due to the requirements for automation and suf-
ficient areal coverage. Furthermore, a high resolution is required to detect the smallest
changes in groyne topography; this allows even small movement of rocks in the armour
layer to be identified and associated to loading conditions. The theoretical spatial resolution
achievable with the described system at the groyne tip, determined by the angle of ray in-
cidence and angle resolution, is given as 1 cm (Tschirschwitz et al. 2016). However, this
theoretical value is significantly reduced as the result of the particular challenges of this
application and operating environment. Shallow survey angles of as low as 5°, particularly
towards the groyne tip, give rise to shadowing effects owing to the rough and undulating
surface of the armour layer. Not limited to shallow survey angles, the strength of the optical
return signal can be significantly weakened by absorption and scattering on the dark, irreg-
ular and often wet surface. This can be exacerbated by weather and meteorological effects.
Measurements can have a degree of ambiguity due to artefacts, spurious measurements or
real obstructions, such as seagulls sitting on the structure. As a result, measurement errors
can accumulate and not all scans are viable. Nevertheless, by means of diligent post-pro-
cessing the plausibility, viability and accuracy of the scans can be ensured; ambiguous scans
that cannot be sufficiently corrected are removed to ensure coherence of the dataset used
for further analysis.
40Die Küste, 89, 2021 https://doi.org/10.18171/1.089103
Figure 10: Set-up for monitoring of groyne topography at low tide levels with pile-mounted laser
scanners. Close-up of the monitoring platform with laser scanner housing.
The damage development is calculated in post-processing by a comparison of the measured
point cloud with the reference measurement. For this purpose, the cloud-to-cloud distance
function of Cloud Compare, an open-source software, is utilized. This function calculates
for each point of the measured cloud a horizontal and vertical distance to the reference
cloud using the nearest neighbour distance, a kind of Hausdorff distance algorithm. The
vertical distance to the reference model determines the deformation of the rock armour
layer. The difference plot is presented as a grid of 1 m, 0.5 m and 0.25 m resolution where
the centroid values are given by the mean of the measured elevations in this raster cell. This
raster is used in the interpretation of damage.
3.3.2 Hydraulic loading
The changes to the water surface level at the structure were measured with pressure sensors
positioned at various locations in the head, foot, root and crest areas of the groynes (cf.
Figure 11). Pressure sensors by Driesen & Kern and RBR were used with a sampling rate
of 1 Hz. The data loggers were installed in the rock armour layer in order to measure pres-
sure fluctuations at the structure level. For this purpose, metal tubing, in which the instru-
ments were housed, were driven into the armour layer as illustrated in Figure 11. The data
loggers were exchanged on an approximately three-weekly rotation in order recharge the
batteries and download the data before the internal data memory was exceeded. Post-pro-
cessing of the raw measurements includes:
• correction for time drift of the internal clocks
• conversion of pressure to water depth, applying the barometric pressure of a nearby
weather station
41Die Küste, 89, 2021 https://doi.org/10.18171/1.089103
• filtering the data with a high-pass filter with cut-off frequency of 1/1800 Hz (30 min)
in order to separate ship-induced and tidal contributions to the pressure signal
• filtering the ship-induced components with a low-pass filter at a cut-off frequency of
1/10 Hz (10 s) to derive a clear signal of the long-period ship waves
• extracting wave events and determining the relevant parameters of the long-period
ship wave (cf. Figure 1)
• correlating the wave events with AIS data
The wave measurements used here encompass the time period of the experiment from
07/2015 to 12/2018 for B31 and 02/2019 for B29. Due to maintenance intervals, failures
and seasonally reduced number of monitoring positions, the record length can vary strongly
between individual sensor locations. Nevertheless, typically a record length of at least
10,000 wave events is available, bar at position 6, where due to the location on the crest
fewer events are recorded.
Figure 11: Distribution of pressure sensors (yellow) and current meter (red) (left). Current meter
only deployed at B29. Set-up and housing of current meter and pressure sensors (right).
Coinciding with the strengthening of groyne B29v2 and recognizing the significance of
overtopping loads, a Nortek Vector single-point acoustic-doppler-velocimeter (ADV) was
installed on the crest to measure overflow velocities. Similarly to the pressure sensors, the
instrument was encased in a plastic tube and installed in the rock armour, approximately
0.2 m above crest level (cf. Figure 11); this puts the point at which the velocities are mea-
sured at roughly 0.35 m above crest level. The orientation of the device was set to align the
x-axis parallel to the expected flow. The sampling rate was 32 Hz. Post-processing consists
of:
• correction for time drift of the internal clocks
• high-pass filter to separate ship induced current from tidal current
• detecting overflow events
• determining the relevant parameters of the ship-induced currents and overflow event
• correlating the wave events with AIS data
The measurement of flow velocities on the groyne crest was undertaken for approx. eleven
months (net) between 11/2017–12/2018. Monitoring of primary wave loads at groyne B29
is ongoing – in a much reduced scope – with pressure measurements at positions 1 and 5
and regular visual and photographic assessments of groyne development.
42Die Küste, 89, 2021 https://doi.org/10.18171/1.089103
3.3.3 Other data
Other data sources include AIS data of vessel traffic which contains information on nauti-
cal parameters (e.g. vessel dimensions, draught, speed through water and passing distance).
Trimonthly profile surveys of topography in the groyne fields are also available from WSA
Hamburg, allowing the influence of the designs on the adjacent beach levels to be exam-
ined. Meteorological data was sourced from a nearby weather station run by the DWD
(Deutscher Wetterdienst). Where needed, current velocity data was extracted from an op-
erational hydrodynamic model of the Elbe Estuary (PROPTEL), as described in Sehili et
al. (2014).
4 Analysis of prototype observations
4.1 Hydraulic loading
The loading regime is described by means of statistical analyses of the pressure and flow
velocity measurements. For this, the available record length in the time period 07/2015 to
12/2018 (B31) or 02/2019 (B29), minus obvious errors and outliers, is typically used unless
stated otherwise. As mentioned above, the sample size varies at each sensor location. For
the purpose of documenting preliminary results, statistics for the entire monitoring period
are given. Some caveats to the interpretation of results associated with this approach will
be discussed in section 5.1.
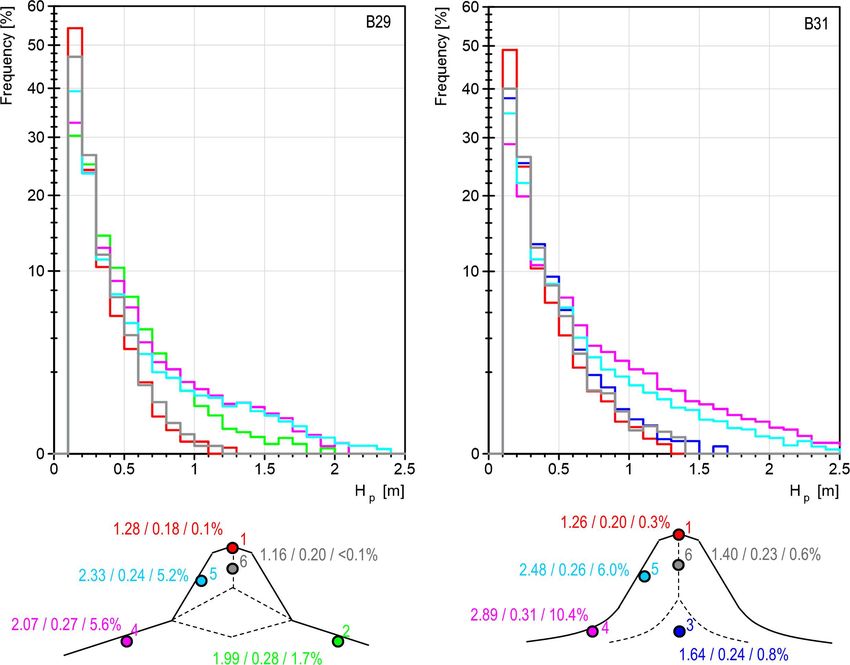
4.1.1 Long-period wave heights
The statistical distribution of wave heights at the measurement locations is shown in Fig-
ure 12. Comparing the wave heights at the groyne heads which are mostly undisturbed
from the effects of wave-structure interaction a similar distribution of Hp magnitudes is
observed. Over 90 % of incident primary wave heights are below 0.5 m. Differences in the
wave regime at this location appear marginal, with a slightly higher median wave height at
B31. The measurements at the other locations are more strongly influenced by the specific
structure geometry. At B29 the maximum Hp was recorded at position 5, however, on av-
erage, larger waves are encountered further toward the root area at positions 2, 3 and 4.
In terms of large wave heights, arbitrarily defined here as Hp > 1.0 m, only 5.6 % of
observations satisfy this condition at position 4. At B31, the largest waves are also experi-
enced in the root area, however the heights are greater. At position 4 over 10 % of the
wave heights exceed 1.0 m and just over 3 % exceed 1.5 m. The comparison of wave
heights at the groyne crests (pos. 6) suggests that somewhat higher loads are experienced
at B31 and a larger number of events exceeding 1.0 m.
43Die Küste, 89, 2021 https://doi.org/10.18171/1.089103
Figure 12: Histograms of wave heights at measurement locations (top). Hp,max / Hp,med / % Hp
> 1.0 m given for each measurement location (bottom).
4.1.2 Overtopping flows
The occurrence and nature of overflow phenomena over the groyne crest are a function of
the water level, the incident primary ship wave height and wave-structure-interaction ef-
fects. As such, overflow can be complete, partial or absent. Velocity measurements are only
possible for flows that achieve a certain minimum inundation depth of the instrument.
Thus overflow was typically only measured for water levels greater than +1.0 mNHN. The
results presented here are based on overtopping flow velocities for 1850 primary wave
events. Values presented here are derived from curves fitted through the high-frequency
measurements and thus do not account for instantaneous velocity spikes due to turbulence
occurring at timescales shorter than 1 Hz.
To characterise loads originating from overflow phenomena the velocity parallel to the
structure cross-section, which corresponds to the velocity along the x-axis Vx, is examined.
The directionality of the load is given by the sign of ±Vx; positive values describe flow in
downstream, seaward direction, and negative values denote flow in upstream direction (see
Figure 13). Thus, for this study, positive (downstream) velocities are relevant for hydraulic
loading of the lee side slope.
44Die Küste, 89, 2021 https://doi.org/10.18171/1.089103
The statistical distribution of the flow velocities |Vx| over the groyne crest is shown in
Figure 13. Tidal flow effects have not been removed here. Although the most common
values are below 0.5 m/s, velocities in the downstream direction show a significantly larger
proportion of higher values, indicating the higher loading caused by seaward travelling
ships. Approx. 27 % of flows in downstream direction are over 1.0 m/s, whereas less than
13 % exceed this threshold in the opposite direction. The maximum flow velocities com-
monly exceed 2.0 m/s, in rare cases overflow velocities exceeding 3.0 m/s have been re-
corded.
Figure 13: Frequency of occurrence of overtopping flow velocities at groyne B29 (left). Relation-
ship between Hp and Vx (right).
The overflow process, as described by the event-associated parameter Vx is dependent on
ship wave celerity, ambient (tidal) flow and modified by its interaction with and transfor-
mation over the structure. The relationship between the overflow velocity and the primary
wave height at the groyne crest shows that flow velocities, in general, tend to scale with Hp.
4.2 Damage development
The damage to the armour layer is assessed by means of changes to the surface elevation
between two surveys, as given by difference plots of the survey data. Figure 14 shows the
deformation of the rock armour layer in the first groyne variants (B29v1, B31v1) and sup-
porting photographic evidence taken on or close to the date of the survey. The difference
plots represent the damage observed between the reference survey in July 2015 and another
survey in April 2017, corresponding to a period of 645 days (~1.75 years). Over 6000 ship-
induced long-period wave events were registered in this time period. For B29v1 some de-
formation of the crest and lee side slope area are observed; up to approx. 0.7 m of erosion
are recorded here, with greater displacement of rock armour toward the groyne head. The
wave-facing slope and the scour protection have remained stable. In contrast, groyne
B31v1 displays much more severe deformation of the rock armour layer. The crest is
45Die Küste, 89, 2021 https://doi.org/10.18171/1.089103 destroyed over nearly the entire length of the structure and erosion of 1.0–2.0 m, locally exceeding 2.0 m are observed. This has resulted in the exposure of historic groyne con- struction efforts, which form the core of the structure. The displaced rocks have been re- deposited, predominantly at the groyne foot on the lee side, as a result of the asymmetric loading from overflow events, leading to a flattened and widened appearance. The root area has remained remarkably stable. Figure 14: Damage development at B29v1 and B31v1 visualised as difference plots between 07/2015 and 04/2017. Crosses indicate exceedance of scale. Photographs of the groyne condition at or near time of survey. The analysis of difference plots suggests that individual events, or the grouping of one or more relatively high-energy events can effect significant damages in the short period of time between consecutive low waters. One such example is illustrated in Figure 15 which shows the damage incurred at B31v1 between low water on the 4th and 5th of August 2015. A crest-parallel deformation of the lee side slope in the order of ±0.2 m (average value for a 1 x 1 m raster cell) is observed, suggesting erosion on the order of approx. one layer of rock. Also shown are the wave events registered in this time. One extreme event with Hp = 2.3 m, among other events of up to 1.0 m, was recorded. The largest event was asso- ciated with a vessel of 363 m length and 46 m breadth travelling seaward with 13.7 kn STW and 11.5 m draught at approximately mean water level. The vessel passed the groynes at a distance of 187 m. 46
Die Küste, 89, 2021 https://doi.org/10.18171/1.089103
Figure 15: Damage development at B31v1 between two consecutive scans and measured wave
heights at the groyne (pos. 5). Crosses indicate exceedance of scale.
Although B29v1 shows significantly enhanced rock armour stability compared to B31v1
despite the same rock grading, the observed damage after only 1.75 years did not satisfy
the objectives of sufficiently increased armour layer stability. Subsequently, the groyne was
rebuilt with a coarser grading of LMB5/40 and a reference condition for variant B29v2 was
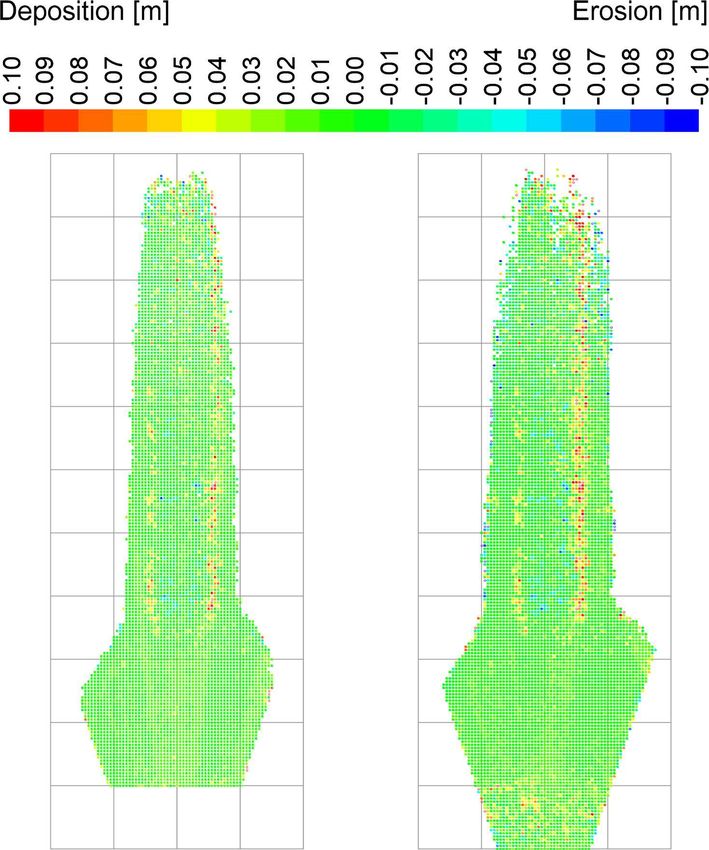
scanned in November 2018. The changes to the rock armour over the time period of 442
days (~1.5 years) to the last scan in February 2019 shows only minor local deformation of
typically less than 0.05 m on the wave-facing side and 0.1 m on the lee side (Figure 16) This
can be attributed to an initial rearrangement and self-armouring of stones into a more stable
position. The deformation pattern follows the previously described crest-parallel pattern,
indicating the areas most affected by overflow events. The improved stability and condition
of the rock armour layer was confirmed in recent manually conducted scan in December
2019 (Figure 16). It shows that after approximately two years, still very limited damage to
the crest and lee side slope in the order of ±0.1 m is recorded.
47Die Küste, 89, 2021 https://doi.org/10.18171/1.089103 Figure 16: Damage development at B29v2 with larger rock size LMB5/40 visualised as difference plot between 11/2017 and 02/2019 (left) and 12/2019 (right). 5 Discussion of findings 5.1 Interpreting measured wave heights The wave heights presented in section 4.1.1 were derived from statistics calculated over the entire monitoring period. While this is justifiable in order to present a simple first overview of loads, a more differentiated examination of the measurements is required to understand the important nuances of wave-structure interaction and groyne performance. As is the nature of prototype field studies, a large number of environmental variables remain uncon- trolled, which poses some additional challenges in the correct interpretation of the meas- urements. Accounting for, as far as possible, the isolated and combined effects of these influencing factors is necessary for a true understanding of the measured wave loads. The major factors in this study are the deteriorating groyne condition, the vessel speed re- striction and changes in groyne field morphology. 48
Die Küste, 89, 2021                                               https://doi.org/10.18171/1.089103

    As shown in section 4.1, groyne damage typically manifests as a reduction in the crest
level which in turn directly affects the wave-structure interaction, typically leading to lesser
resistance to the wave. The measurements at B31, in particular, are strongly affected by
this. As a result, wave heights at positions 4 and 5 tend to diminish with time. In contrast,
the measured wave height at position 6 tends to increase with time, as the instrument is
lowered with the deteriorating crest level. When examining the wave-structure interaction
of a specific groyne design, only the measurements up to a certain damage condition will
be representative of the performance. With respect to B31, the implication is that the actual
hydraulic performance of the groyne design is somewhat misrepresented by a statistic over
the entire period as presented here.
    While the true impact of the speed restriction is yet to be examined, an analysis of the
wave records at the groyne head has shown that the median wave height is reduced by
approx. 1–2 cm, whereas more pronounced reductions are suggested at the other probe
locations. This poses a challenge to the comparability of wave loads throughout the study
period and implies that these two periods should be considered separately, when determin-
ing the stability of the rock armour to a certain load.
    Further complication is given by the fact that groyne fields are subject to erosion and
sedimentation through the monitoring period which in turn modulates wave transfor-
mation and energy dissipation in the nearshore area. Morphological changes were moni-
tored in trimonthly profile surveys and analyses of this topographical data suggests that the
beach levels display an average variability of approx. ±0.2 to ±0.4 m throughout the exper-
iment.
    Despite the mentioned caveats, the simple presentation of results chosen here allows a
discussion of the general trends in wave-structure interaction and groyne performance.
Further more detailed examination of the field data is currently being carried out to account
for and untangle the contribution of the individual factors for the interpretation of wave
heights. This will be required when conducting detailed investigations into the stability of
the armour layer or secondary research questions such as e.g. the efficacy of the speed
restriction in reducing wave heights on shoreline infrastructure and the understanding of
groyne field morphological in the light of ship-borne loads, dredging activities and other
environmental parameters.

5.2 Performance of optimised groyne designs
The key to increasing the stability of the armour layer that is subject to long-period ship
waves is to reduce as far as possible the magnitude of flows over the groyne root and crest
areas. In practice, this can be achieved by reducing wave focussing in the root area and
increasing the dissipation of wave energy in the groyne field and at the structure. The latter
can be achieved by reducing slope angles and increasing porosity of the structure slopes.
While overflow cannot be practicably avoided in tidal waters, this study proves that the
flow magnitudes can be reduced by means of design modifications.
    While the wave height at the groyne head is largely independent of groyne design, the
wave heights at locations around the groyne body reflect the wave’s characteristic interac-
tion with the structure (and nearshore) as it experiences dissipation, shoaling, reflection and
refraction effects, thus allows the hydraulic performance of the groyne to be described and
assessed with respect to reducing loads on the rock armour layer. One commonality of the

                                                                                                 49
Die Küste, 89, 2021 https://doi.org/10.18171/1.089103
two designs is that the wave-facing side experience the largest wave heights as can be ex-
plained by the closer passing distances of seaward travelling ships. Wave heights increase
toward the root area at both groynes due to wave shoaling, but also focussing and reflection
effects. While this effect is quite pronounced at B31, it is much more subtle at B29 as the
recess allows bypassing of wave energy through the root area. The smaller wave heights
recorded at the crest of B29 in conjunction with the observation of much reduced damage
suggests that fewer and less severe overflow events are experienced at the recessed groyne,
despite the fact that no overflow was measured. At B31, arguably, the objective of improv-
ing the groyne root stability is achieved; however, this comes at the cost of an unfavourable
increase in overflow loads over the groyne crest and body. At both groynes little to no
damage is observed on the wave-facing side, leading to the conclusion that wave height
alone is not the decisive factor in the structure deterioration and the load case Rc > 0 is
typically not problematic. It also implies that the overflow due to primary waves produced
by ingoing vessels is also subcritical at this location.
In terms of forces acting on the crest and lee side slope, it has been shown that high
velocities of up to 2.5 m/s are possible. When high-frequency turbulent velocity fluctua-
tions (> 1Hz) are considered the data shows that intermittently acting velocities can be
significantly higher than the values quoted in section 4.1.2, with implications for additional
lift and drag forces on the rocks in the armour layer. It is not surprising then to see the bulk
of the damage occur at the crest and in particular at the lee side slope. It follows that the
design conditions for the dimensioning of rock armour with respect to long-period waves
is given by the load case Rc ≲ 0, as hypothesized by BAW (2010) and Gier and Schüttrumpf
(2012). Analysis of the relationship between the measured overflow velocities and corre-
sponding wave heights at B29 have shown that Vx appears to scale with the wave height;
thus an increase in wave energy at the crest will tend to increase the flow velocities and
shear stresses on the crest and lee side slope. Further, the most damaging situation will arise
when a large stern wave coincides with a large drawdown and a tidal water level which is
conducive to maximising the length of exposed lee slope, assumed to typically occur around
Rc ≈ 0. With decreasing freeboard (Rc < 0), the potential for higher flow volumes increases
whereas the exposed length of slope is reduced, the exact configuration of these two pa-
rameters being specific to each ship passage. While flow velocities are an indication of
destabilising forces, typically the overflow volume will be more relevant in determining
rock armour stability. Ways of determining overflow volumes from this field data set with
a view to estimating critical discharge values are currently being evaluated.
The intended function of the groynes, concentrating the flow in the main channel and
supporting water levels during low water, is not forfeited by the recessed design. The
groyne acts as a conventional groyne during low water as the recess is above the discharge-
relevant wetted perimeter. The morphological developments in the groyne fields show that
no erosion effects arise from the recessed root. Adverse array effects on morphodynamics
arising from multiple recessed groynes seem unlikely, however should be considered in any
scheme implementation. Negative impacts on the stability of the adjoining revetment was
also not observed.
50Die Küste, 89, 2021 https://doi.org/10.18171/1.089103
5.3 Increasing the stability of rock armour layers
A number of different approaches can be adopted to increase the stability of rocks in the
armour layer. This includes e.g. the use of a larger rock size or higher density rock (in
conventional or optimised design), geometry optimisation for improved wave-structure-
interaction as attempted in this study or management options to reduce ship-borne wave
heights.
In the case of structural damage, using a larger rock grading or higher density rock is
always a potential remedy. The damage pattern suggests that an increase in rock grading on
the crest and lee side slope only could also be a viable solution. To date there is no valid
method to determine the adequate rock size for groyne overflow from long-period waves,
thus the choice of rock grading has to be based on engineering expertise, knowledge of
local conditions or, in the worst case, trial and error. The prototype observations have
confirmed the dominance of overflow processes for the deterioration of the groyne rock
armour. In this sense, there are parallels with phenomena in the field of hydraulic engineer-
ing such as weir flow and critical flow on riprap-armoured embankments and spillways with
their respective empirical formulae (e.g. Isbash 1935, Abt et al. 2013). However, there are
also important distinctions which are characteristic to long-period ship waves such as the
influence of the dynamics and momentum of the wave on the destabilisation of rocks.
Further it has to be considered whether spillway flow can develop in a meaningful way
considering the wave dynamics and the exposure time of the lee side slope to the overflow
(Gier and Schüttrumpf 2012). Work is currently ongoing to determine the suitability of
these methods for rock sizing.
This study has shown that structural resilience can be increased by improving the wave-
structure-interaction. The recess has shown to be effective in reducing hydraulic loads.
Further optimisation should be explored, e.g. by assessing the performance of the recess
as a singular measure, i.e. retaining the conventional groyne profile without changing side
and head slope angles. A beneficial side effect of the recessed groyne can be in the promo-
tion of aquatic habitats. Varying flow patterns in groyne fields with implications for their
morphological and sedimentological make-up has been shown to increase the diversity of
aquatic habitats in non-tidal rivers in Kleinwächter et al. 2017. Similar diversifying effects
can be expected in estuaries.
Mitigating the wave loads at the source is also possible, but requires an understanding
of how the nautical factors, in particular those that can be managed by vessel traffic regu-
lations, influence the height of the near-shore wave at a specific site. Although the physics
indicate the expected correlations between nautical parameters and incident primary wave
heights, examination of the relationships in the field data set shows significant scatter, as
would reasonably be expected. Nevertheless, certain parameter constellations can be iden-
tified which appear to favour the occurrence of large waves. At the study site for example
the largest waves appear to be facilitated by conditions of highest vessel speed and channel
blockage. Channel blockage is given by the blockage factor S=AC/AS, the ratio of the
cross-sectional area of the waterway AC and the ship’s immersed midship-section AS. It
follows, that the blockage factor in a certain waterway cross-section is a function of ship
breadth, draught and water level. To also account for the passing distance, the partial chan-
nel blockage factor SP =AC,p/AS,p is introduced. Hereby only the part of the waterway
cross-section and immersed midship-section comprising the area between vessel centreline
51You can also read